How to Read a Request Waterfall Chart
Waterfall charts show what network requests are made when loading a web page. They are often used to analyze site speed and identify opportunities for optimization.
Website waterfall analysis is supported by many web performance tools, for example:
- DebugBear site speed monitoring
- The free DebugBear Site Speed Test
- WebPageTest one-off tests
- Chrome DevTools' Network tab
This article explains how to read a request waterfall using examples across the web.
How to generate a request waterfall for your website
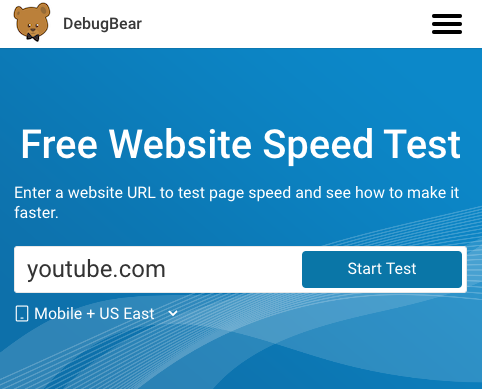
You can use the DebugBear speed test to analyze your website and generate a request waterfall.
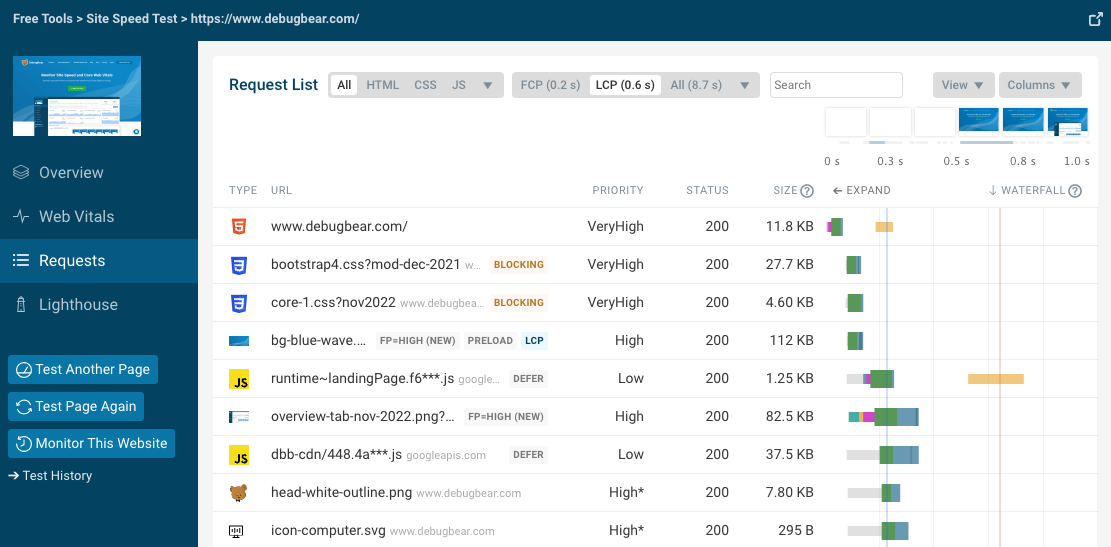
You can find the waterfall visualization in the Requests tab.
Introduction to the the waterfall visualization
Fundamentally, each waterfall chart is a list of network requests. Usually the requests are in chronological order, so you can see the HTML document request at the top.
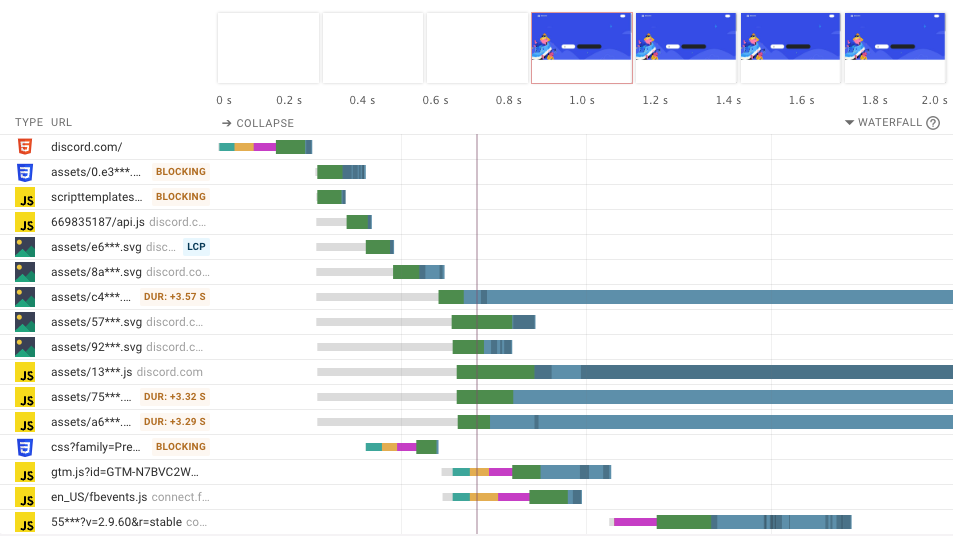
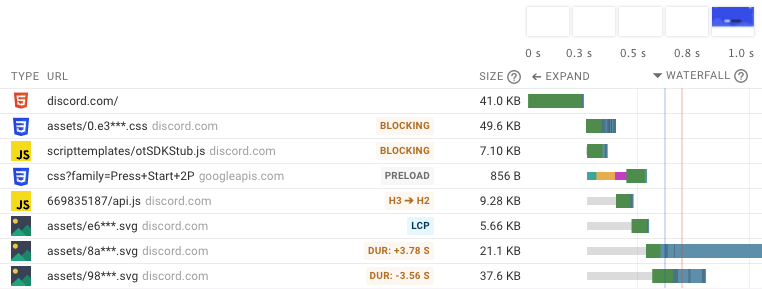
After that you can see various requests for resources that were references in the HTML code, for example CSS stylesheets and JavaScript code. For example, here's the waterfall visualization for the Discord homepage.
Each row shows key bits of data about the request, such as the request type, URL, and whether the request is render-blocking. Finally we have the actual waterfall visualization: this shows when the request starts and finishes, broken down into different components.
Requests shown on the left of the chart are made early, while requests on the right are made later. The longer the bar is the longer the request takes to finish.
Server connections
To load a resource from a website, the browser first needs to establish a connection to the server and then download the resource. Requests can be broken down into these components:
- DNS: getting an IP address for the server based on the domain name, for example converting
example.comto93.184.216.34 - TCP: establishing a reliable way of communicating with the server
- SSL: establishing a secure/encrypted way of communicating with the server
- TTFB/server response time: actually requesting a resource form the server (e.g.
/public/logo.png) and waiting for the response
These steps are done sequentially and each requires at least one network round-trip. Performance tools usually collect data on a throttled network connection, with a certain minimum round-trip time (RTT). In this case the RTT setting is 40 milliseconds, which is why each step in the list above takes longer than that.
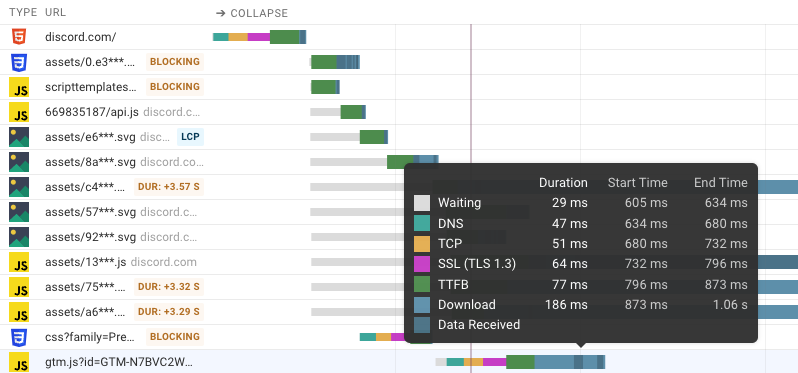
In some cases you'll also see "Waiting" time – this usually means that this is a low-priority request and the browser isn't allocating resources to it for now.
Once the server has started to respond to the request, the response body needs to be downloaded. Some waterfall views highlight when data for each request is received. If multiple requests are in progress but bandwidth is only used to download one response that usually means that this request has a higher priority.
Connection reuse
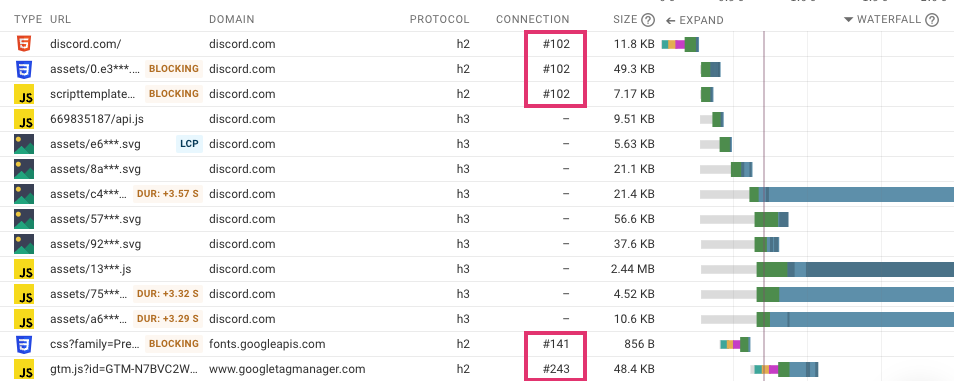
When looking at the waterfall chart above you may notice that most requests don't actually have a DNS, TCP, or SSL component. That's because browsers can use the same connection for multiple requests.
In this example you can see that the browser only creates one connection for discord.com and then reuses that connection. When connecting to a different domain, connect.facebook.net, a new server connection is created.
(Why do some connections not have a connection ID? I'm not sure, I think Chrome just doesn't report a connection ID for HTTP/3 requests.)
Correlating requests with the filmstrip
Site speed doesn't only depend on network requests, so many tools show additional data, like CPU activity, in the waterfall timeline.
A filmstrip recording shows what the website looked at different points after navigation. Users want to see content quickly, and combining the filmstrip with the request waterfall allows you to identify rendering optimizations.
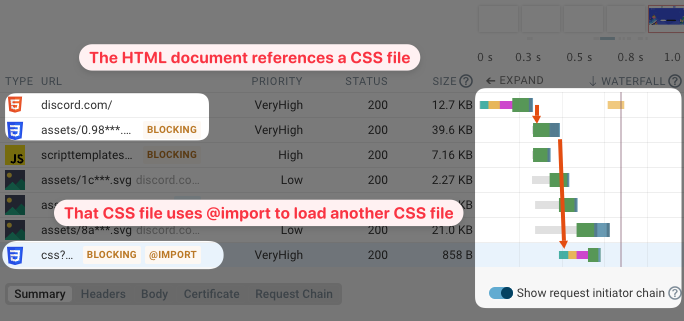
Let's look at the Discord waterfall again. It's pretty typical and starts with an HTML document request followed by a stylesheet and a script. Both the script and stylesheet are render-blocking, so while these requests are in progress the filmstrip only shows a plain white background.
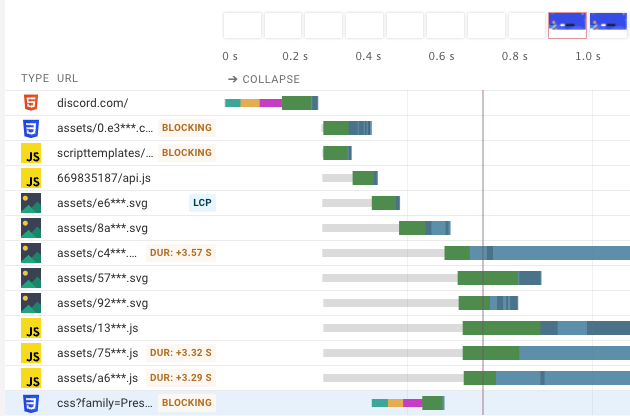
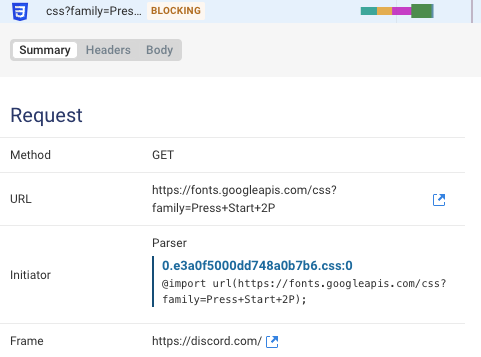
However, interestingly the page still doesn't render after both of these requests have finished. Instead, another blocking request starts, downloading CSS from Google Fonts.
If we look at the request details we can see that the original CSS file referenced the Google Fonts CSS via @import().
We end up with a render-blocking request chain that's longer than necessary, and it takes longer for content to appear for the user.
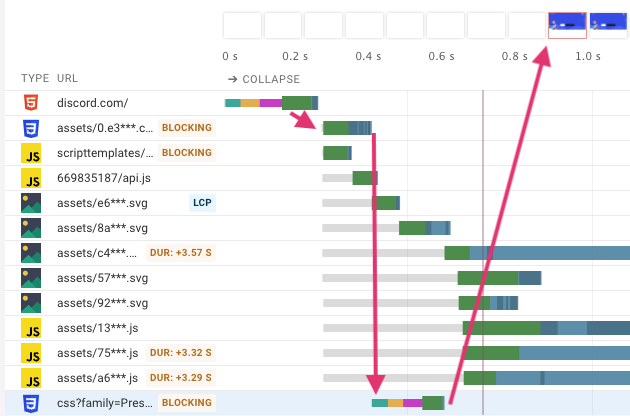
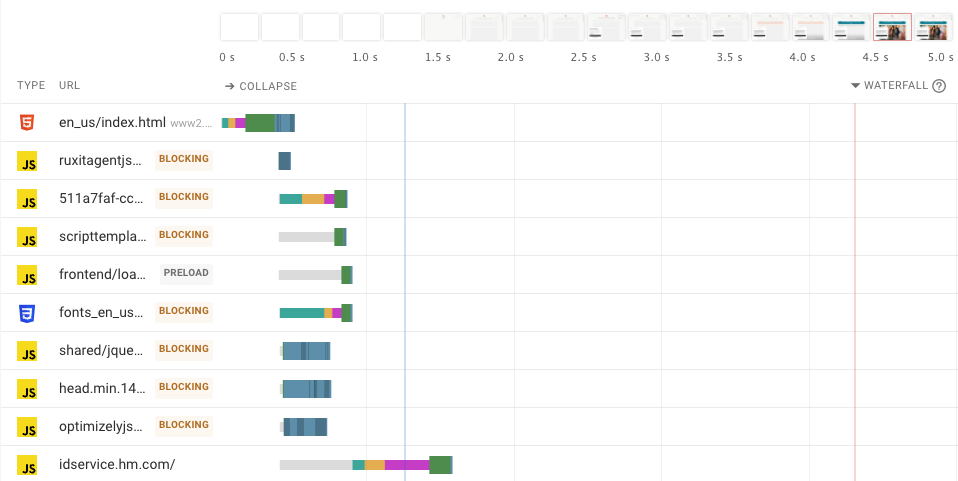
How could we fix this? Instead of waiting for the browser to discover the fonts CSS after downloading the main page CSS, we need to tell the browser about the fonts CSS early on. This is what browser resource hints are for.
<link rel="preload" as="style" href="https://fonts.googleapis.com/css?family=Press+Start+2P">
After adding the snippet above to the page HTML the browser starts loading the fonts CSS in parallel with the other render-blocking resources. (I used the DebugBear Experiments feature, but you can also use local overrides in DevTools.)
Metrics in the waterfall
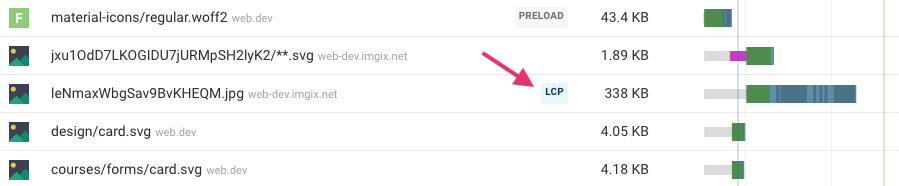
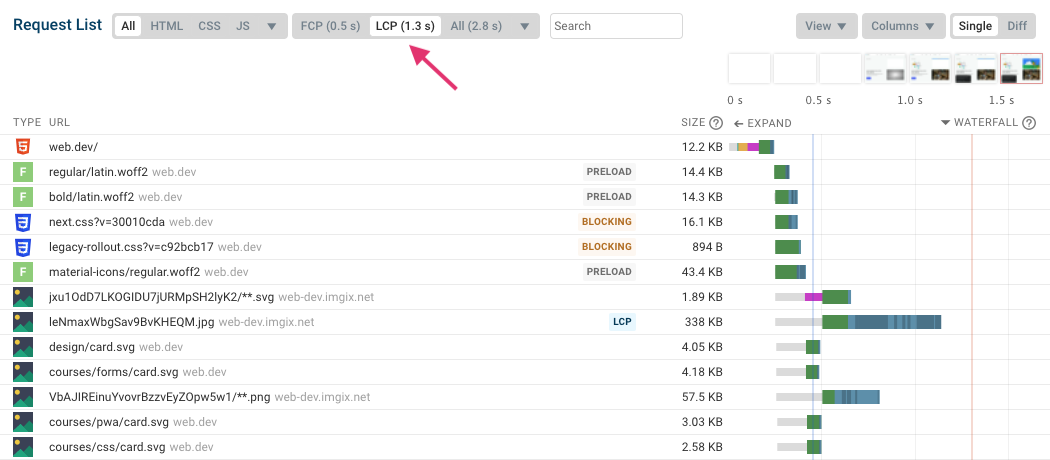
Waterfall visualizations also often include rendering metrics. For example, the blue line in the screenshot below indicates when the First Contentful Paint happens, while the red line shows the Largest Contentful Paint.
If the LCP element on the page is an image DebugBear also highlights this.
CPU activity in the waterfall
Some tools show CPU activity for specific requests. For example, DebugBear shows long main thread CPU tasks that are attributable to a specific URL.
Sequential request chains
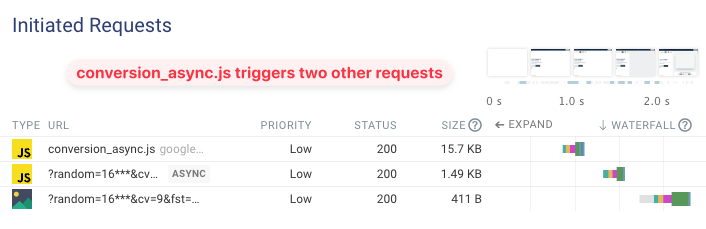
Once a resource has been loaded it can start a request to load another resource, for example a JavaScript file loading JSON data. These sequential request chains can slow down the page.
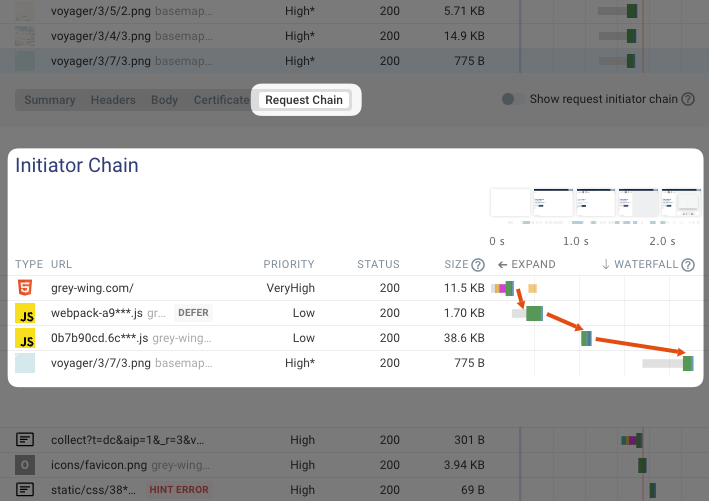
The Show request initiator chain option shows the chain of requests leading up to the selected request.
The Request Chain tab shows a waterfall that only contains requests that lead up to this request.
If the selected request is an initiator for other requests these Initiated Requests will also be shown.
Comparing request waterfalls
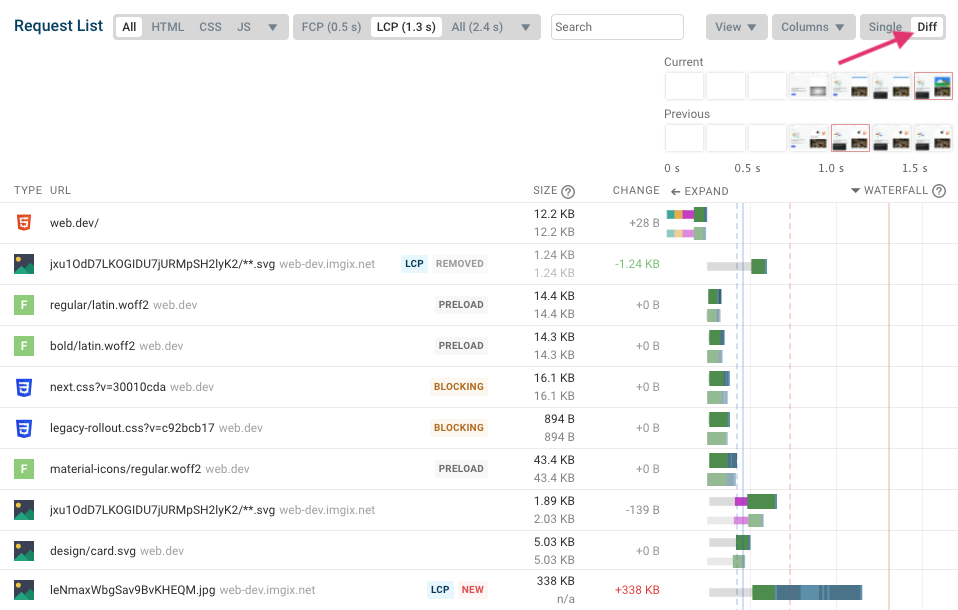
Often the reason to look at a request waterfall is because you've seen a regression in your performance metrics. Many tools allow you to view multiple waterfalls side by side or overlayed on top of each other.
The Diff view in DebugBear can show you if new requests were added or if the timing of existing requests has changed.
Zooming in on parts of the waterfall
Pages can sometimes take 10 or more seconds to load, but only the early parts are actually important to the user. On DebugBear you can view only the requests where the download started before a certain milestone, for example the Largest Contentful Paint.
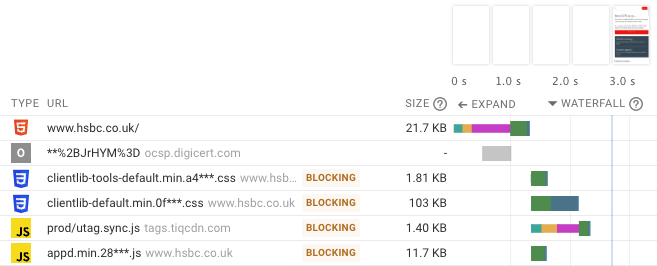
OCSP requests
Sometimes when looking at the waterfall you might see requests to domains like ocsp.digicert.com. These are requests the browser makes as part of the SSL connection to check if the certificate has been revoked.
Chrome only makes these requests for Extended Validation (EV) certificates, so you can speed up your site by switching to a standard certificate. In the past, browsers used to visually mark sites with EV certificates as especially safe, but this is no longer common.
HTTP/1.1
Prior to HTTP/2, each server connection could only be used to make one HTTP request at a time. To make multiple concurrent requests, browsers need to create multiple connections to the same origin. You can see this in the request waterfall below.
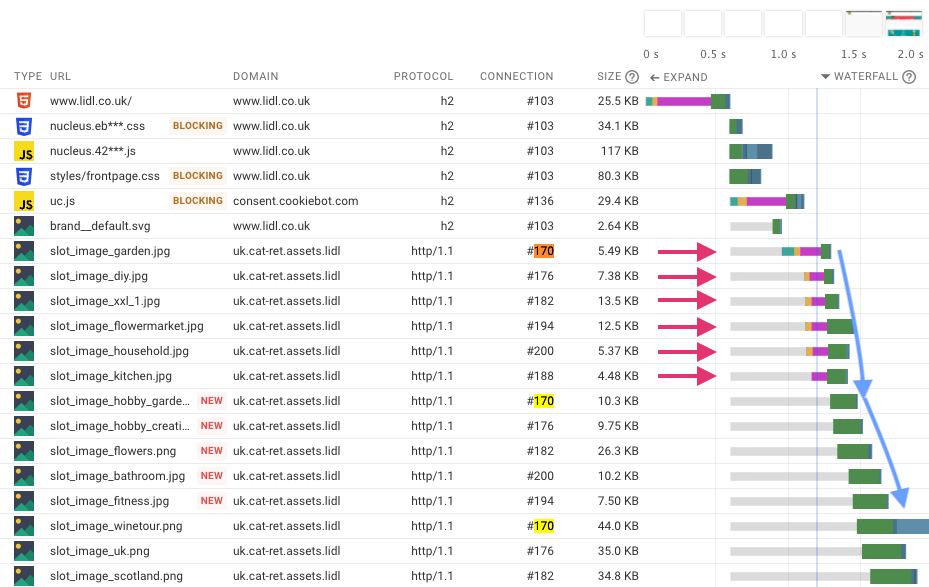
Browsers only create up to 6 connections per origin. If the page loads more than 6 resources from the same origin, browsers wait for the other requests to finish first. In the example above, connection #170 is used for three different requests.
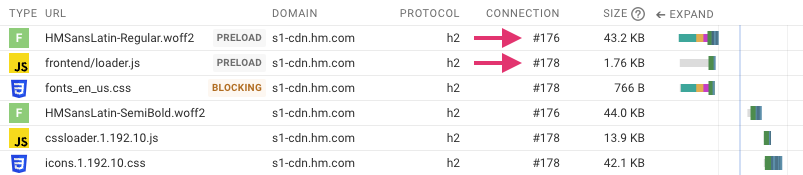
Non-credentialed requests
Sometimes HTTP/2 requests to the same domain end up using multiple connections. This happens because credentialed and non-credentialed requests usually require separate connections.
This tends to be most noticeable with font requests, which are never loaded with credentials (like cookies for example).
HTTP Redirects
Servers will usually respond with a redirect if a resource has moved to a different URL. Redirect chains and other unnecessary redirects can increase the time visitors have to wait until they can see page content.
In this example, www.uniqlo.com redirects to www.uniqlo.com/us/en/home, which in turn redirects to www.uniqlo.com/us/en.
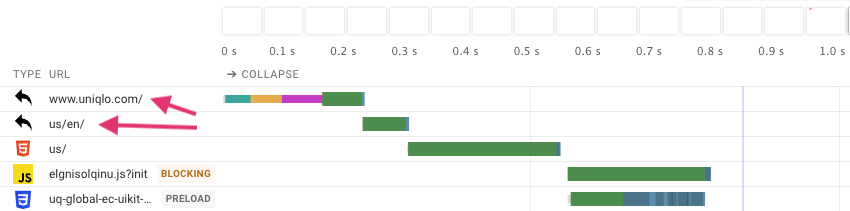
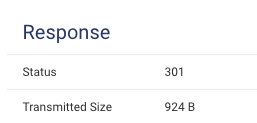
Redirects will have an HTTP status code that starts with the number three when looking at the request details, for example 301.
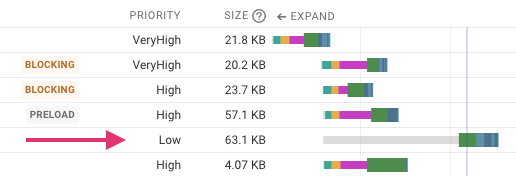
Request priority
Each network connection only has a limited amount of capacity, and browsers try to allocate those resources to the most important request first. If a request is low-priority it will be delayed until later on in the page load process.
This waterfall shows an example of that. The top of the page references a bunch of resources, most of them render-blocking and therefore high-priority. But one of the scripts uses the defer attribute, so the browser waits after discovering the resource and only starts making the request later on.
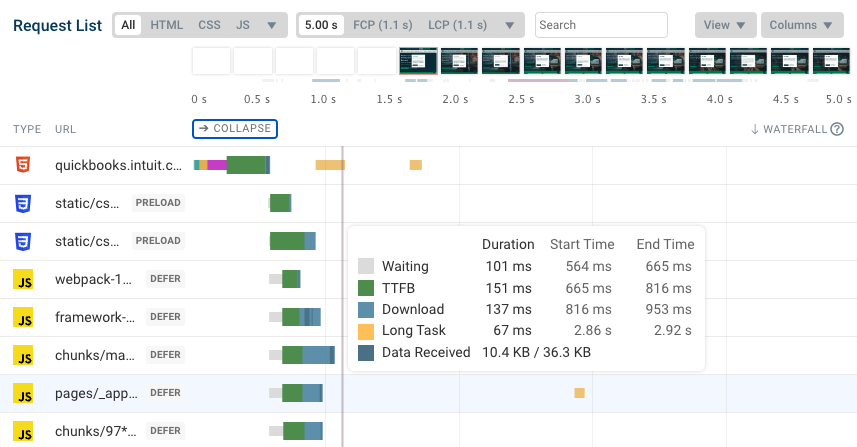
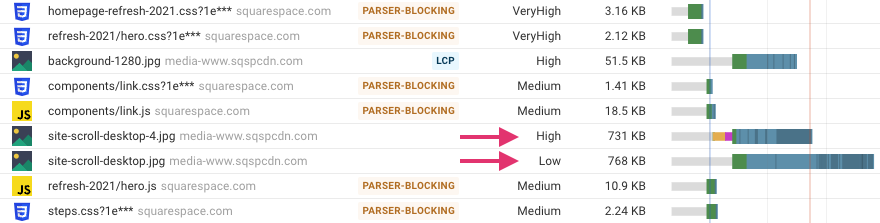
Download size
In addition to the client-server round-trips required to request a resource, downloading the response can also take a significant amount of time.
This waterfall shows two fairly large images being loaded. Even though both start at the same time, one is high priority and finishes before the other. The darker areas in the download bar show each data chunk being received by the browser. Practically no bandwidth is allocated to the low-priority request while the high-priority request is still in progress.
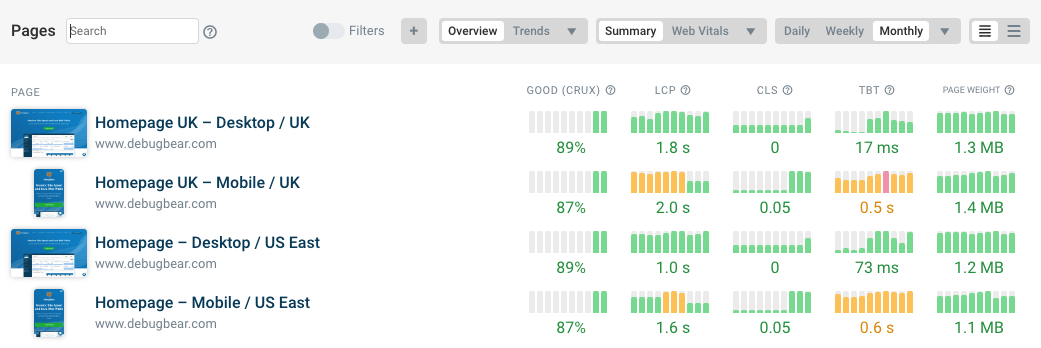
Monitor and optimize your Core Web Vitals
Trying to figure out how to speed up your website? DebugBear offers in-depth performance testing, including an innovative custom waterfall visualization.
Track site speed over time and get alerted when something goes wrong. Start your free 14-day trial now.
Monitor Page Speed & Core Web Vitals
DebugBear monitoring includes:
- In-depth Page Speed Reports
- Automated Recommendations
- Real User Analytics Data