Website Monitoring Metrics
Tools like DebugBear and Lighthouse capture many different metrics to describe the speed of your website. This guide explains what these metrics mean and how to work with them.
Types of page speed data
Web performance metrics can be collected in different environments. DebugBear reports three different types of data.
Lab Data reports how a website performs in a controlled test environment using defined parameters such as network speed, location, and device speed.
CrUX Data is collected automatically by Google based on real Chrome user visits. The results aggregate visits by different users across a 28-day period.
RUM Data provides is collect from real users using an analytics snippet installed on the website. In addition to aggregate metrics, RUM data also surfaces individual user experiences.
Load time milestones
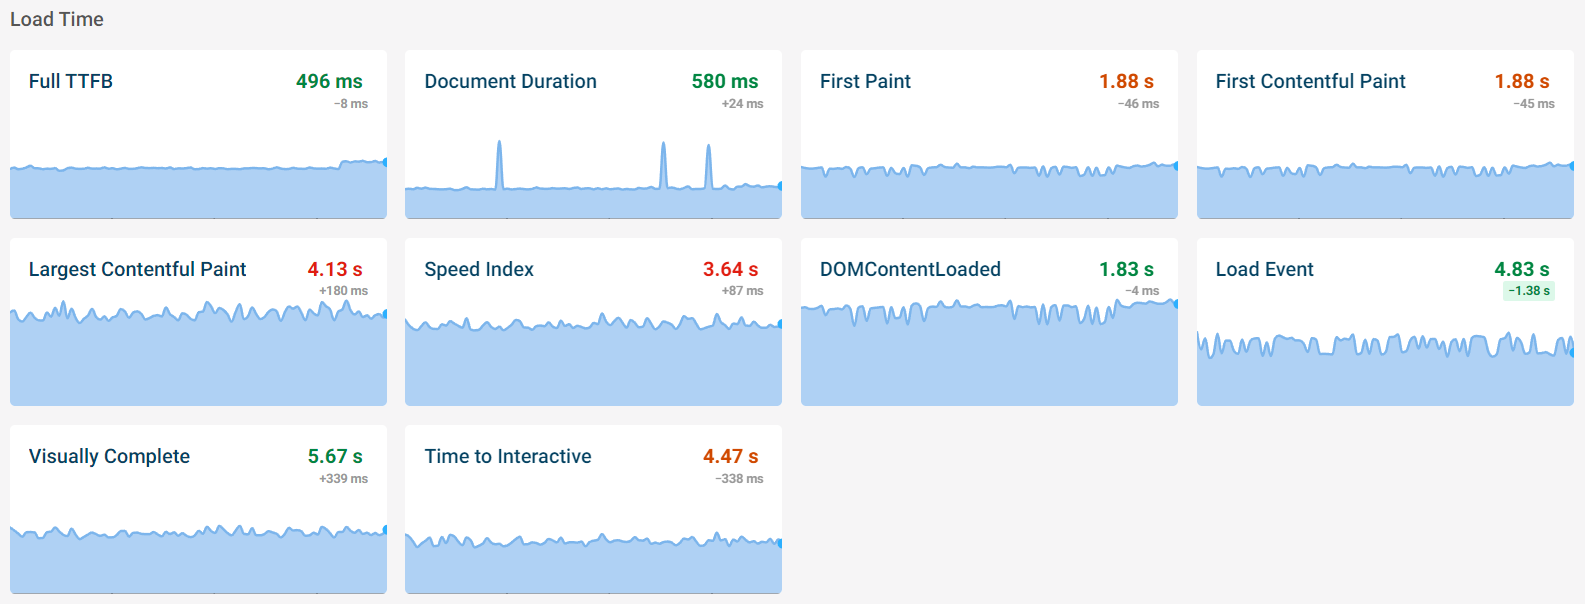
Page load timings measure how much time has elapsed since the browser started navigating to a URL. Each timing describes a different progress event, from the initial rendering of the page to the page having fully loaded.
The lower these timings are, the faster the website loads for the user.
First Paint (FP)
This timing indicates that the user started seeing something other than a blank page. This might just be a page background color or outline without useful content.
First Contentful Paint (FCP)
The First Contentful Paint occurs when text or an image has rendered.
Render-blocking stylesheets or web fonts can delay the First Contentful Paint.
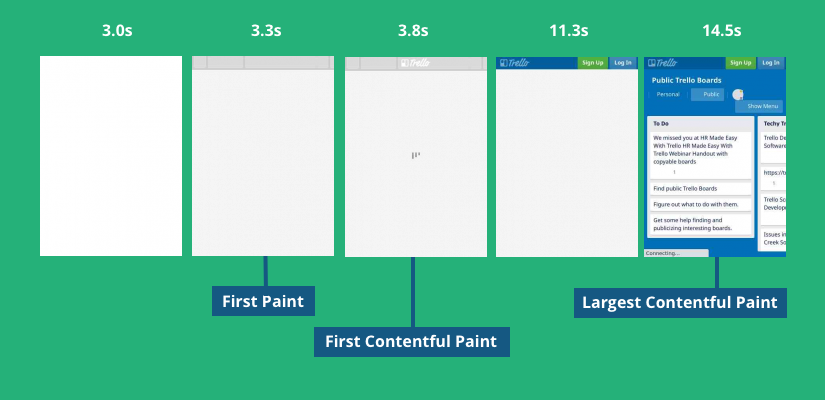
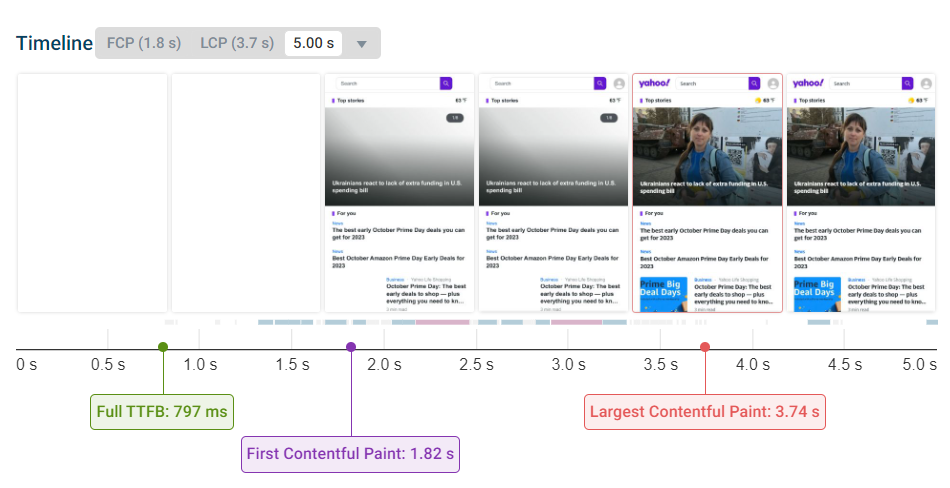
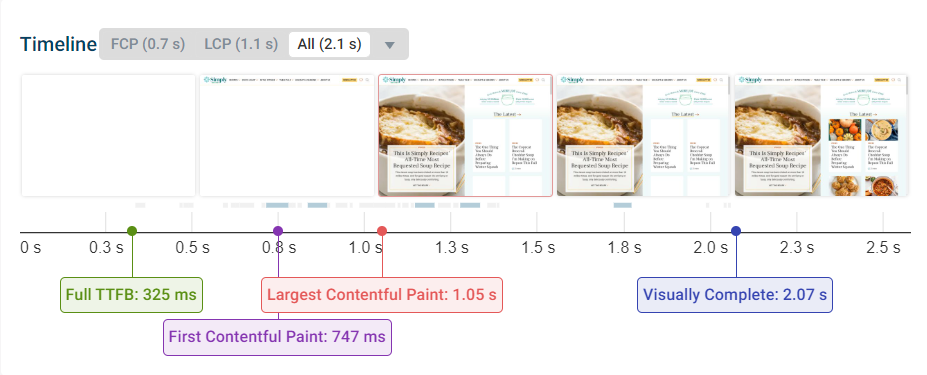
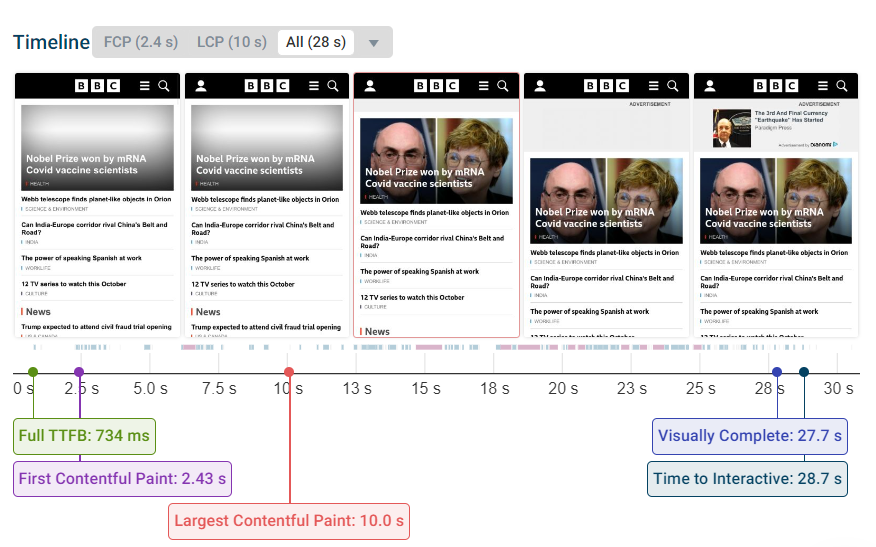
Largest Contentful Paint (LCP)
This metric describes when the largest contentful element on the page is rendered. Images and elements with background images count as painted only once the image has loaded.
For example, in this filmstrip the Largest Contentful Paint only occurs at 3.74 s.
Time to Interactive (TTI)
A page is interactive when there are:
- No more than two GET requests are in progress (network quiet)
- No more main-thread CPU tasks taking longer than 50ms (CPU quiet)
The Time to Interactive generally indicates when the page has fully loaded. Lighthouse ends its test when both the network and CPU have reached an idle state. On DebugBear you can control this behavior with injected scripts that return promises.
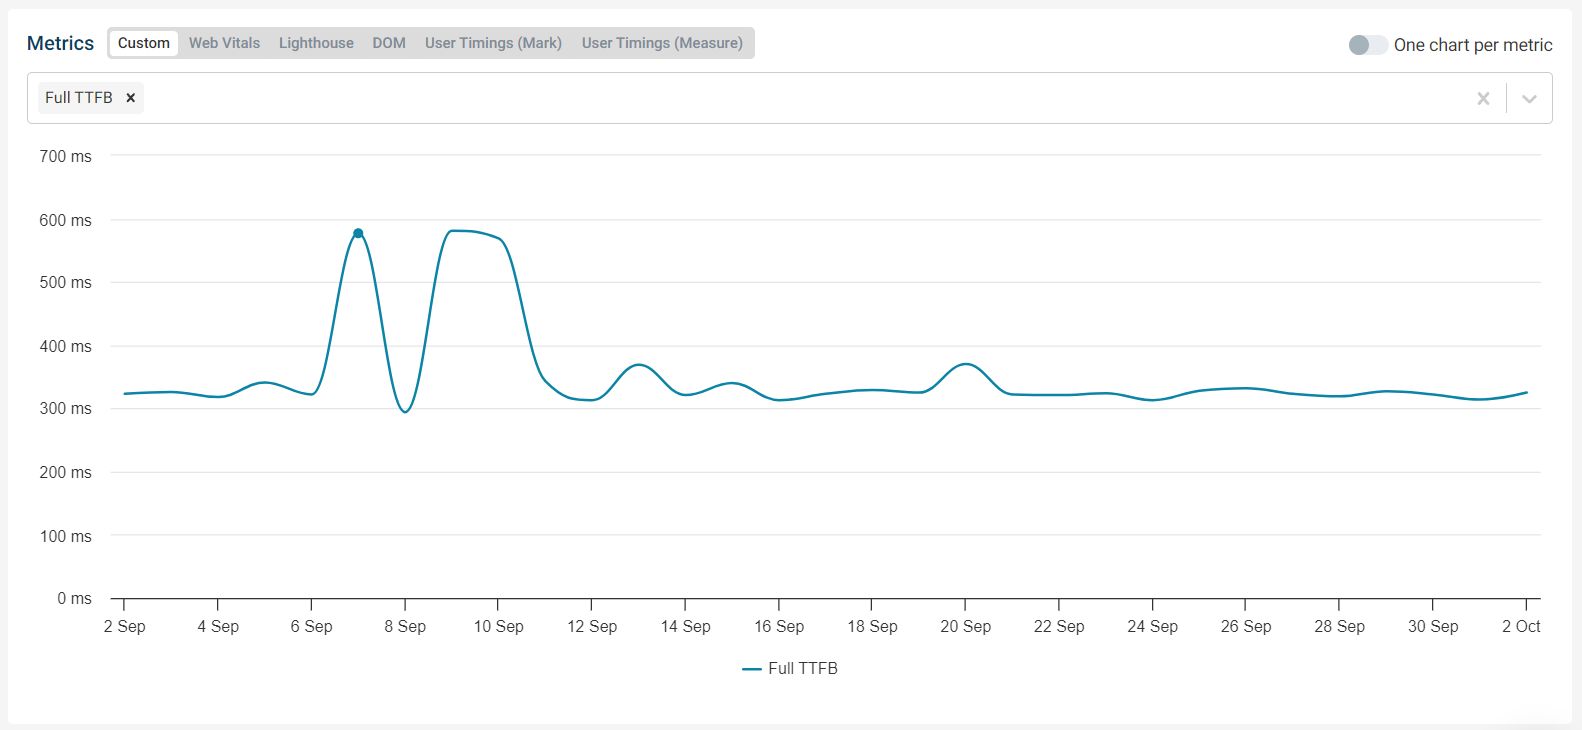
Time to First Byte (TTFB)
The TTFB describes how long the server took to respond to the initial document request.
Unless otherwise specified, the TTFB metric describes the initial document request. This is usually the most important metric, as the browser can't render anything or make additional requests until it has received an HTML response from the server.
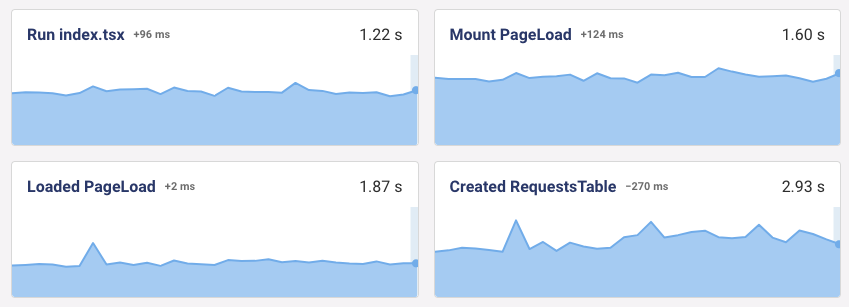
User Timings
User timings are custom timings created by your website by calling performance.mark.
Unlike other metrics, user timings can track the metrics that are most important to your users. General-purpose browser metrics can sometimes be misleading, for example when a page reaches an interactive state while the app is still loading data and just rendering a spinner.
Document Duration
Duration of the entire document request, including establishing a connection and download time.
Speed Index
The Speed Index measures how quickly most of the page content is rendered. Unlike Largest Contentful Paint it does not focus on a single UI element being rendered but instead looks at the whole screen.
DomContentLoaded
This metric indicates how long after the page navigation the DOMContentLoaded is fired. This marks the point where the browser's HTML parser has reached the bottom of the document.
Load Event
How soon after the page navigation for the whole page to be loaded including stylesheets, scripts, iframes, and images.
Visually Complete
The Visually Complete milestone marks when the page has been fully rendered and no additional visual changes occur.
Time To Interactive
Time to Interactive measures when the network and CPU usage of the page becomes idol. Generally, all functionality on the page is ready to use.
Page weight and requests
Page weight measures how much data the browser has to download in order to display your page. It especially affects user experience when large amounts of data need to be loaded early on before the page starts to render.
Preloading additional code or resources after the page has rendered will increase page weight, but may not greatly hurt performance.
Page weight is usually dominated by images and JavaScript code.
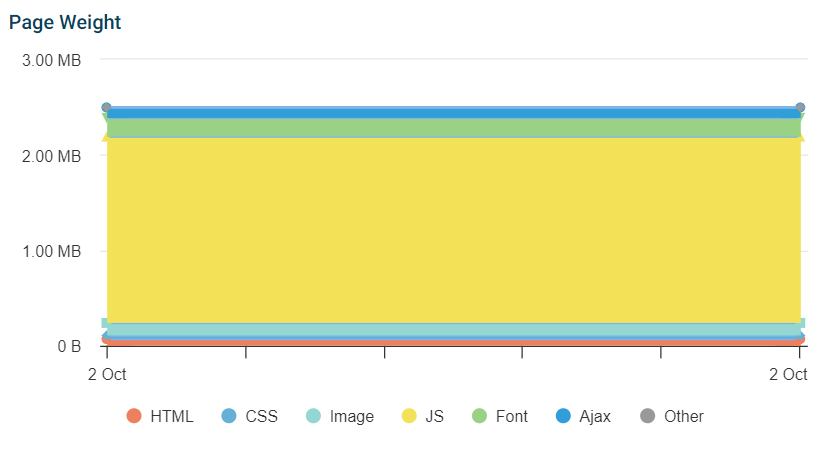
This screenshot shows a reduction in page weight after the site replaced PNG images with the more compact WebP format.
Another way to reduce image file size is to make sure they are loaded at an appropriate size. You don't want to load a 512x512 pixel image to display a 16x16 pixel icon.
Page weight is rated as follows on DebugBear.
| Rating | Max page size (Mobile) | Max page size (Desktop) |
|---|---|---|
| Green | 1.5MB | 2MB |
| Yellow | 3MB | 4MB |
| Red | >3MB | >4MB |
Responsiveness
These metrics try to measure how long it took for the browser to respond to user interaction (in a field environment), or how long it would take for the browser to respond (in a lab environment without user input).
First Input Delay
First Input Delay (FID) measures how soon after the user input the browser starts processing the event. It only considers the first user interaction on the page.
Interaction to Next Paint
Interaction to Next Paint (INP) measures how how quickly the UI updates after a user interaction/in response to user input.
Total Blocking Time
Total Blocking Time (TBT) is a lab metric that measures for how much time the main thread is "blocked", meaning there's an ongoing CPU task that takes more than 50 milliseconds. If the user were to interact with the page during those times the FID and INP scores could be high.
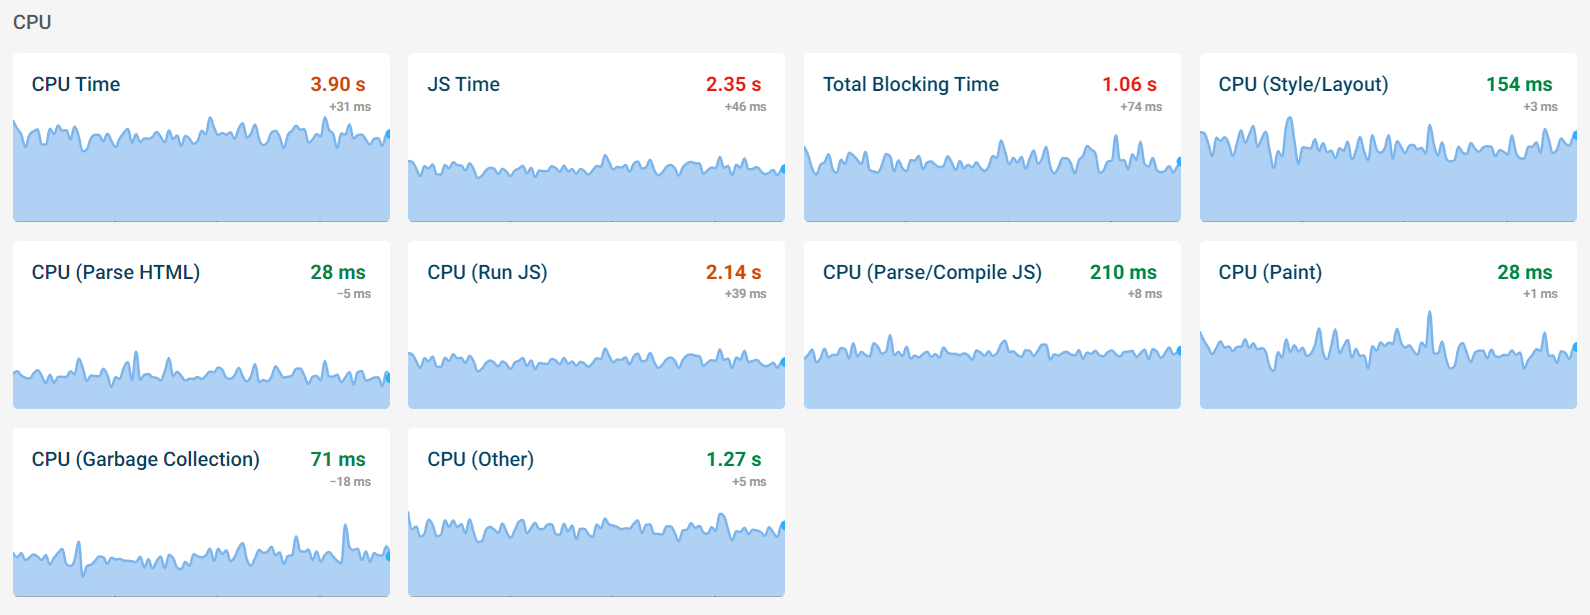
CPU activity
These timings describe how much processing time was used on the browser main thread. While the page main-thread is busy the user can't interact with the page.
For example, this timeline shows a large amount of data being rendered. Even though the data has finished loading 5s after navigation, the UI doesn't update until 7s later.
JavaScript (JS)
Many website today run large amounts of code. This applies especially to client-side applications. Third-parties, like chat widgets or ads, also often require significant amounts of processing.
JavaScript timings can be further categorized into:
- Parsing
- Compilation
- Execution
Style/Layout
This describes time spent calculating where to display page elements and how much space they take up.
HTML Parsing
HTML parsing involves taking the HTML text and turning it into the DOM that can be rendered.
Painting
This involves drawing the boxes, texts, and image so that they can be displayed.
Garbage Collection
Browsers automatically manage memory for you. When a JavaScript object or DOM node is no longer need it will be removed, freeing up memory. Identifying these objects and deleting them is called Garbage Collection.
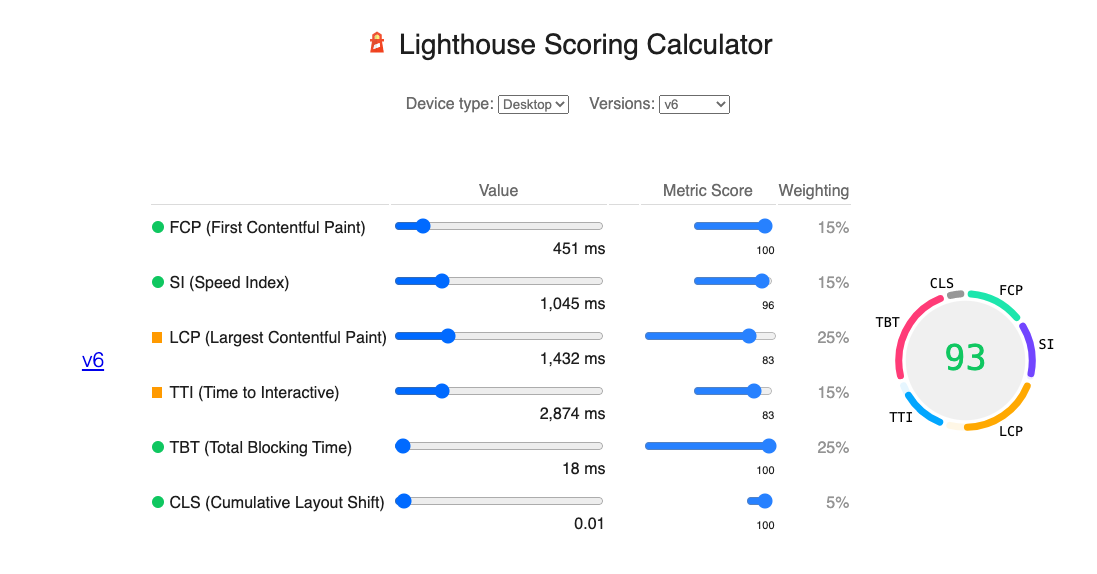
Lighthouse scores
Lighthouse scores range from 0 to 100, with scores above than 90 shown in green.
Performance
The Lighthouse Performance score combines multiple performance metrics into one:
You can use the Lighthouse Score Calculator to get a better understanding of how your Performance score is determined.
Accessibility
This category includes audits that detect common accessibility issues. This includes:
- not using image alt tags
- not having sufficient color contrast
- not providing labels for form elements
Not all accessibility problems can be detected automatically, so you also need to test your website manually.
Best Practices
This score encompasses various good practices, for example
- using HTTPS
- not requesting unnecessary permissions (like for notifications or geolocation)
- using the correct doctype to avoid quirks mode
- not having browser errors in the console
SEO
This category includes various audits for on-page Search Engine Optimization.
- invalid robots.txt
- no title element
- no meta description
- poor mobile UX (small font sizes or links/buttons)
- and more
Other metrics
Cumulative Layout Shift (CLS)
When DOM elements change position after being first rendered this increases the Cumulative Layout Shift.
For example, this filmstrip shows the main content rendered, but then an ad appears and pushes the content down.
The optimal Cumulative Layout Shift metric is 0, but anything below 0.1 is fine.
Core Web Vitals
Core Web Vitals is a term Google uses for three key performance-related user experience metrics:
- Largest Contentful Paint
- First Input Delay (Total Blocking Time in a lab environment)
- Cumulative Layout Shift
The Core Web Vitals can affect the search engine ranking of your website.
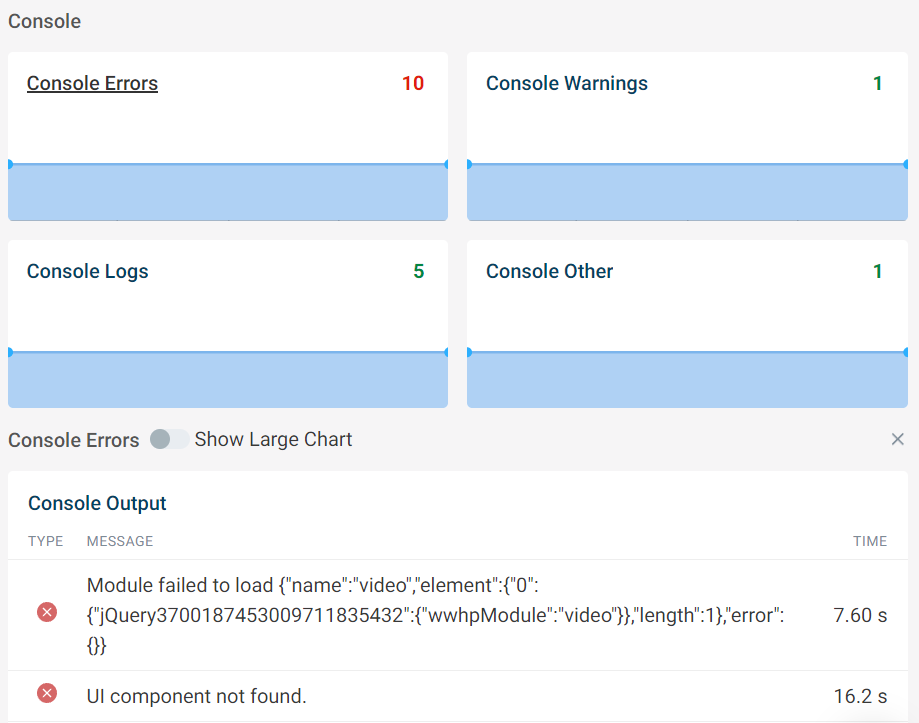
Console output
This tracks how many log entries are shown in the console when loading your page.
Errors indicate that some JavaScript code is broken, or that a file couldn't be loaded.
Warnings often indicate that a browser feature is deprecated.