

Page Speed Bottleneck Finder
Identify network requests that slow down content on your website.

Find the requests that hold up rendering
See how different resources impact pages speed
Identify what requests you need to optimize to make your website load faster.
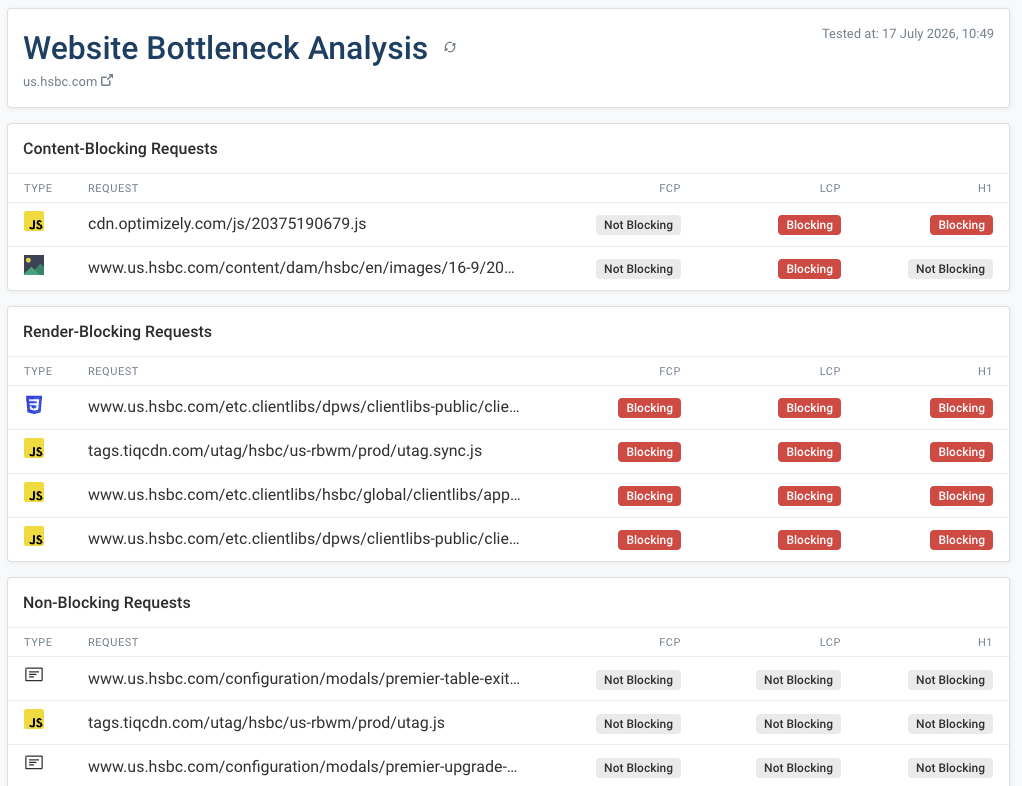
Check impact on FCP, LCP, and H1 timing
There's no single load time for a web page. We look at different page load milestones and show how each request impacts them.
Spot hidden bottlenecks beyond render-blocking CSS
Async scripts that fetch data before showing content, SPA data requests, and bundle chunks can all delay rendering even when they don't look render-blocking.
How does the website bottleneck finder work?
1. We measure a baseline
First we open your page and measure how long it takes for your content to render. We also collect a list of network resources that could potentially slow down your site.
2. We delay one request at a time
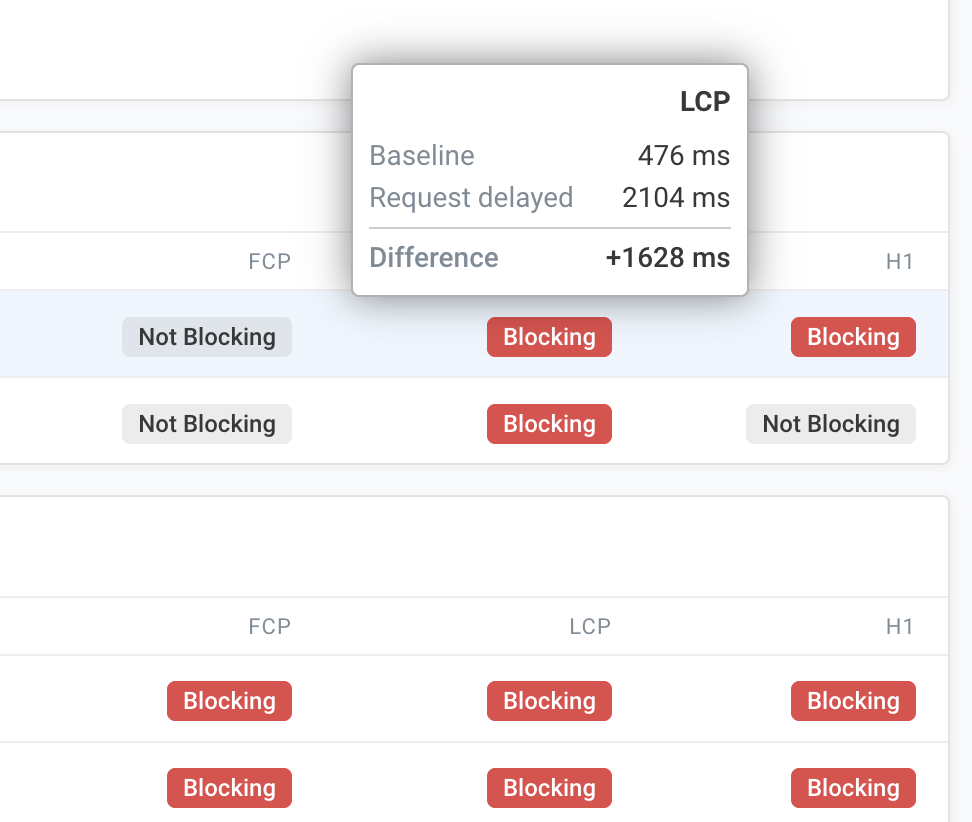
Then we load the page again and again, holding back one request at a time, and measuring how slower your page loads.
3. We rank requests by impact
If delaying a request pushes rendering back, that request is on the critical path. You can then focus optimizations here.
Run a full page speed analysis
Get performance recommendations
While our bottleneck finder identifies what requests slow down your website, our full page speed test analyzes your website more holistically and provides actionable tips on how to improve it.
See real user data from Google
Test results also include Chrome User Experience Report data, so you can tell whether your visitors are running into the same problems your lab test found.
➔ Run A Free Website Speed Test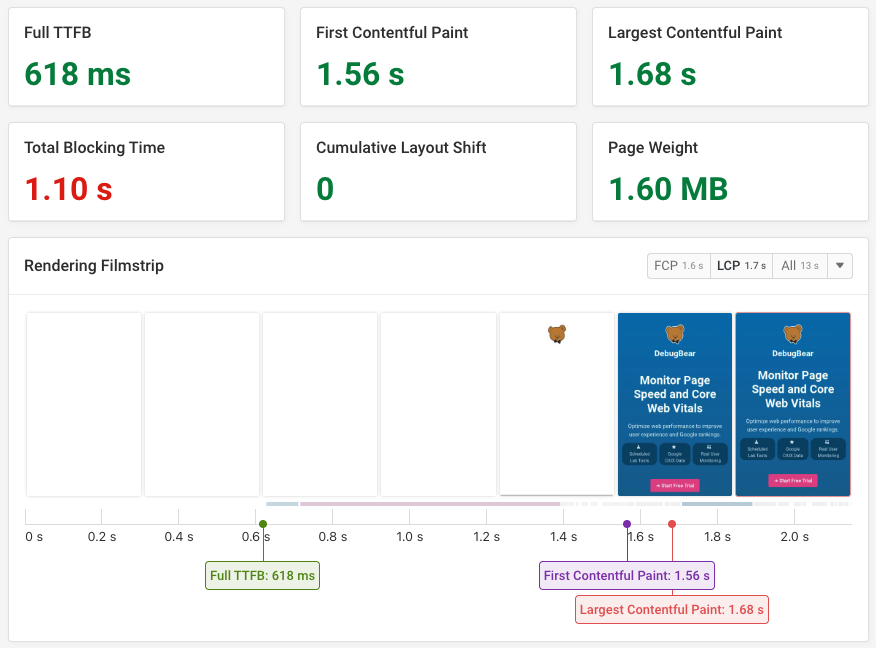
Monitor web performance continuously
A one-off test only tells you about today
Optimizing a bottleneck is only worth it if it stays fixed. DebugBear runs scheduled tests and alerts you in Slack, Microsoft Teams, or by email when your metrics regress.
Find out what changed
Compare test results from before and after a regression to see exactly which requests, scripts, or page elements are responsible.
Lab data and real user data together
Combine synthetic tests from 30 global locations with real user monitoring to see how your site performs for actual visitors.
➔ Monitor My Website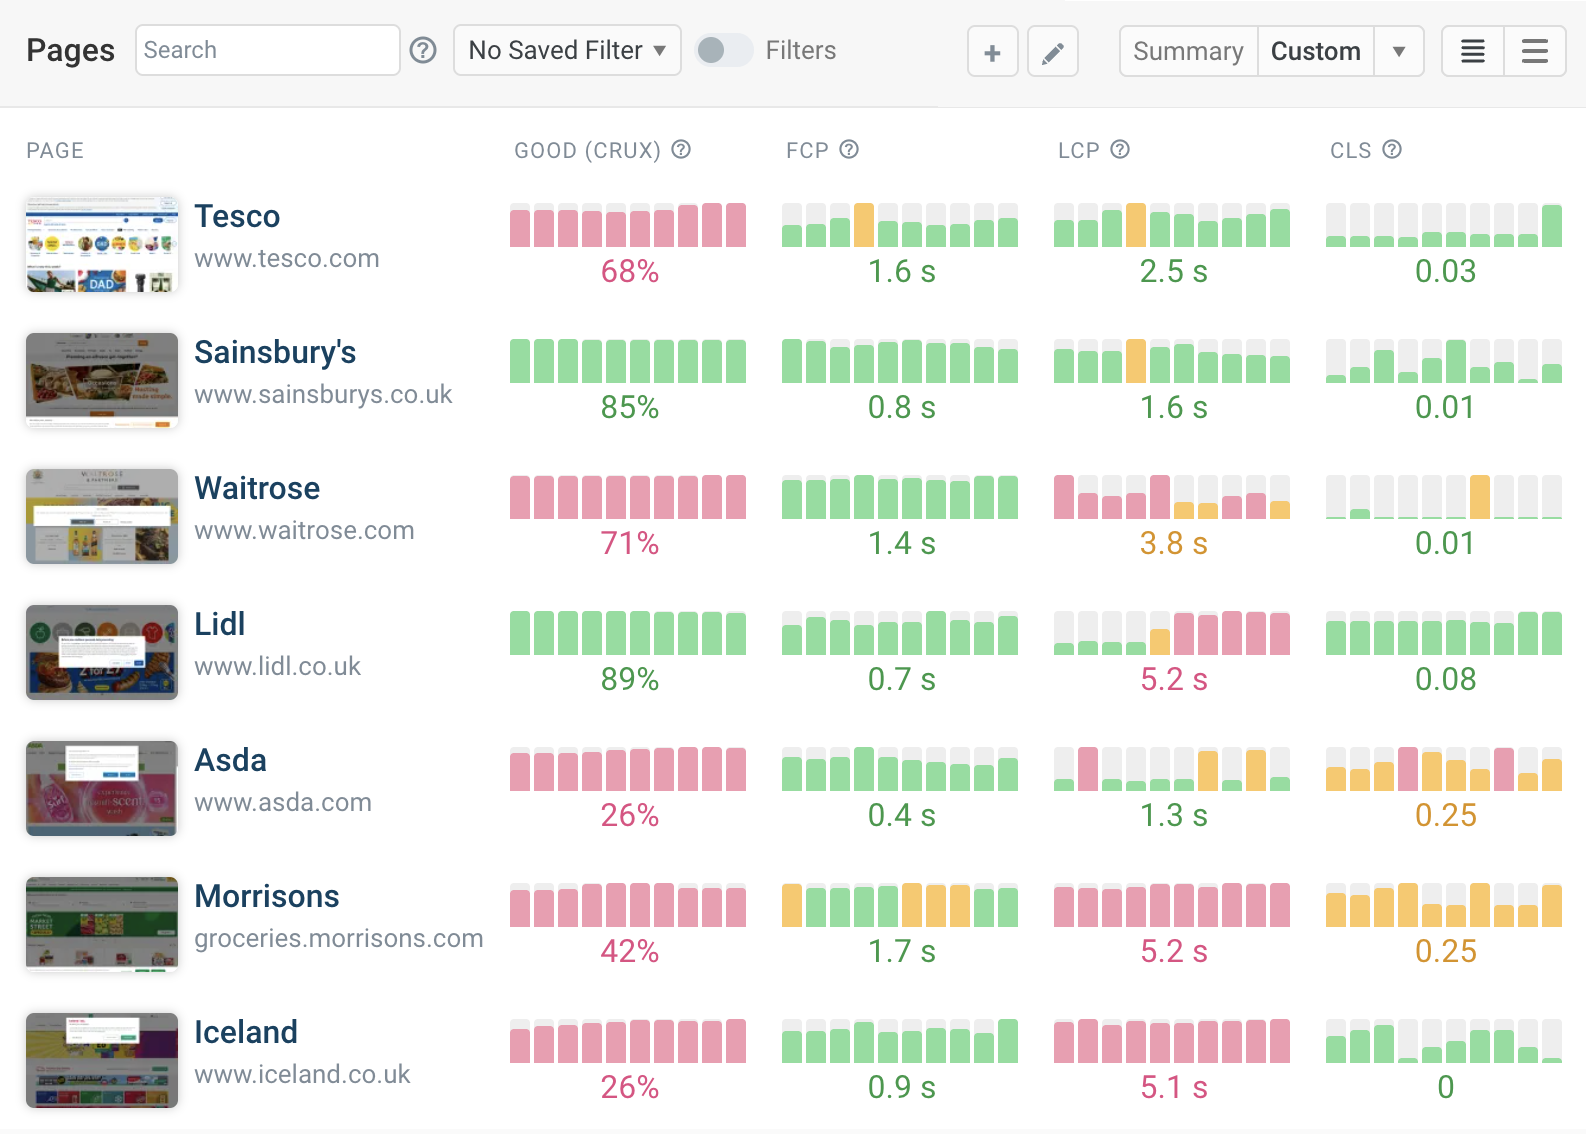
You are using an old browser that is not supported anymore. You can continue using the site, but some things might not work as expected.