Synthetic Website Monitoring

Run page speed tests in a controlled lab environment.

Get in-depth reports, run page speed experiments, and get targeted recommendations.
No card required. Get set up in minutes.
Synthetic website monitoring software
”We've updated around 15,000 pages and saw some nice gains from it. "Good URLs" and their impressions have increased 3x since implementation.“
Web performance monitoring user profile picture
Rafayel Begoyan
Senior SEO Specialist at CoinStats
”We love DebugBear. It has proven useful time and time again. I evaluated the different competitors and DebugBear was the best overall product.“
Web peformance monitoring user profile picture
Rafael Corral
Senior Software Engineer
Join Hundreds Of Happy Customers
DebugBear Customers

Synthetic monitoring tool

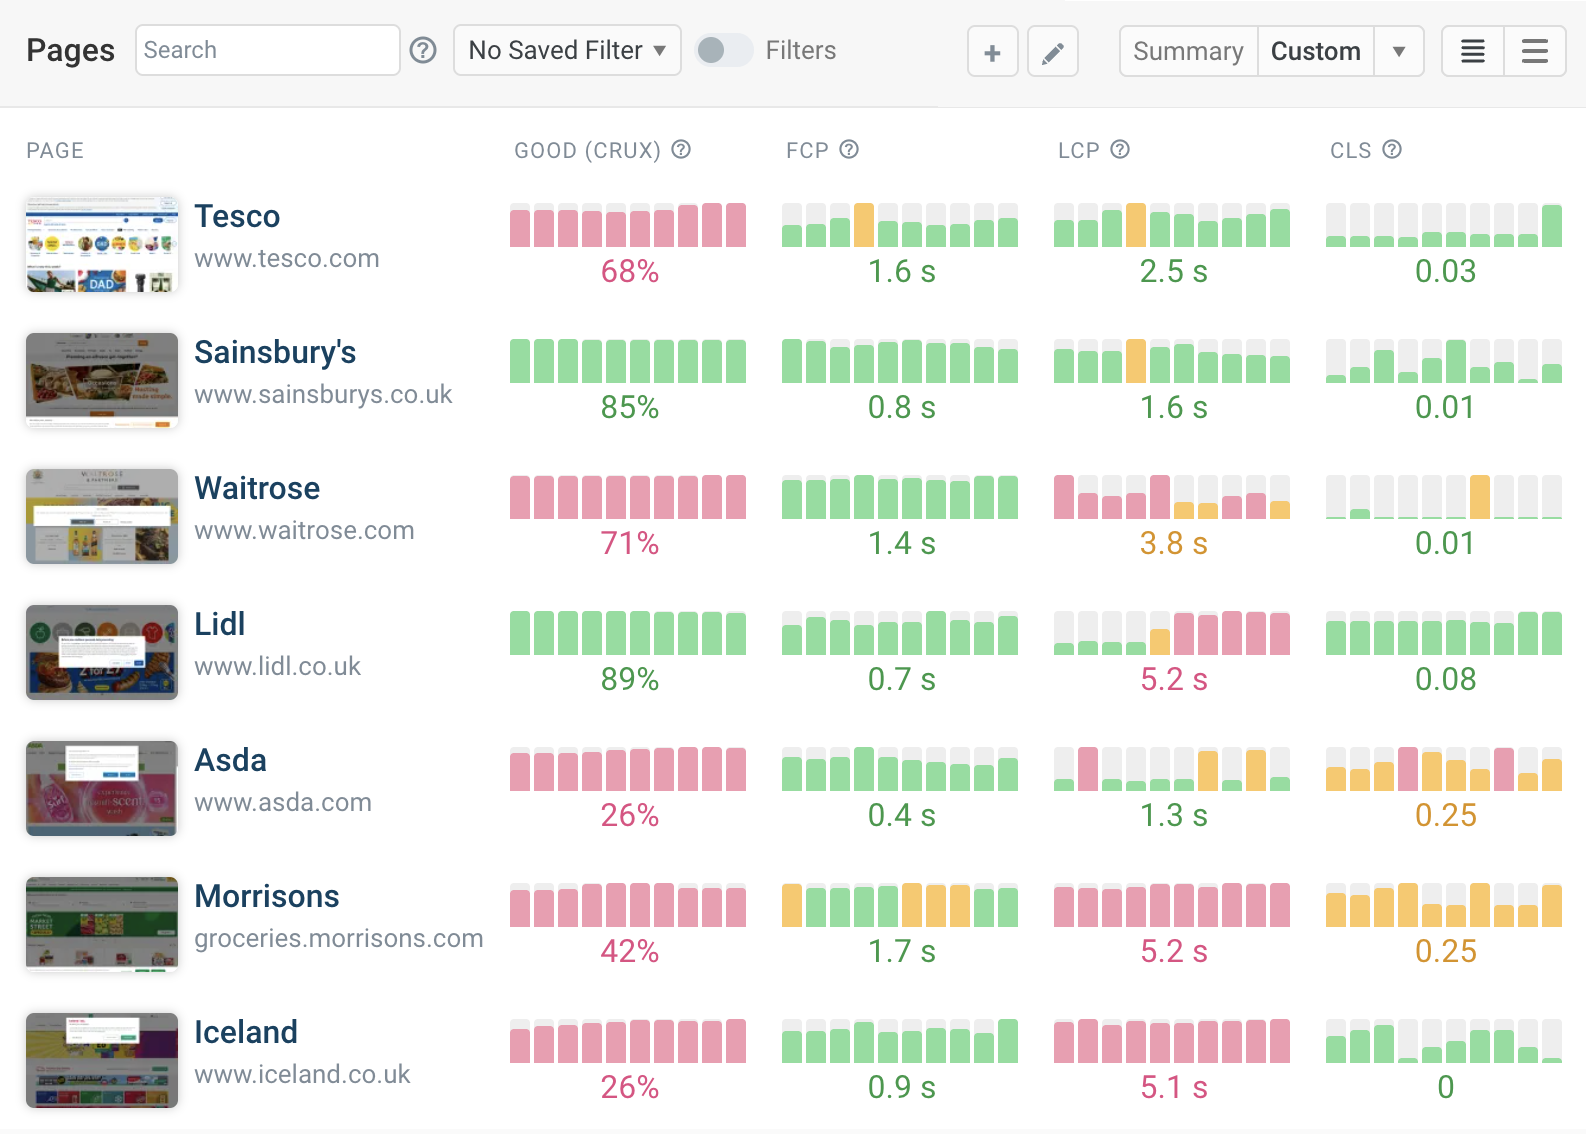
Track site speed in the browser

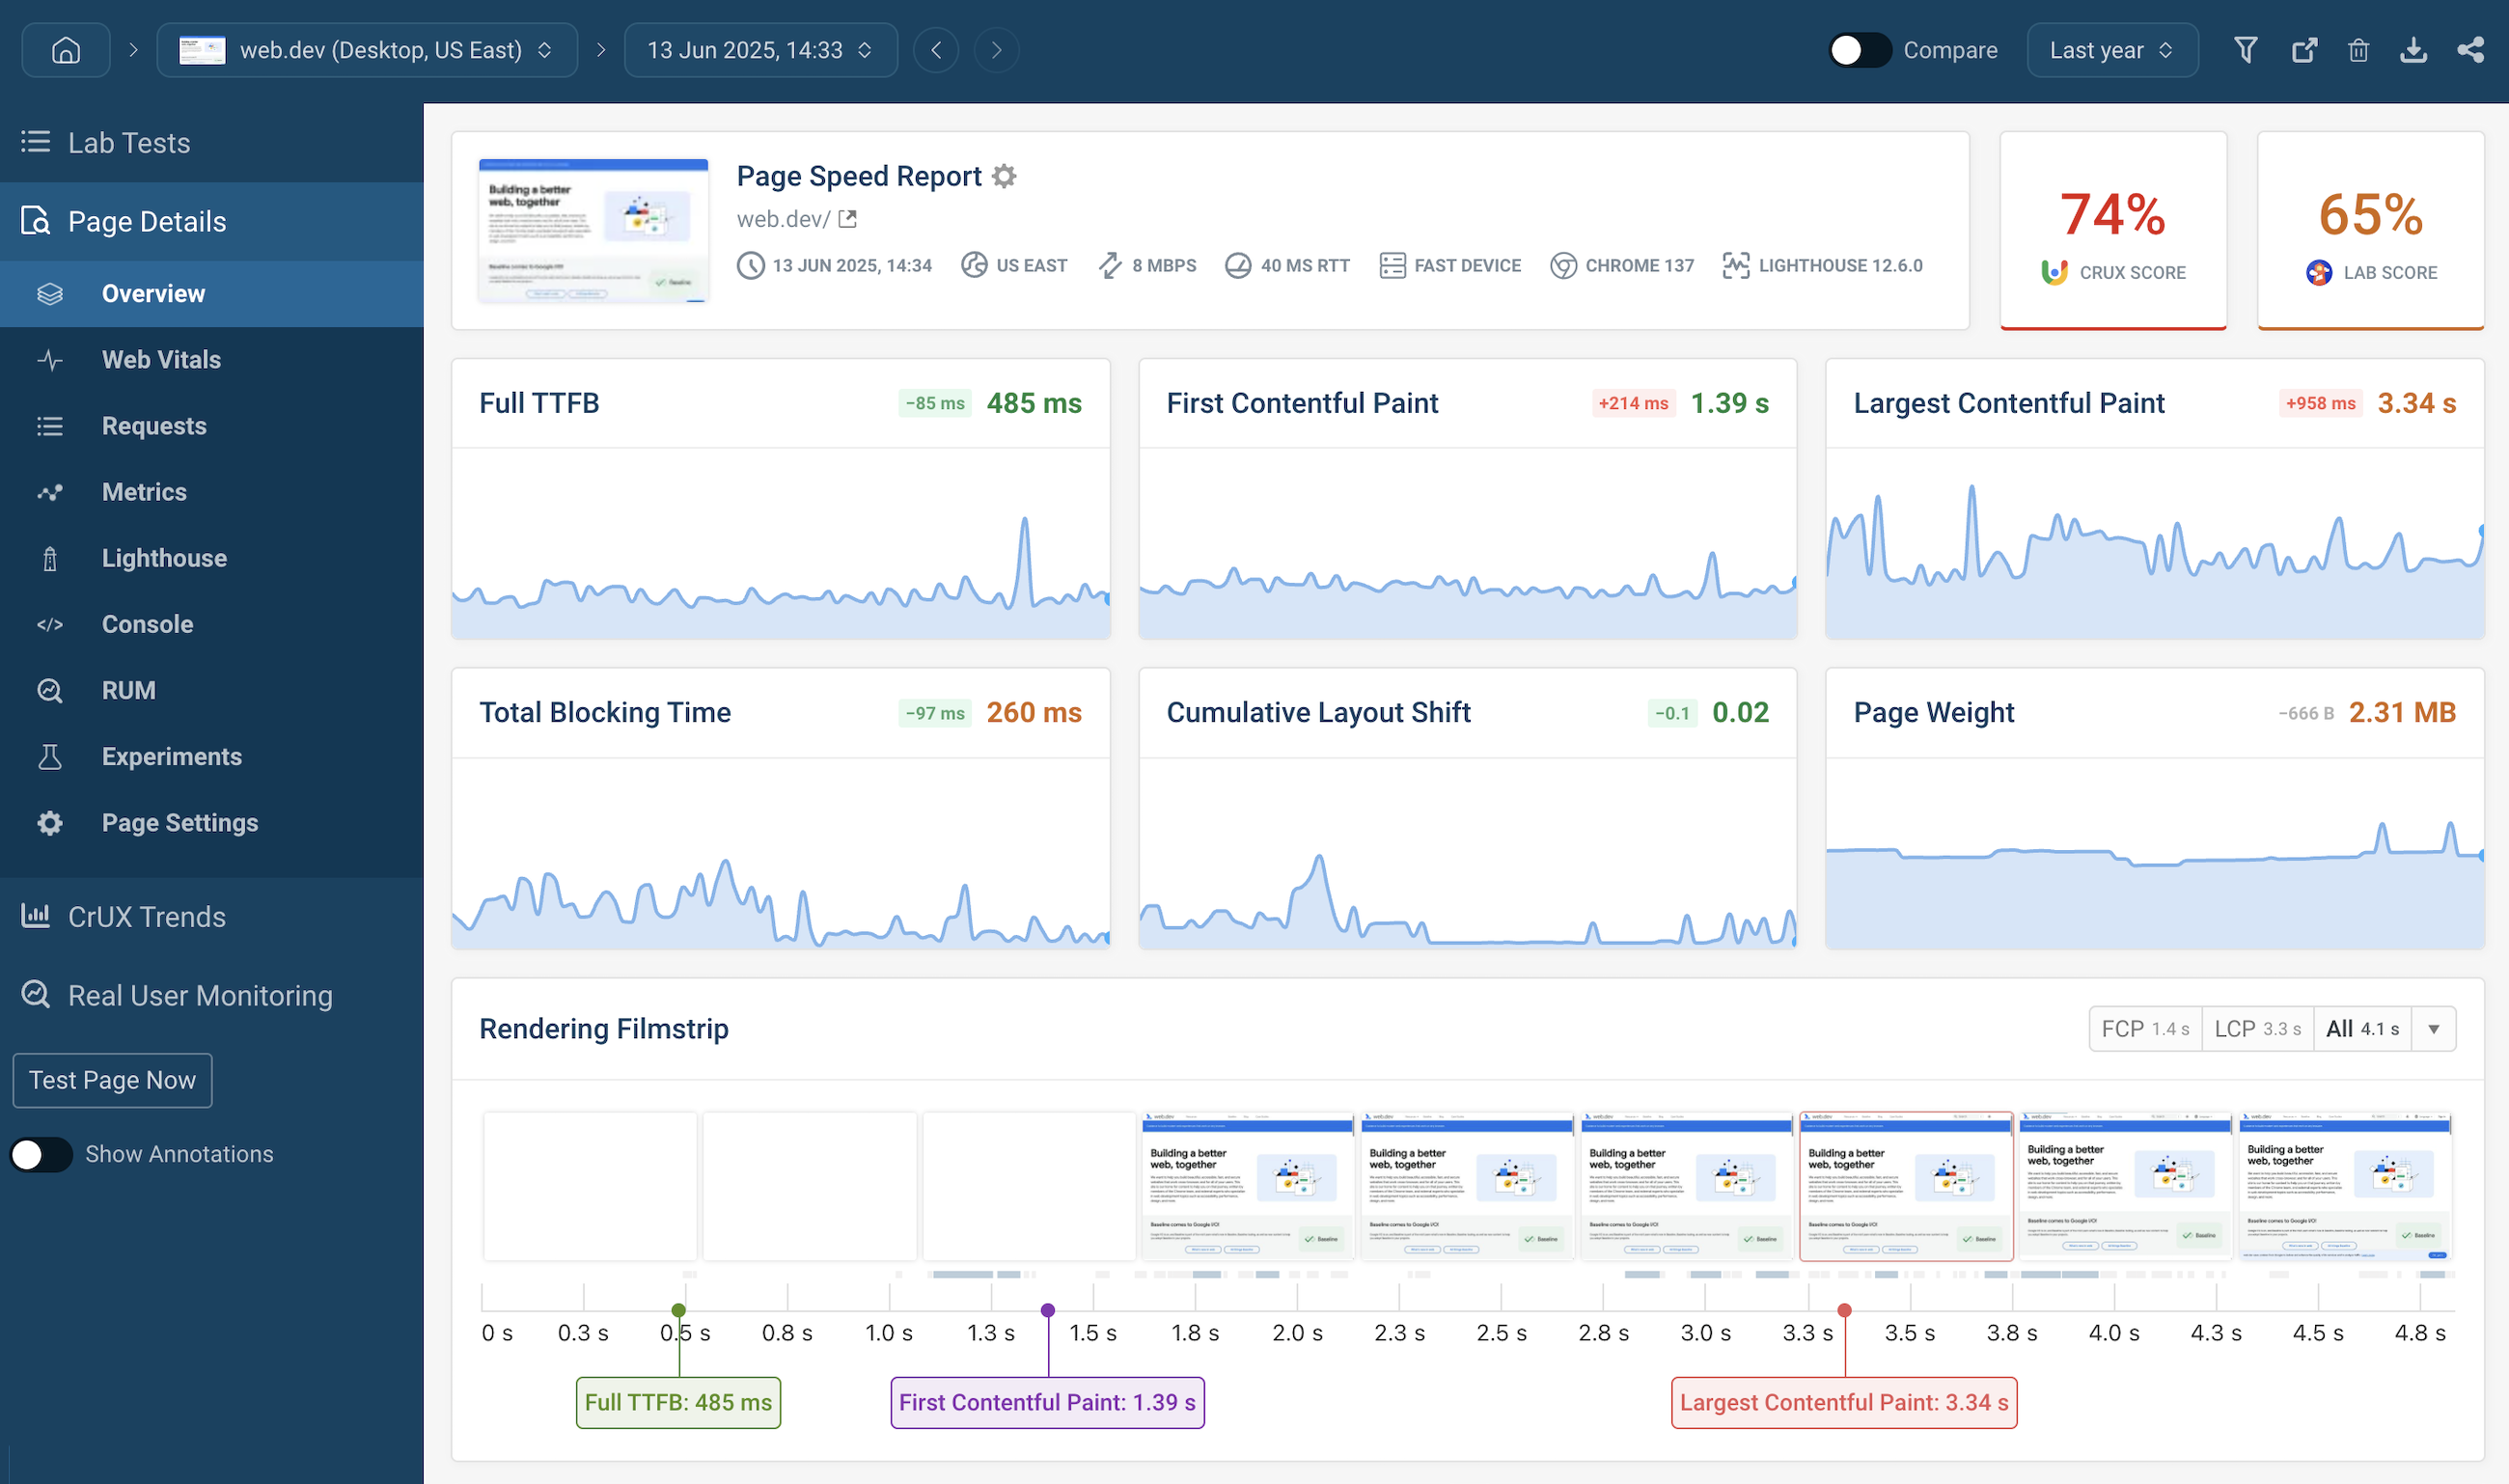
DebugBear continuously runs front-end performance tests by loading your whole page in the browser and generating in-depth reports.

User-centric metrics

Track modern metrics like Google's Core Web Vitals to see how quickly your page is ready for your visitors.

Configure test locations and devices

Monitor your website from over 20 global locations, and configure custom network speeds for mobile and desktop devices.

Synthetic monitoring software dashboard

Detailed reporting and analysis

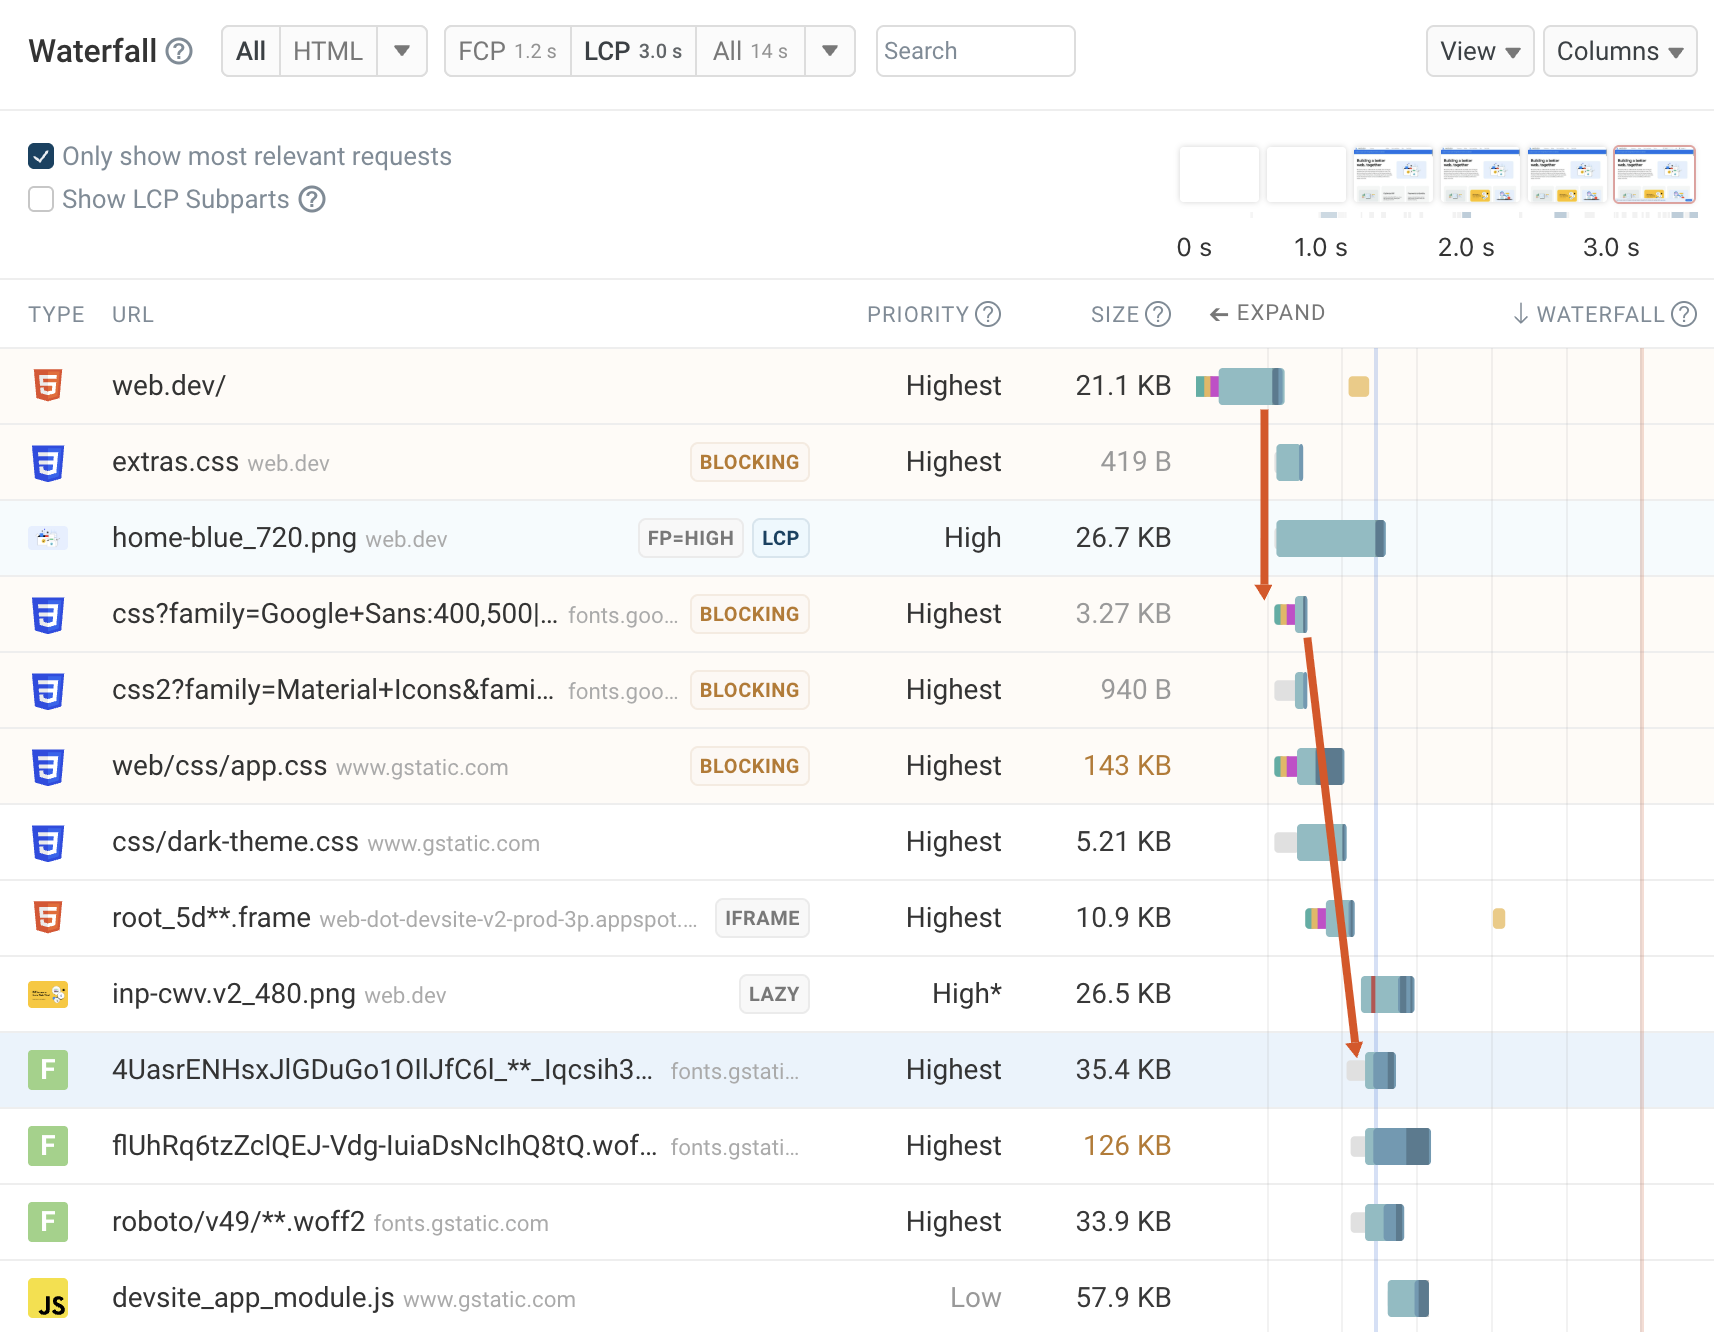
Detailed request waterfall

See exactly what happened when the page was loading, and identify what was holding back rendering.

Built-in Lighthouse reports

Each test results include an analysis by Google's Lighthouse tool, including score for Performance, SEO, and Accessibility.

Custom recommendations

DebugBear reports go far beyond a basic Lighthouse analysis. Get tailored recommendations on how to speed up your website.

Request waterfall and page size changes

Run page speed experiments

Try optimizations without deploying code

Try out page speed recommendations for your website and measure their impact using the DebugBear Experiments feature.

Tailored page speed optimizations

DebugBear analyzes your website, provides recommendations, and lets you try out possible improvements.

Page speed experiment result

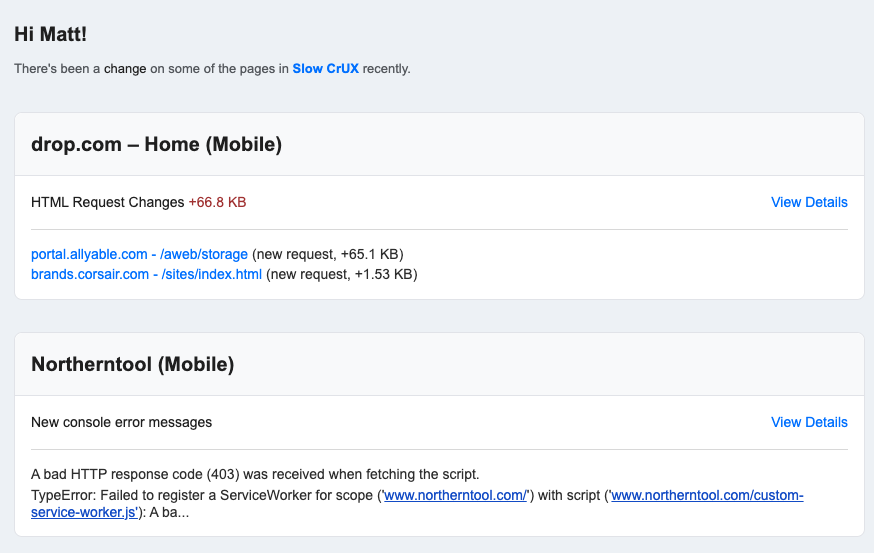
Get alerted when your site speed changes
Zero-config, but configurable

Significant changes are detected automatically, without the need to set up thresholds. But if you need to you can fully customize the alerts.

Alerts in Slack, Teams, or by email

Get notified where your team is and catch problems before they reach production.

Web performance email alert

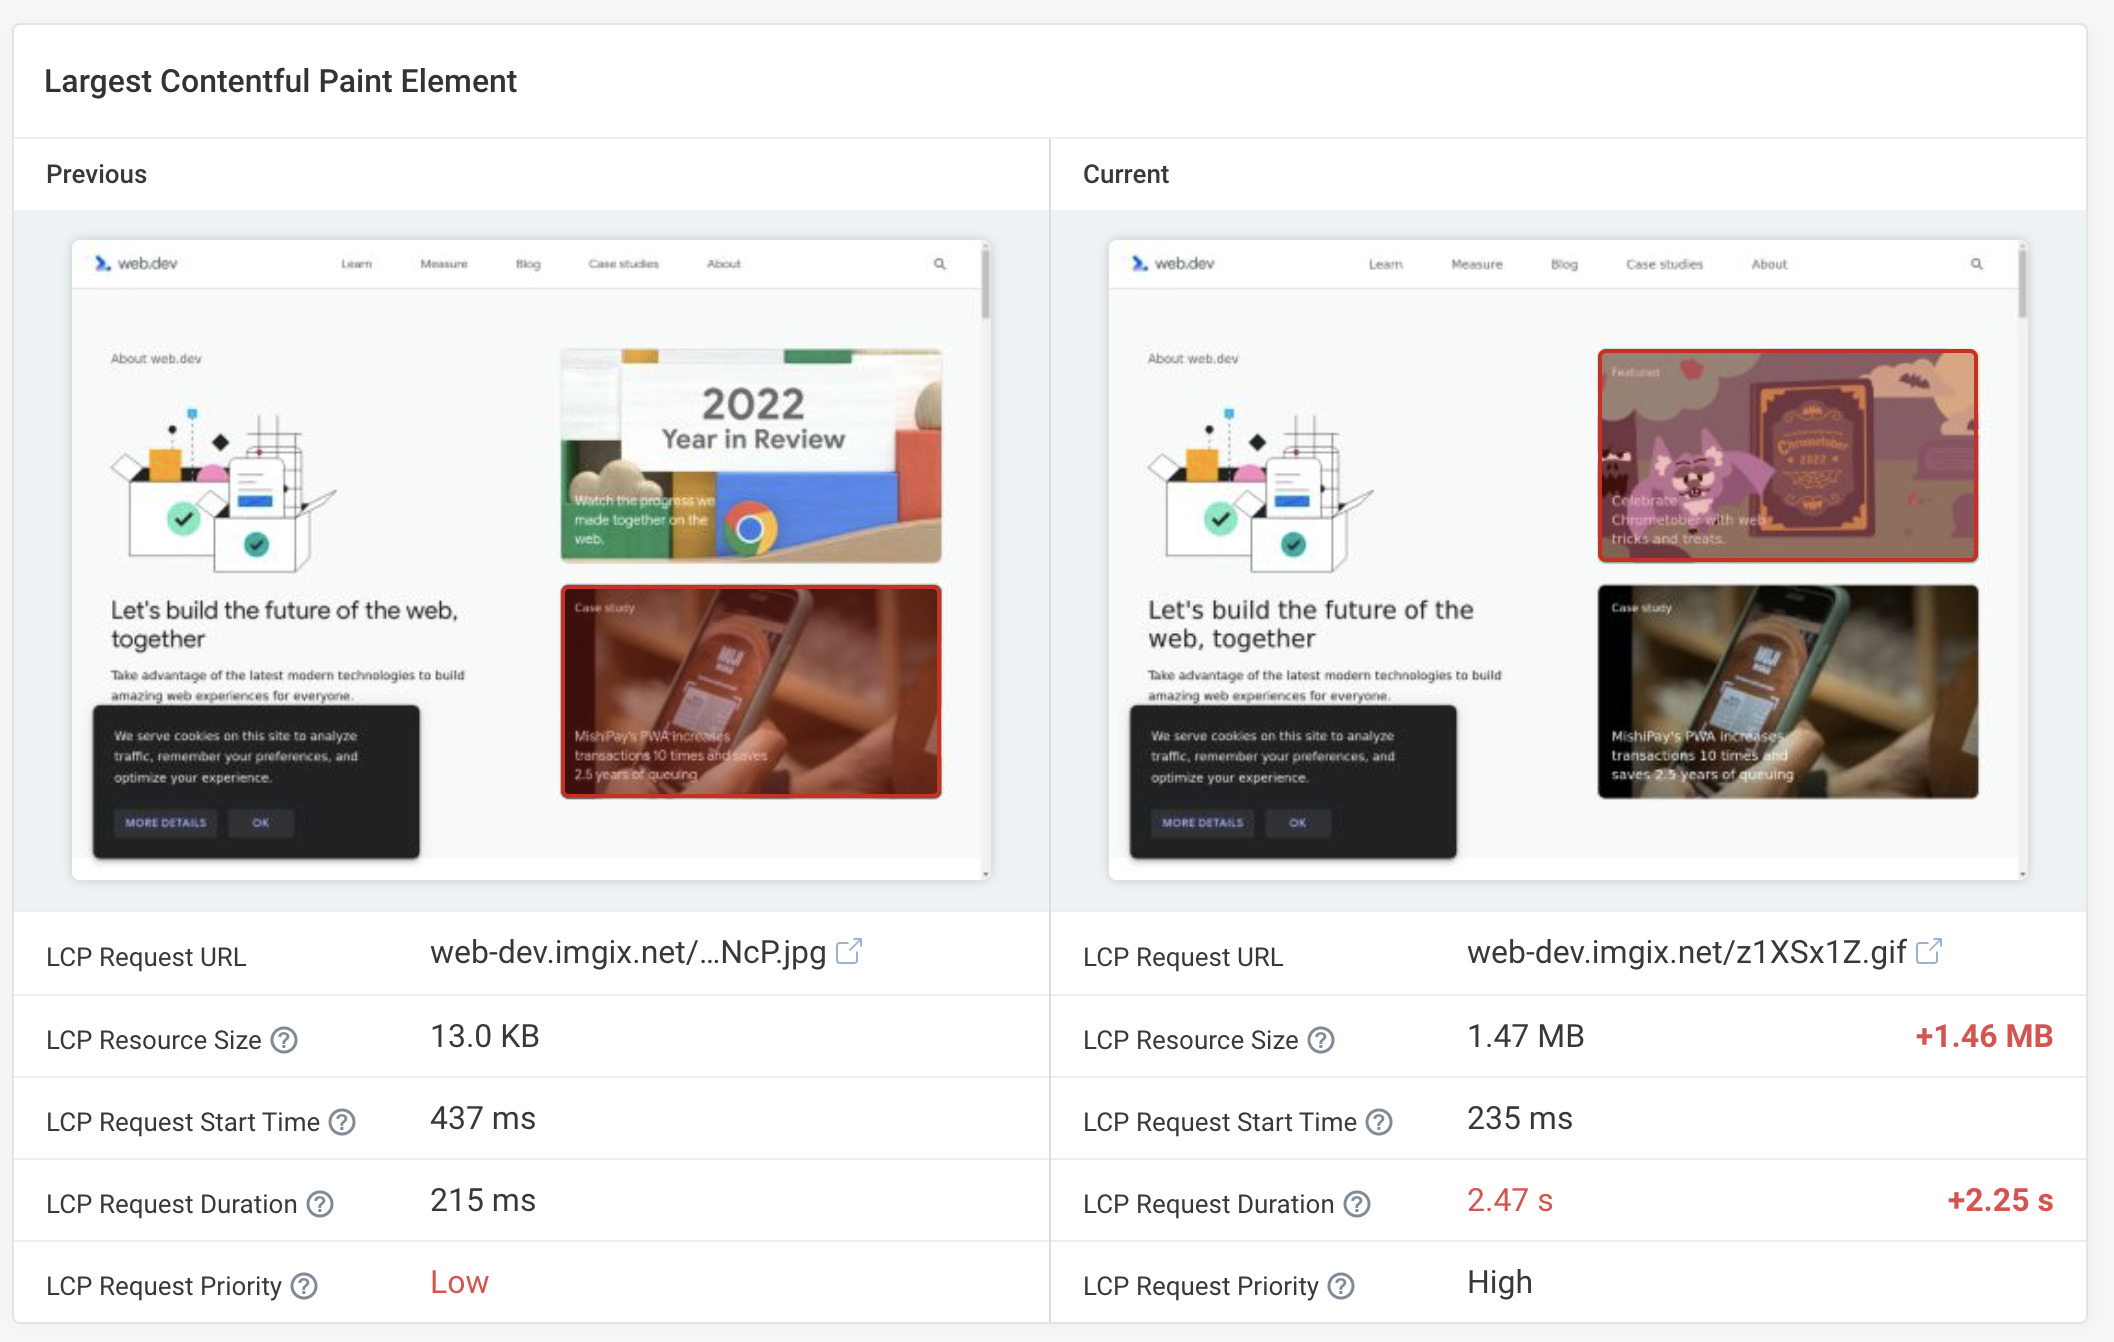
Easy regression analysis

See exactly what changed

Compare page speed test results side by side, whether you're looking at a rendering video, Lighthouse audit, or network request list.

Share results with your team

Export before and after videos to highlight regressions or show off the impact of optimizations in your company.

Side by side page speed view to debug regressions
”DebugBear delivers the best stats for before and after changes in exquisite detail. It also shows clear and easy to find data for Google's Web Vitals.
Web peformance monitoring user profile picture
Tony Cosentino
Owner at The WP Guy
”The reporting data is very helpful in pinpointing what causes site speed issues – immediately actionable. It's well above and beyond the info you get from Lighthouse and the performance tests through Chrome.“
Web peformance monitoring user profile picture
Loren McDonald
IT Director
The most actionable-info packed page speed visualization available. DebugBear provides unique features that are crucial to debugging complex issues, like request-chain visualization."
Web performance testimonial photo
Robin Marx
Web Protocol and Performance Expert

Get set up in minutes.

No credit card required.
Start free 14-day trial

You are using an old browser that is not supported anymore. You can continue using the site, but some things might not work as expected.