
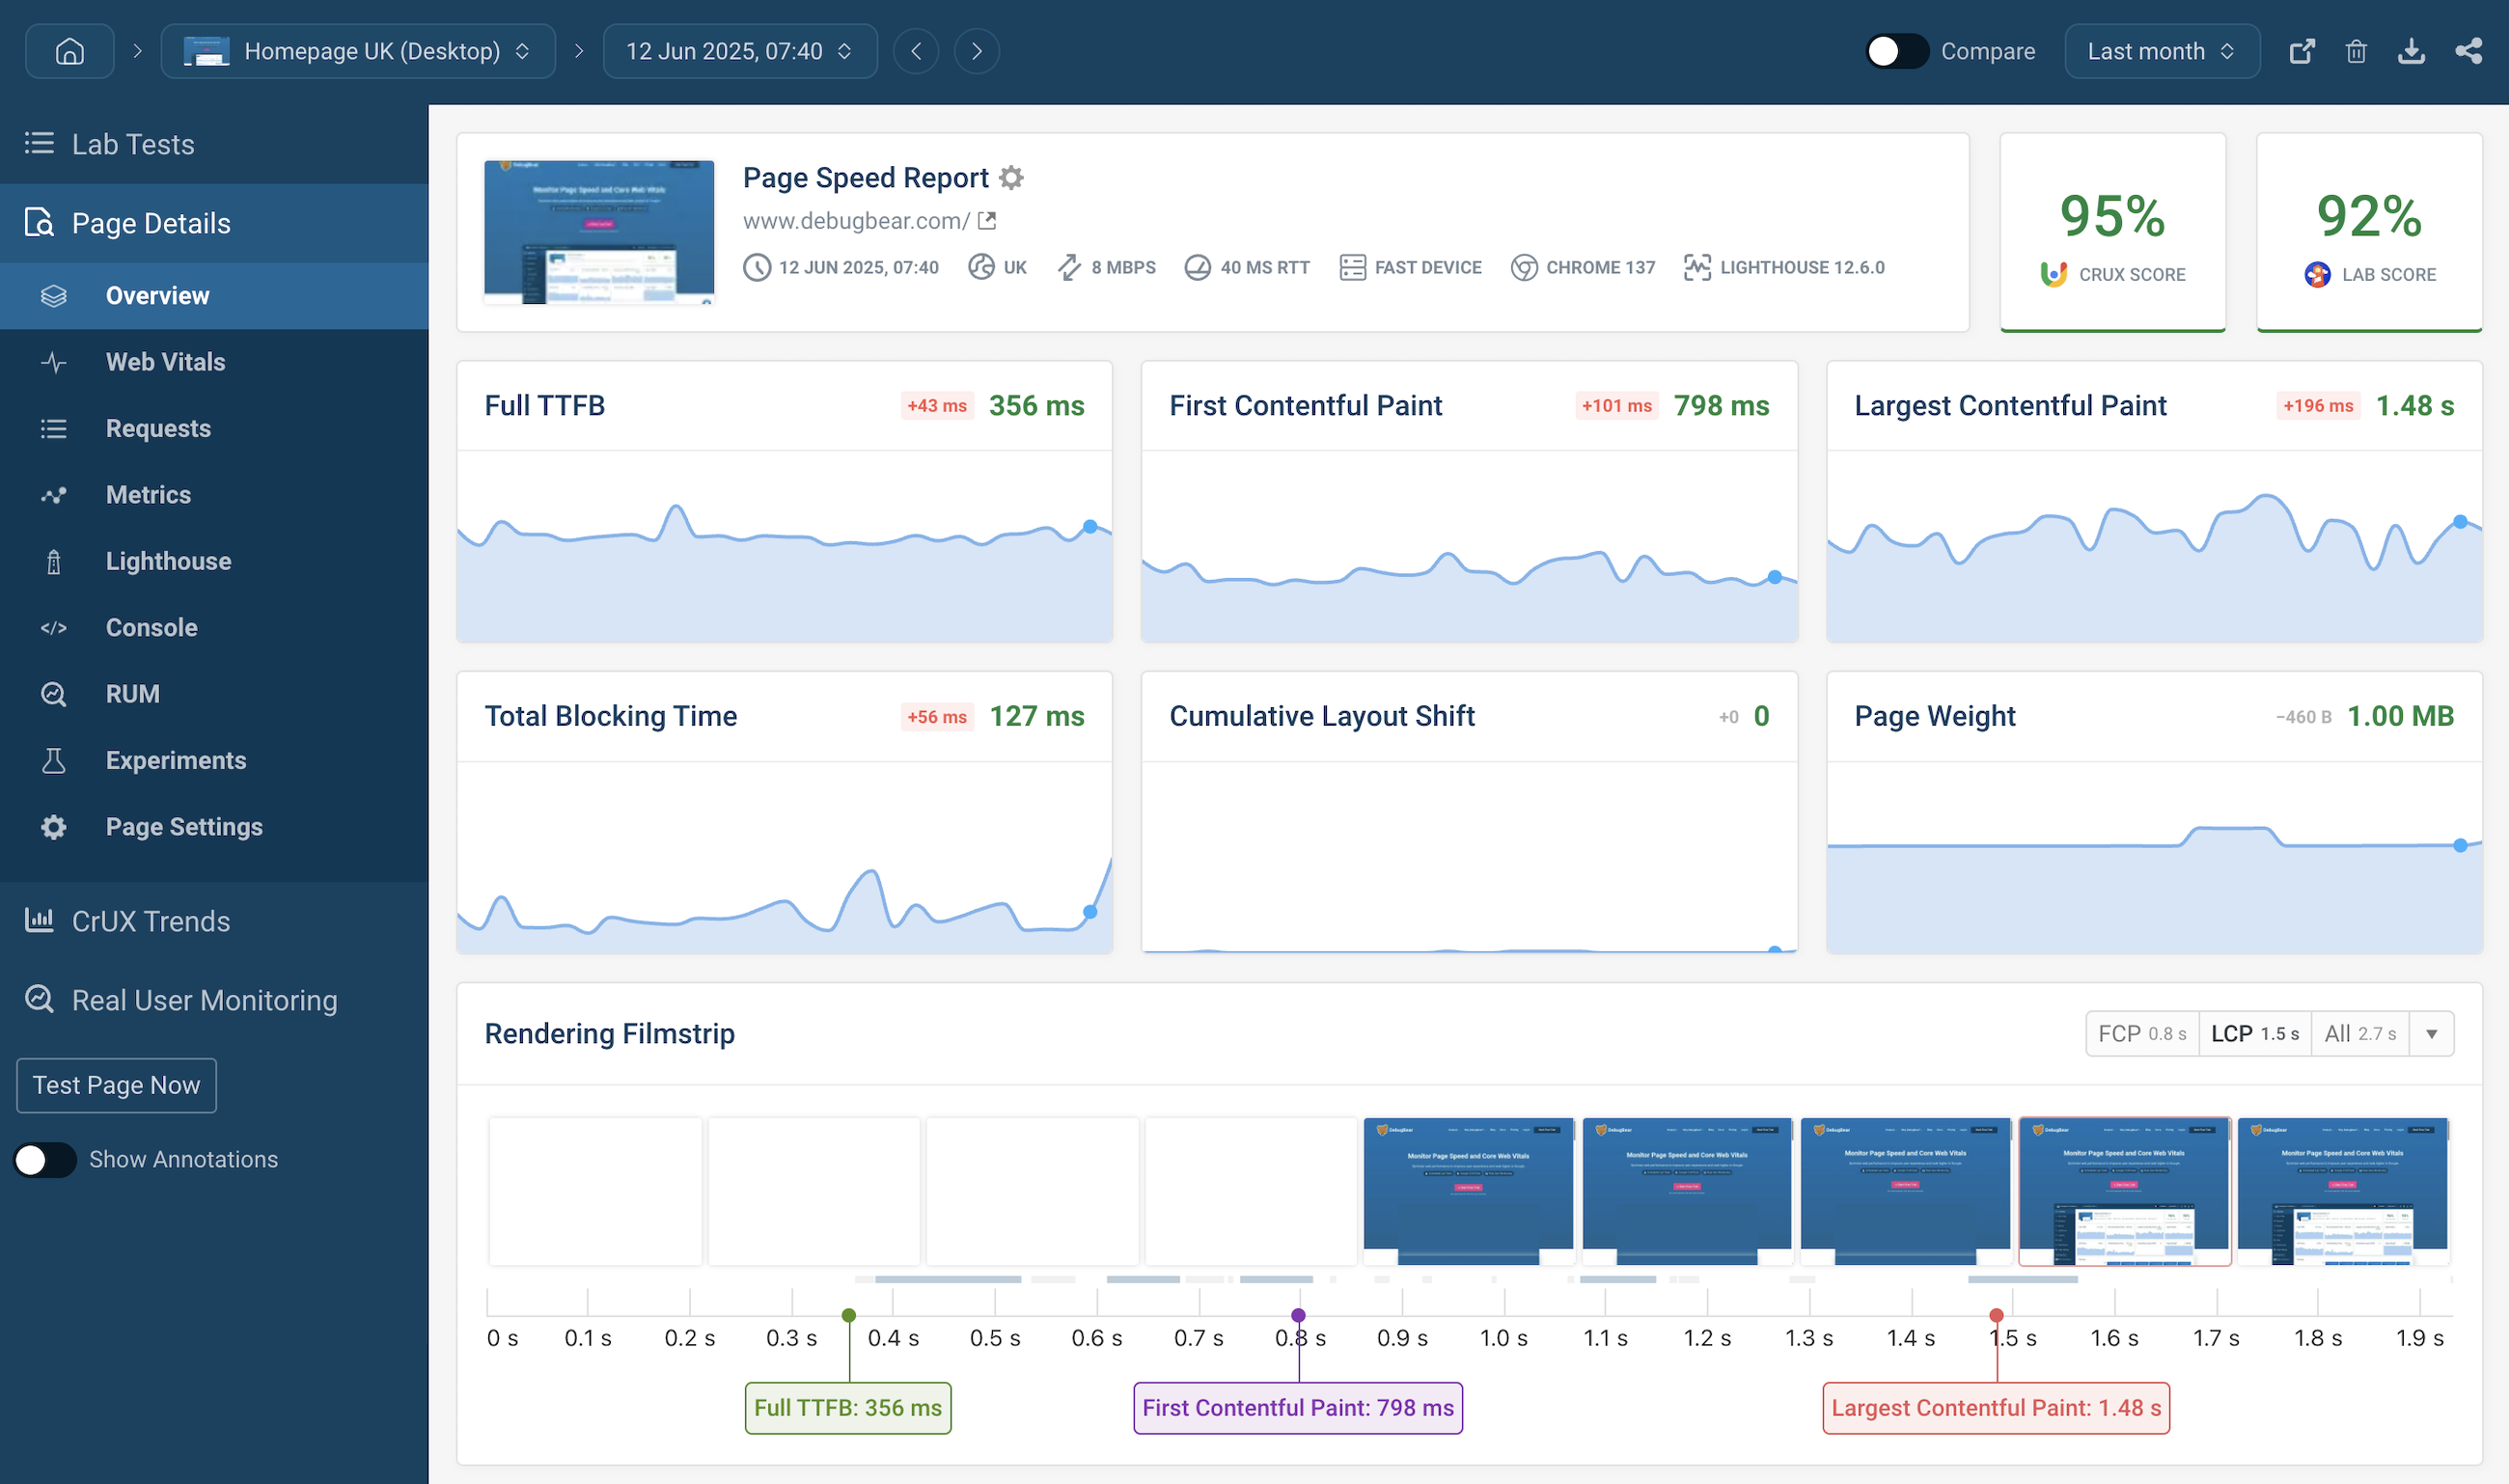
Monitor Page Speed and Core Web Vitals
Optimize web performance to improve user experience and Google rankings.


Be faster than your competition
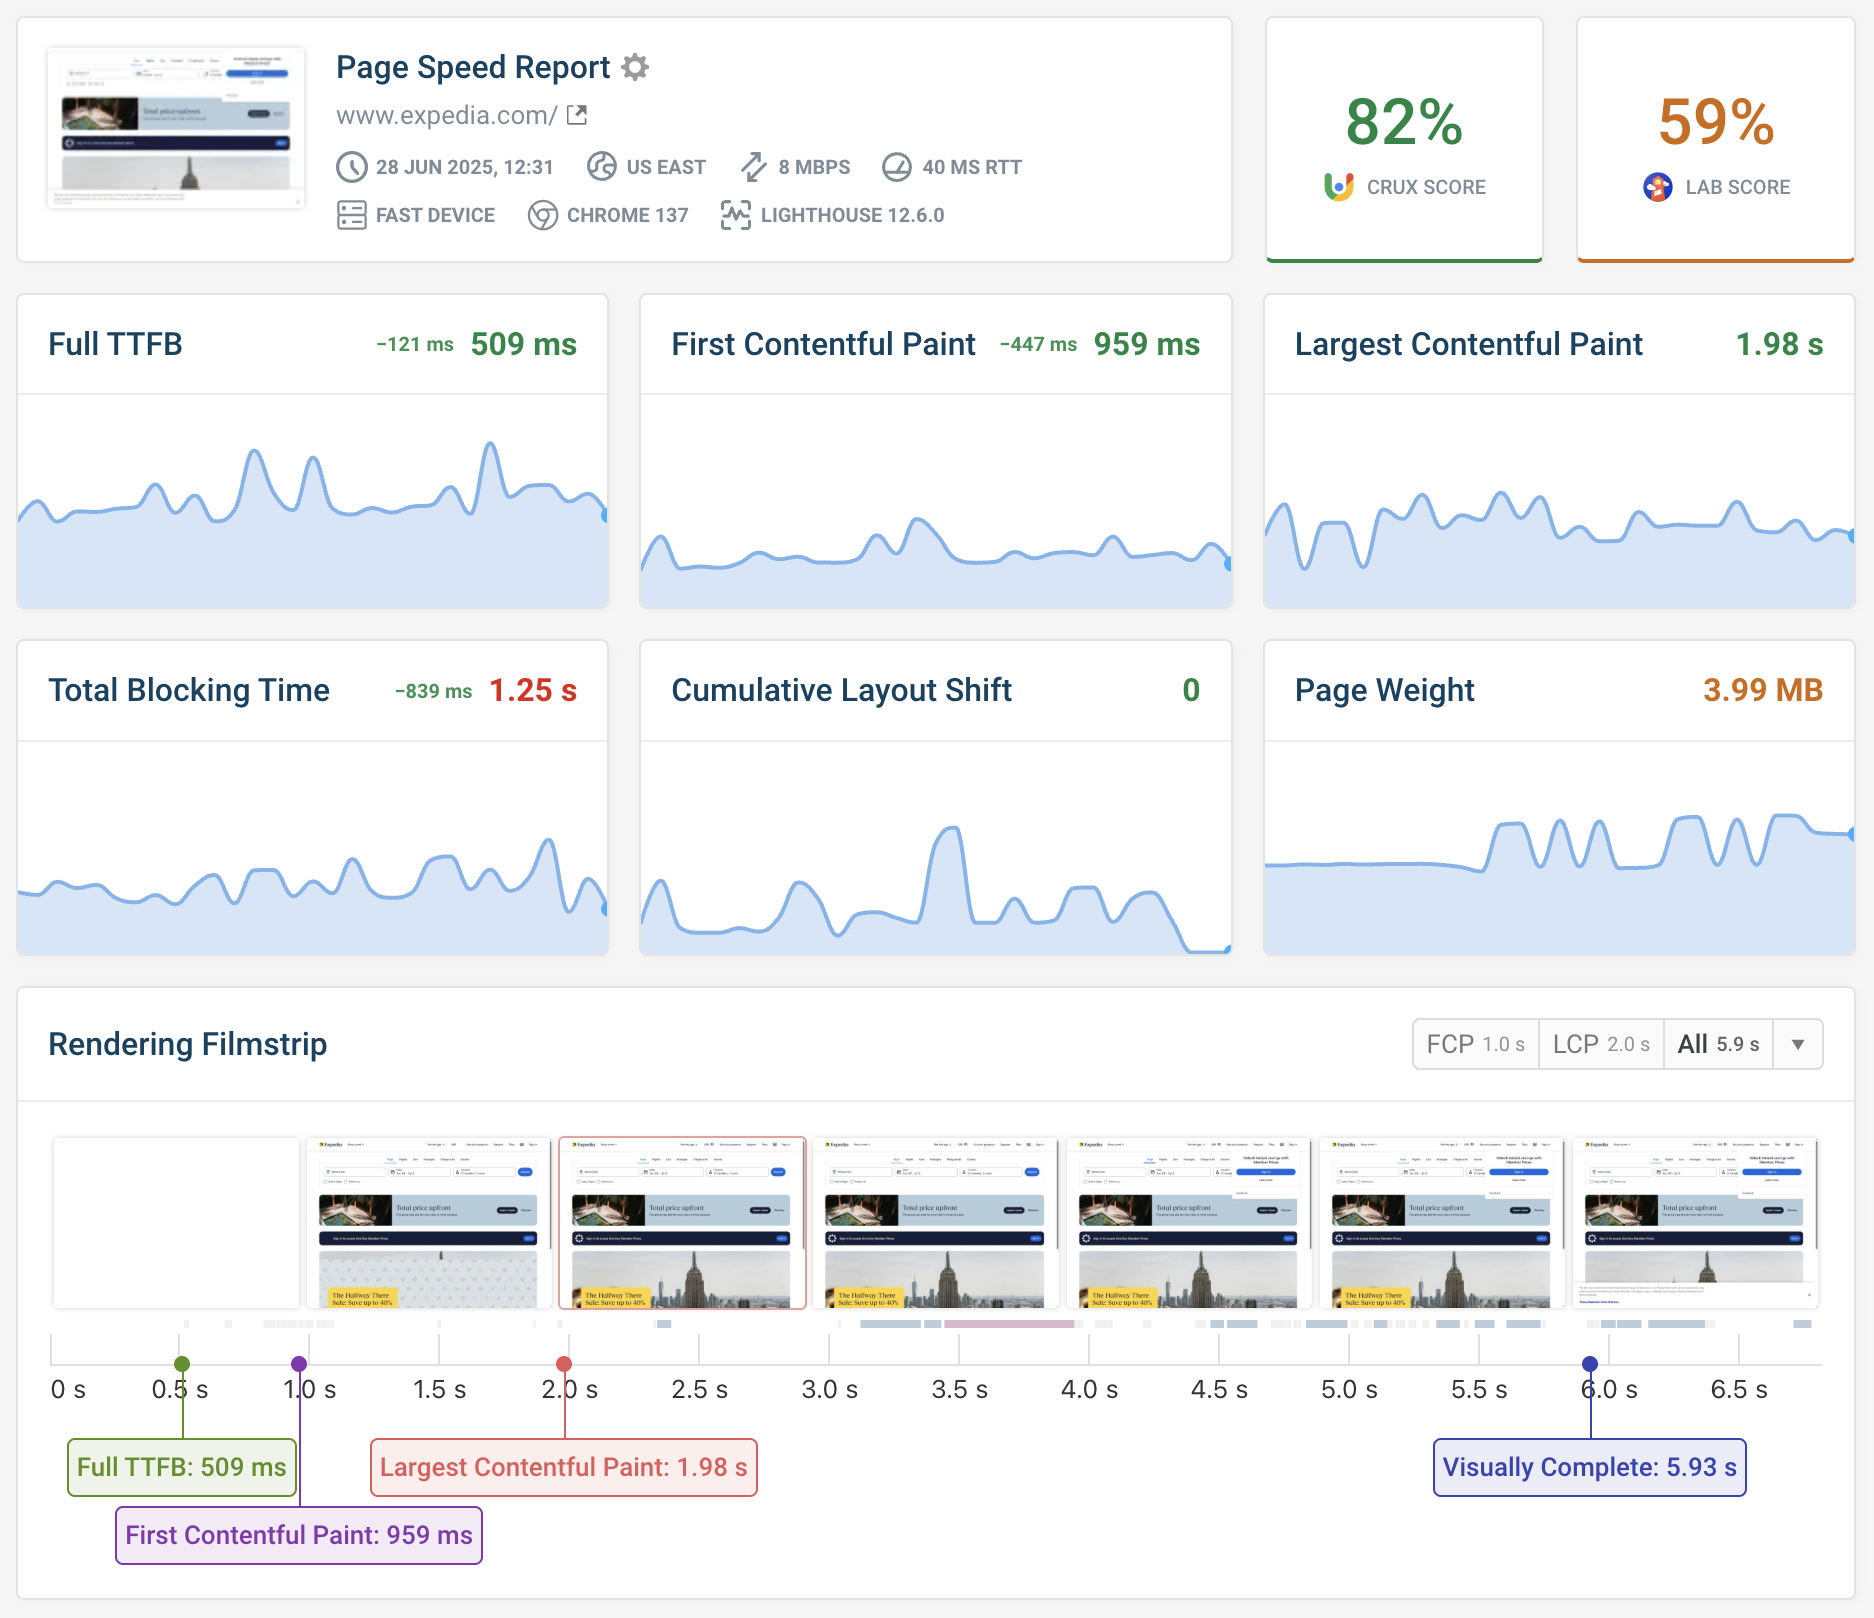
Comprehensive website performance monitoring
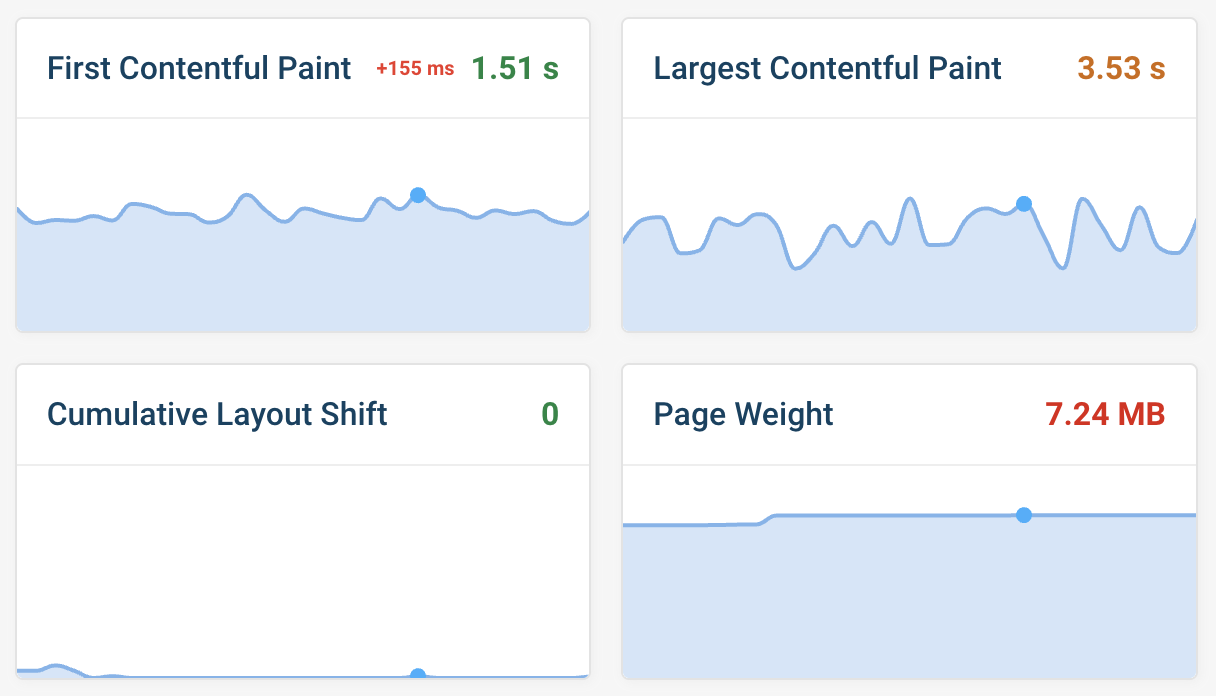
Identify web performance issues
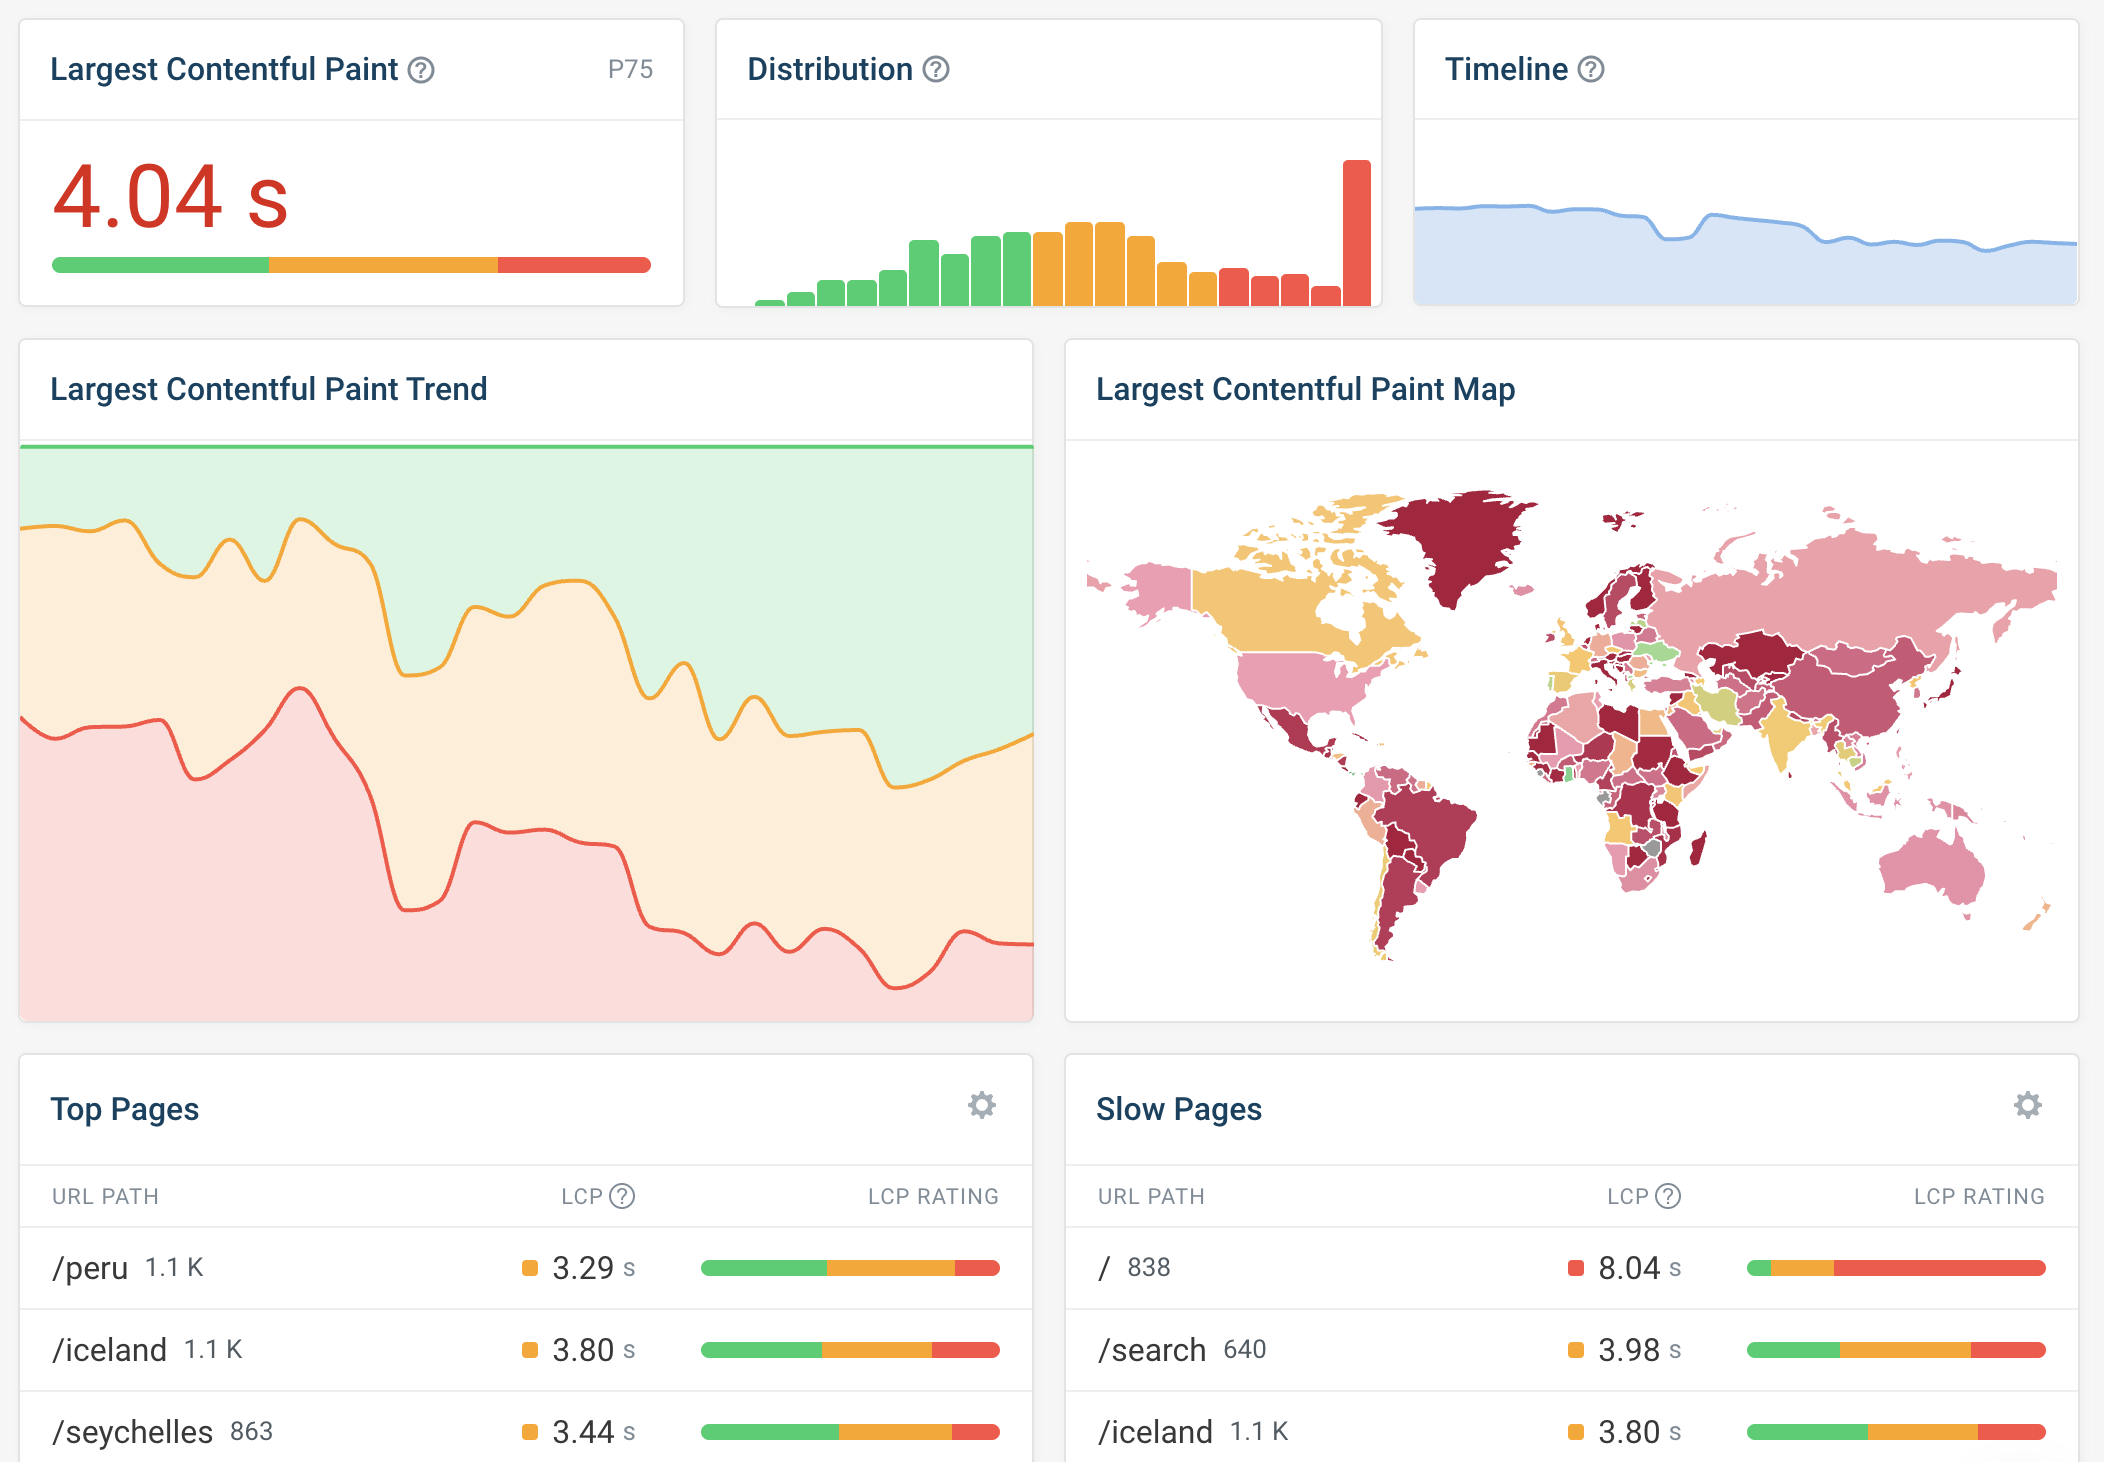
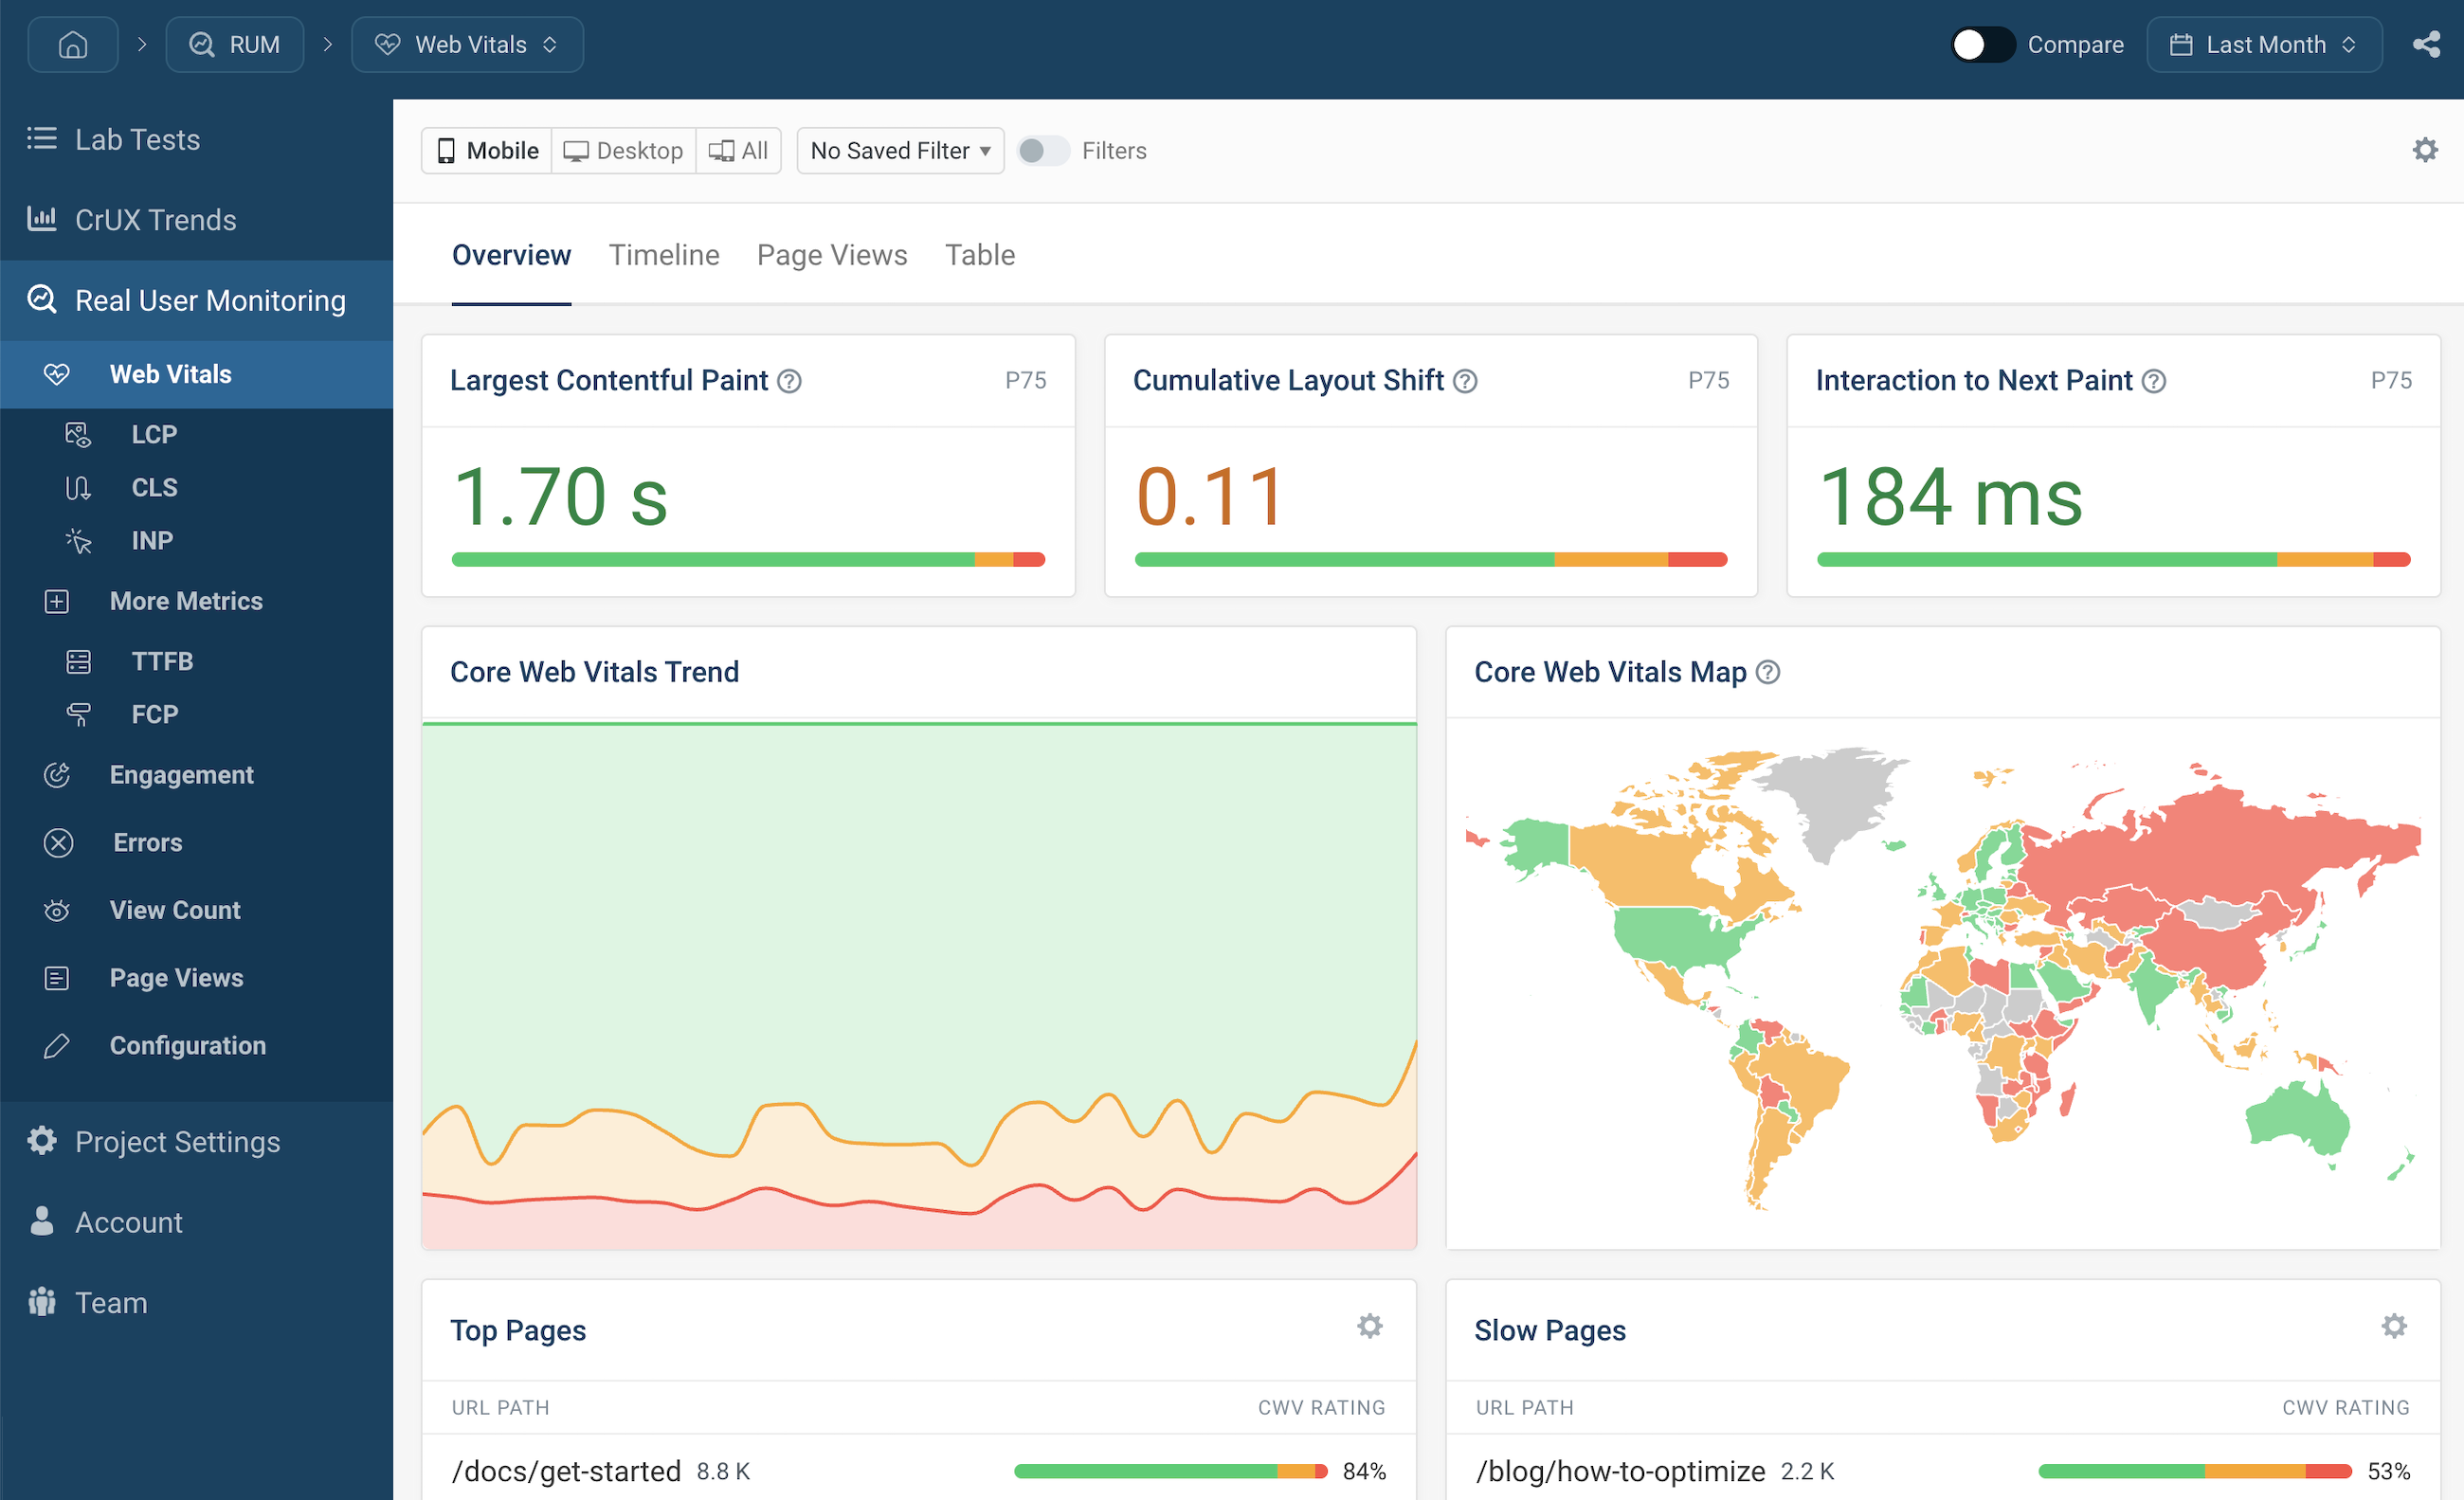
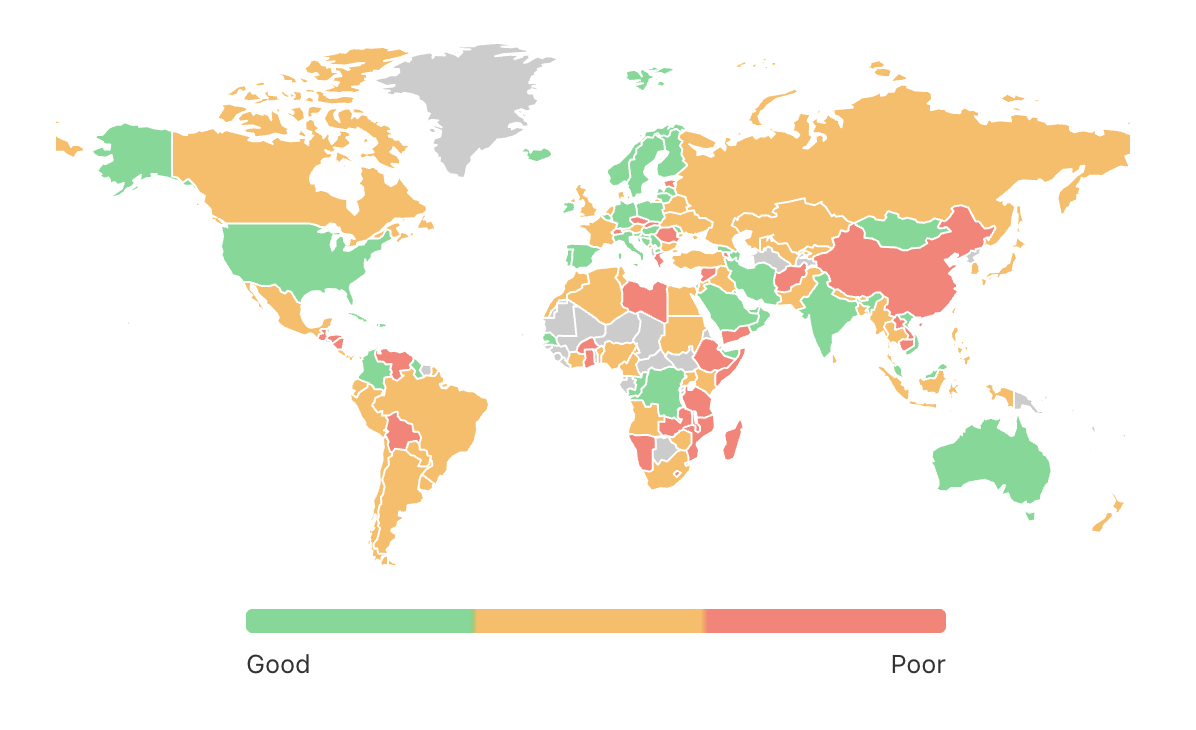
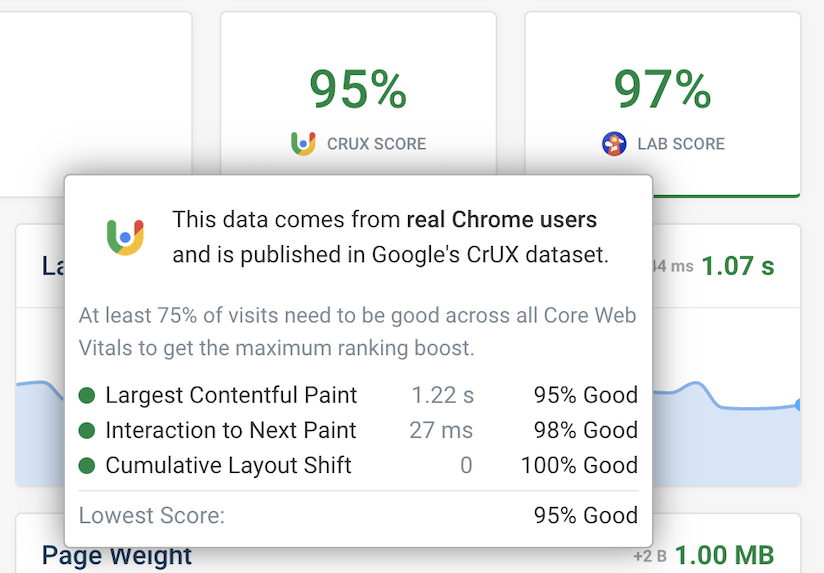
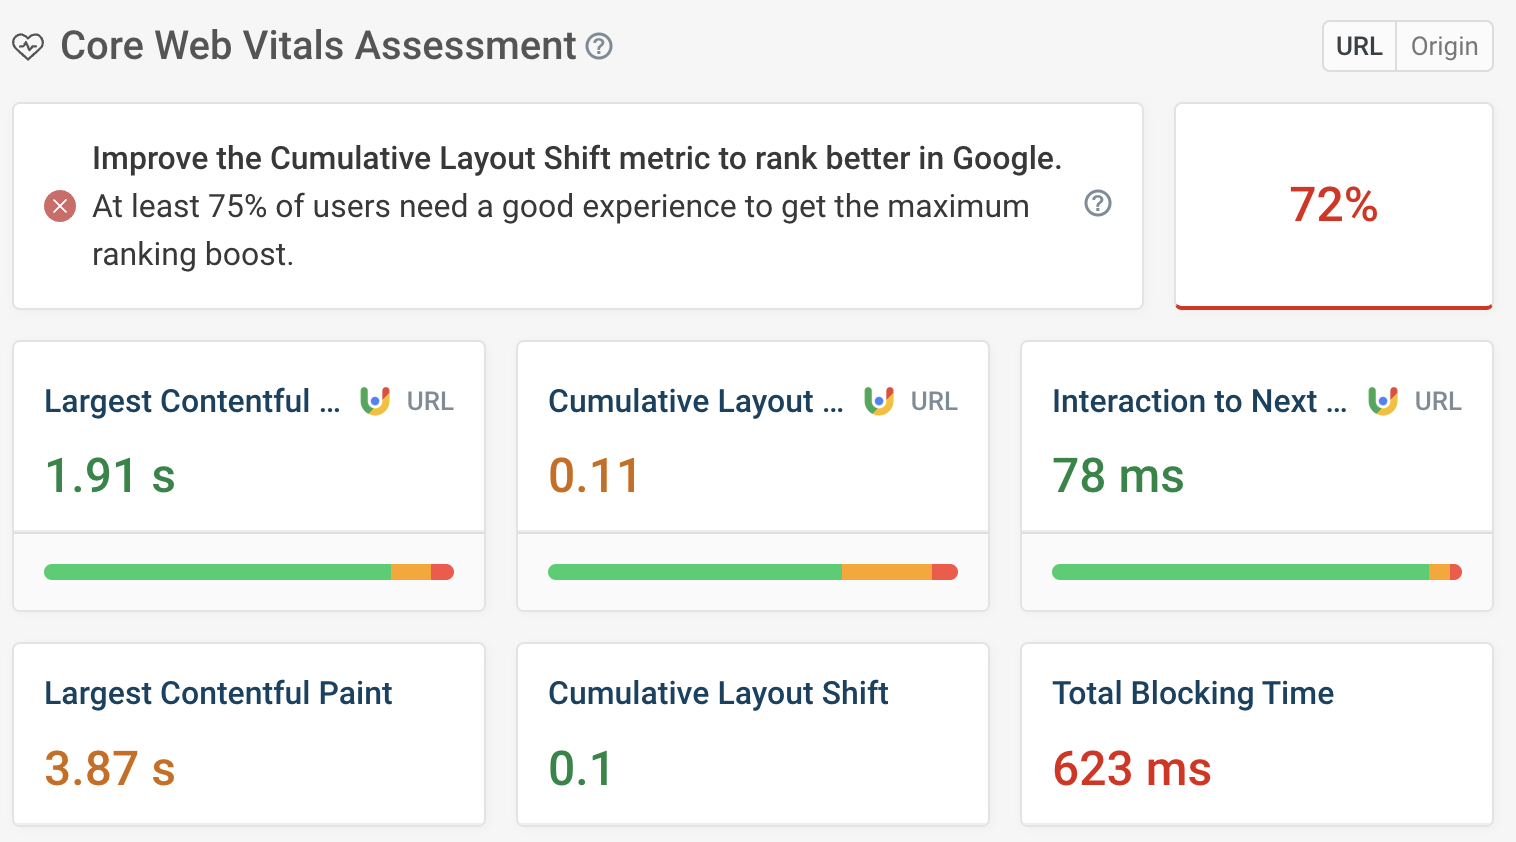
Optimize Core Web Vitals
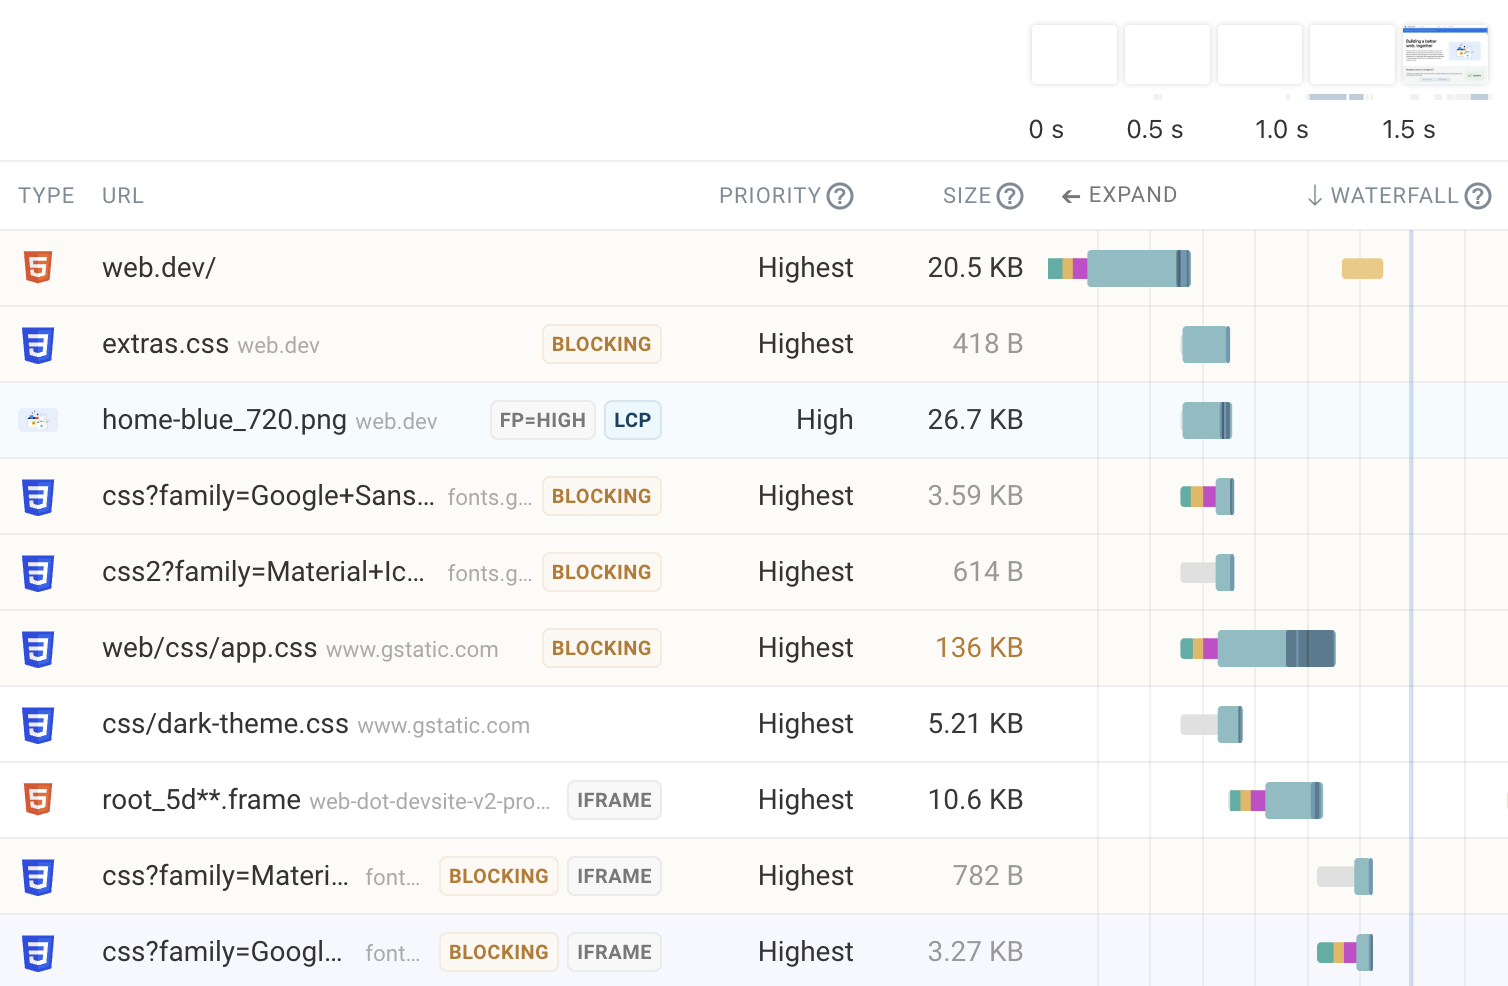
In-depth technical analysis
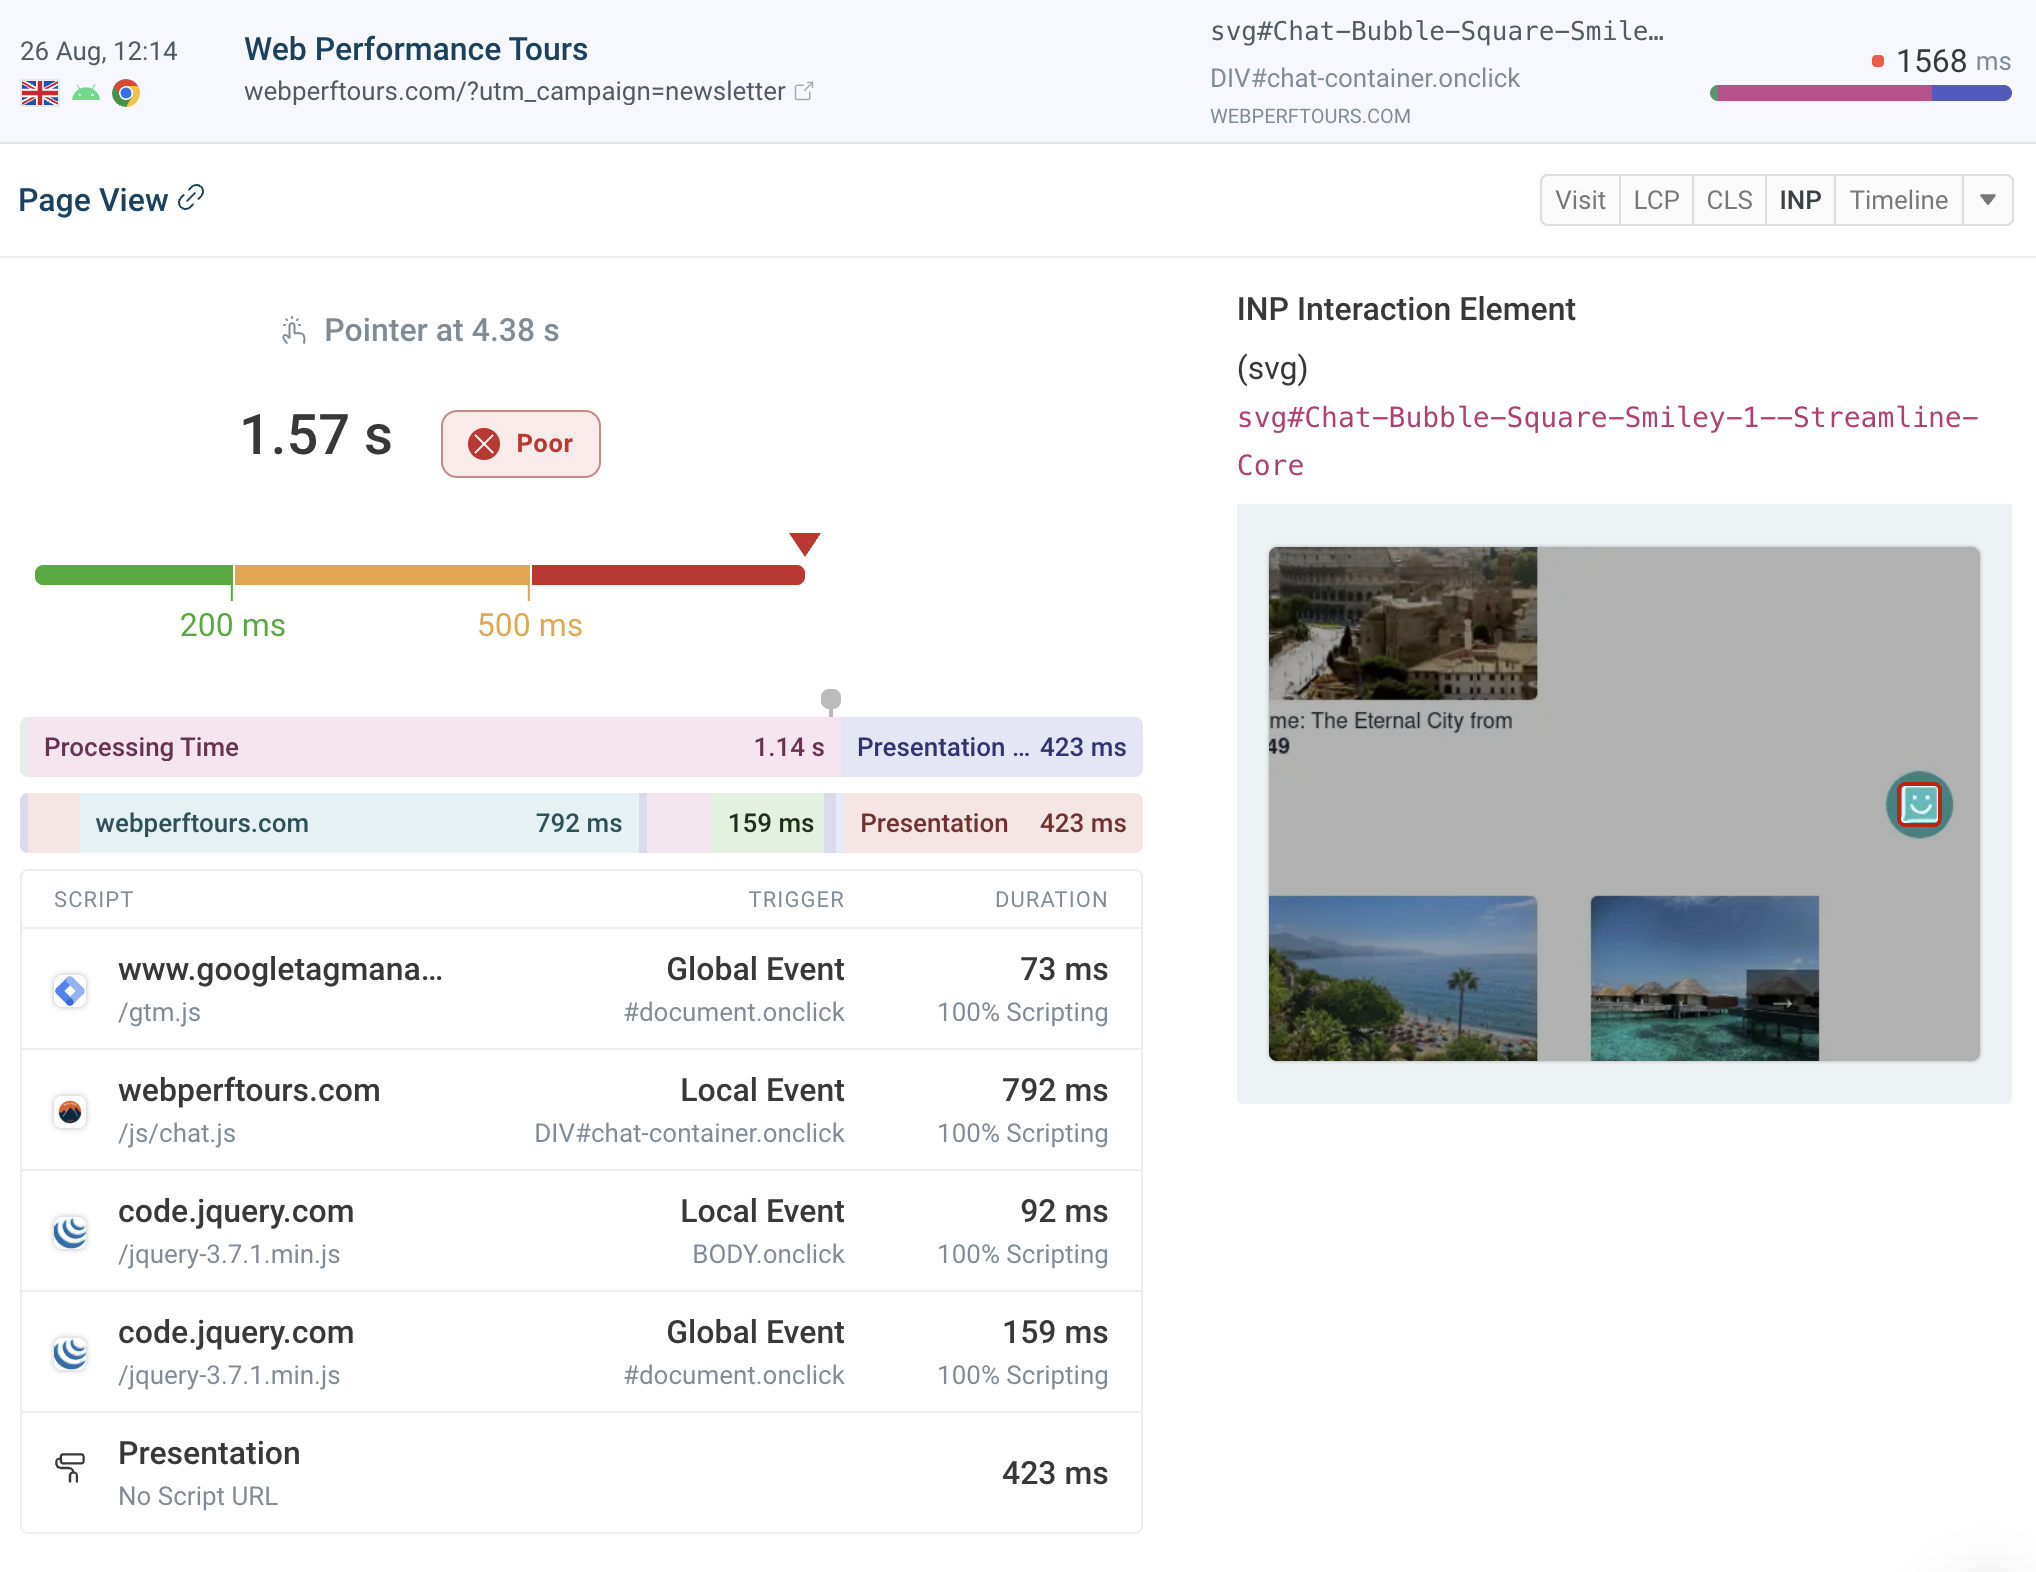
Improve slow interactions
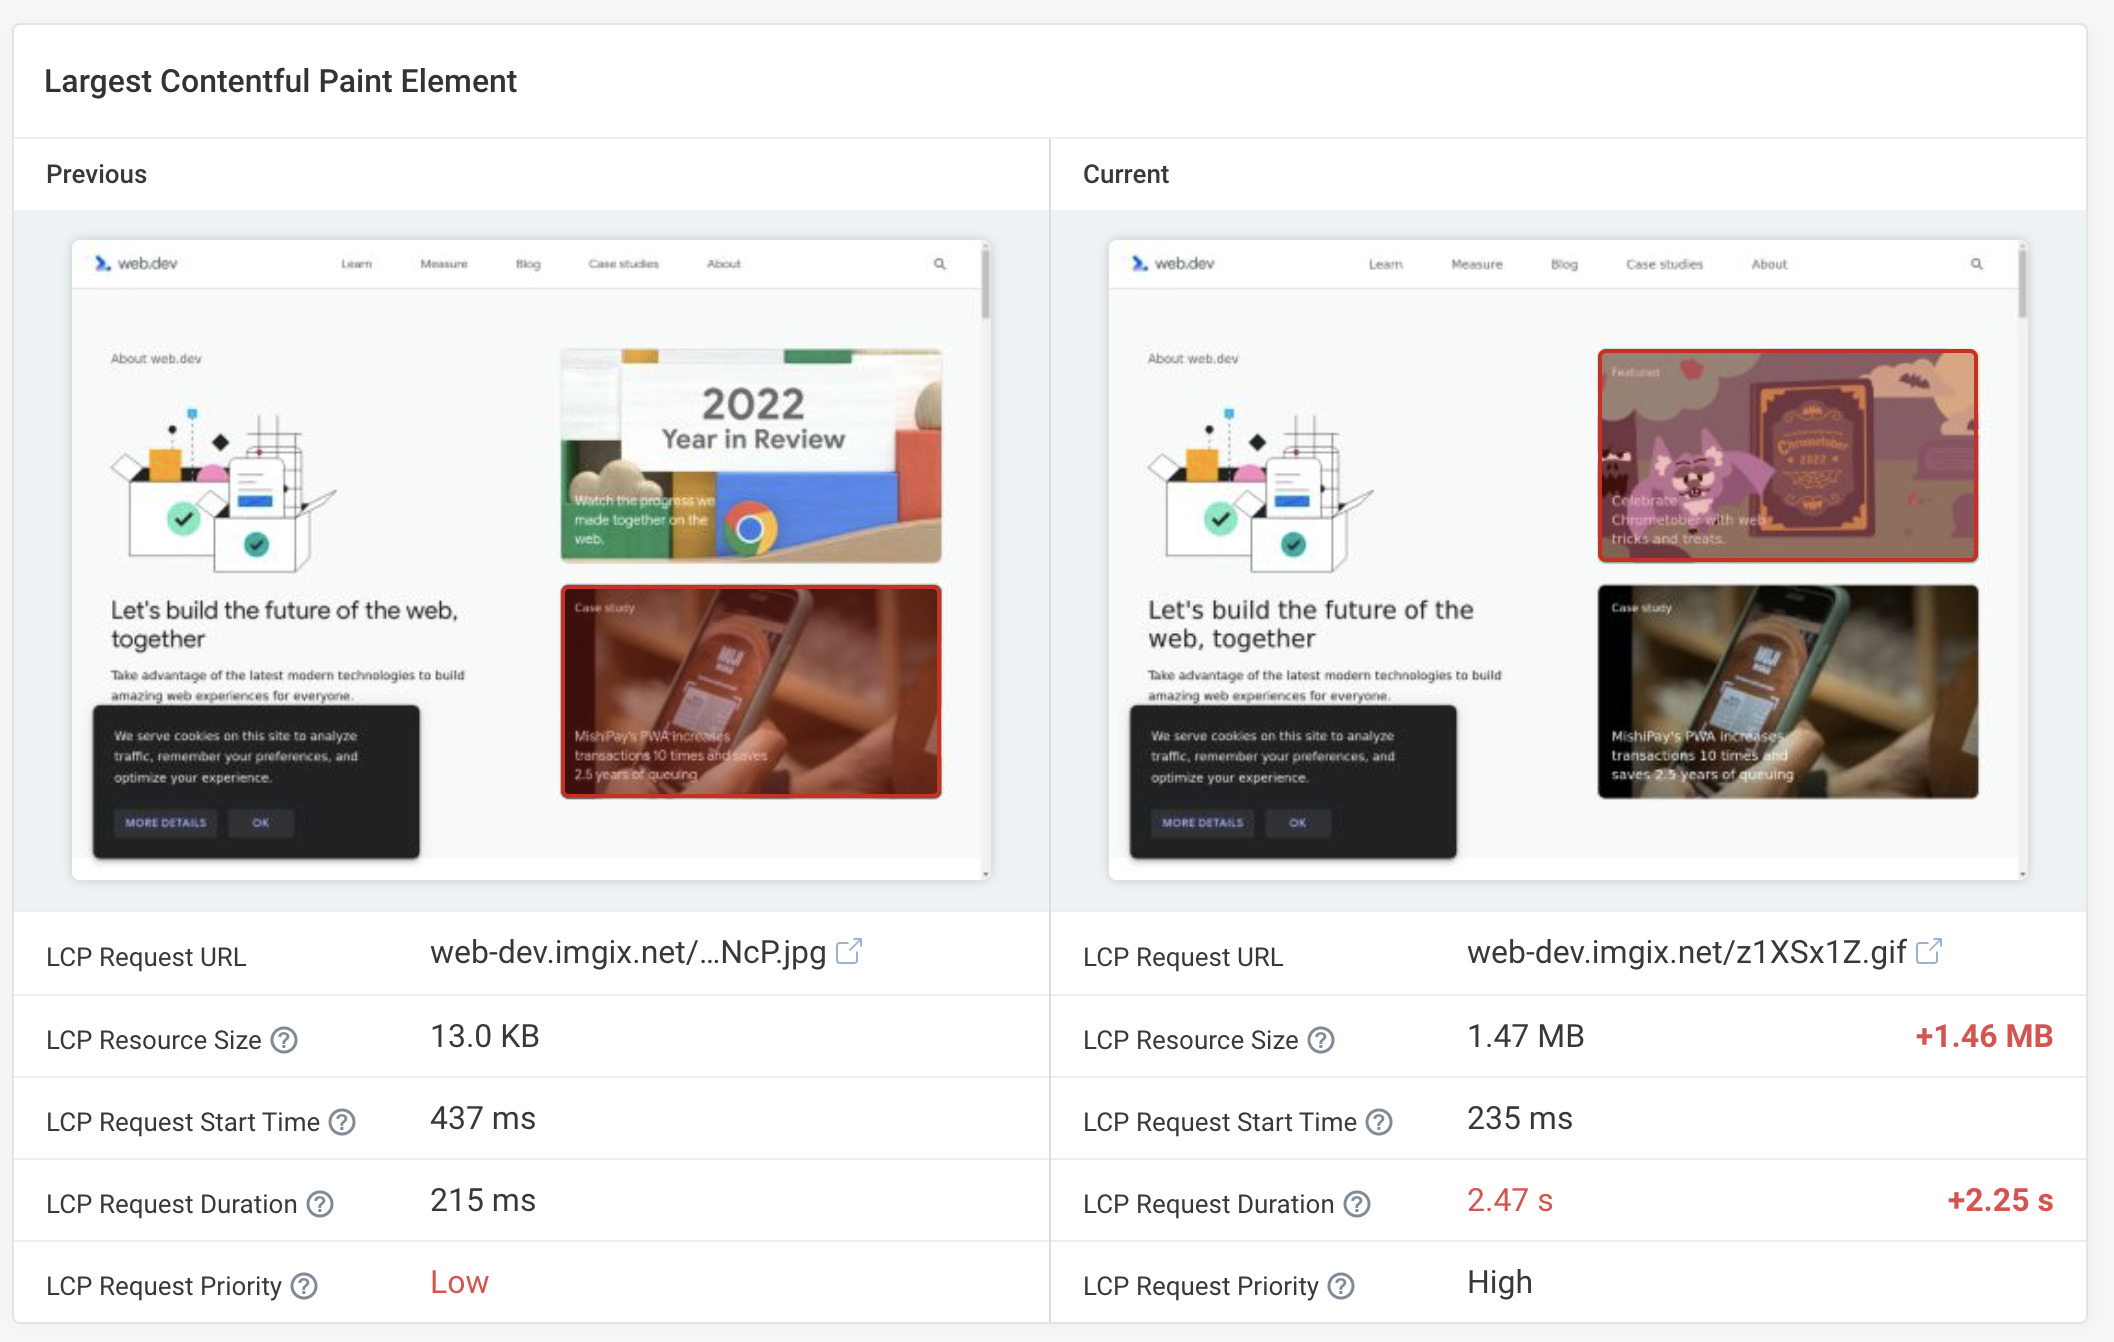
Catch and fix regressions
Communicate with clients and your team
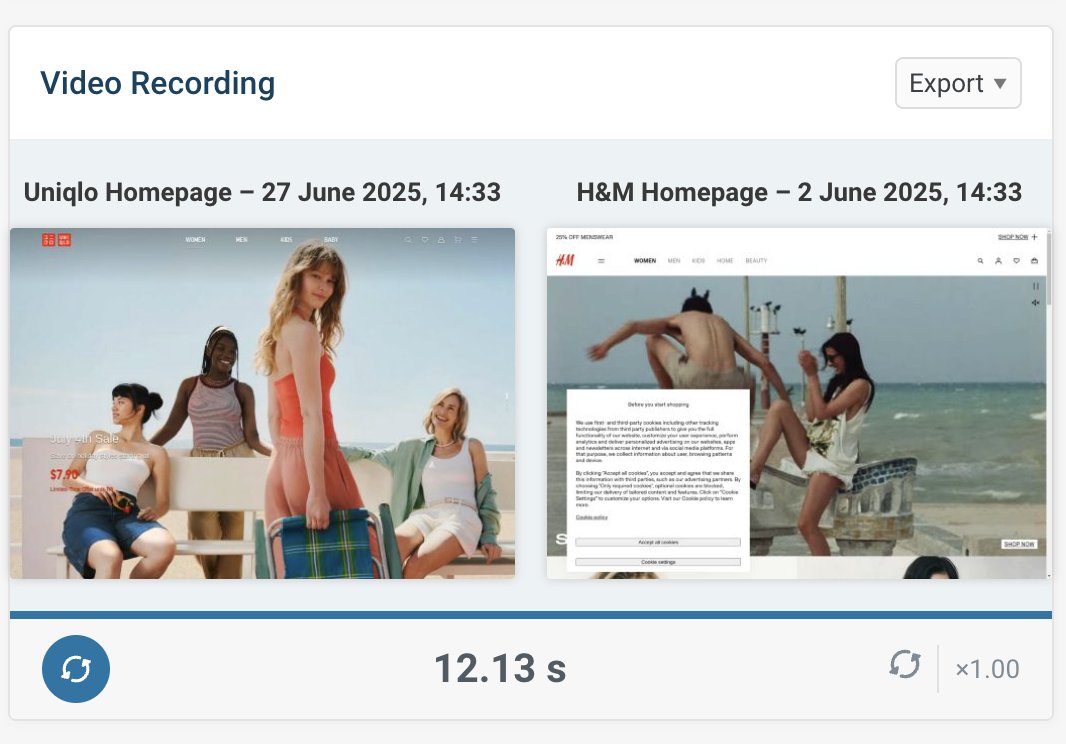
Video export
Demonstrate how visitors experience your website. Generate a side-by-side view with a competitor. Or share a before and after video showing the impact of your work.
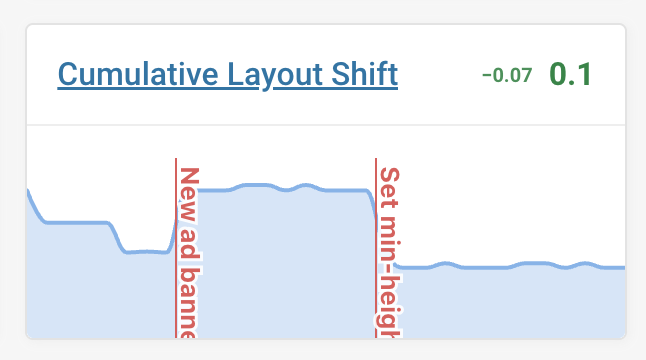
Chart annotations
Deployed a new version or added a new third-party? Mark this in your charts to clearly see the performance impact.
Share page speed data
Share test results with a unique link or by exporting data as PDF or CSV. Invite team members and clients to collaborate.
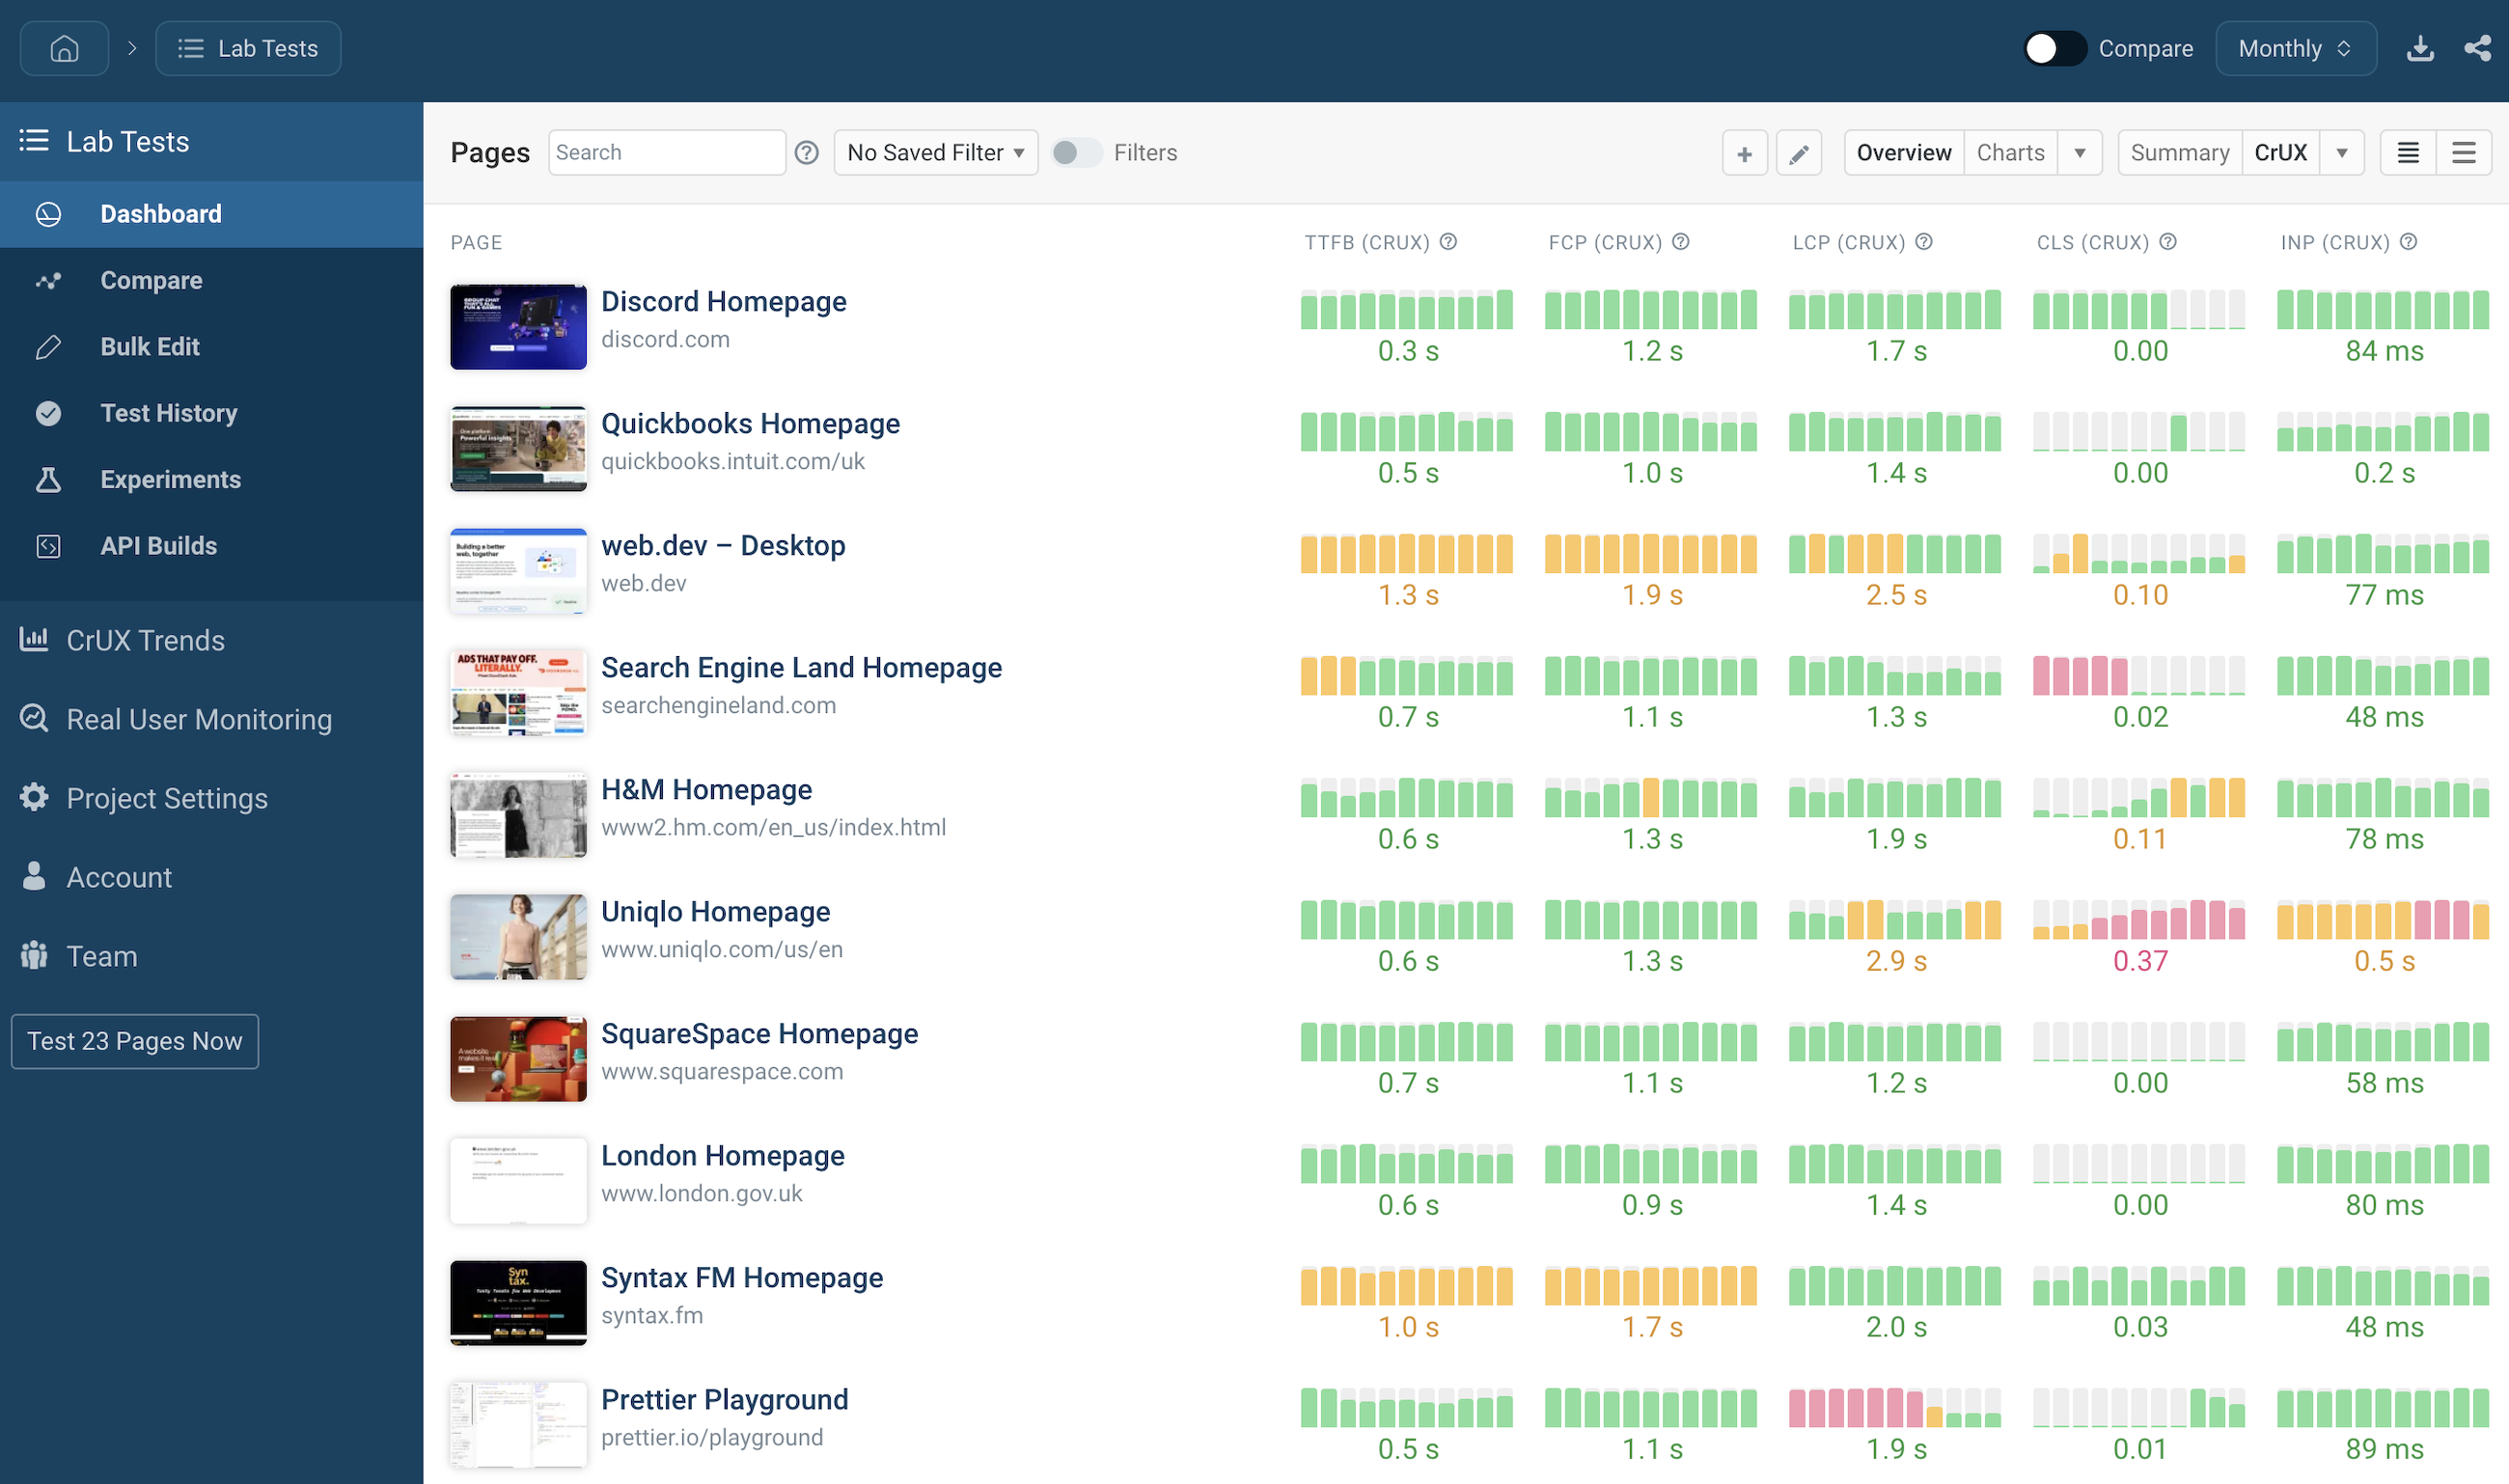
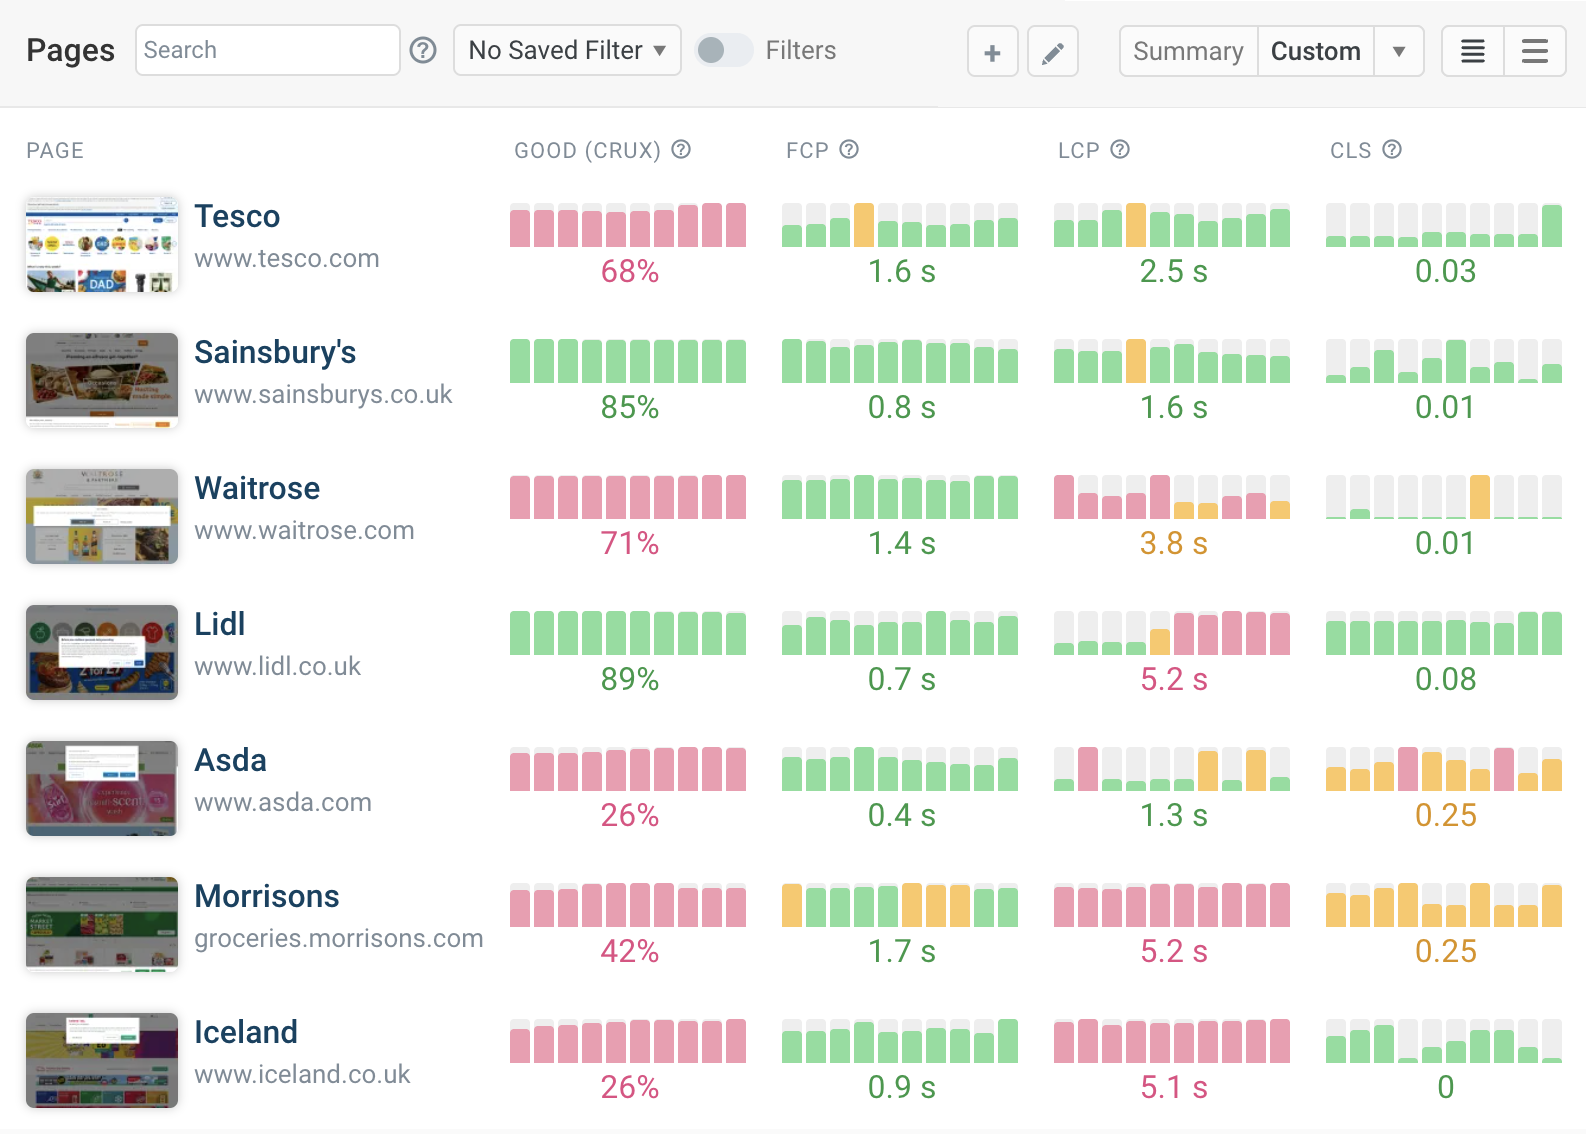
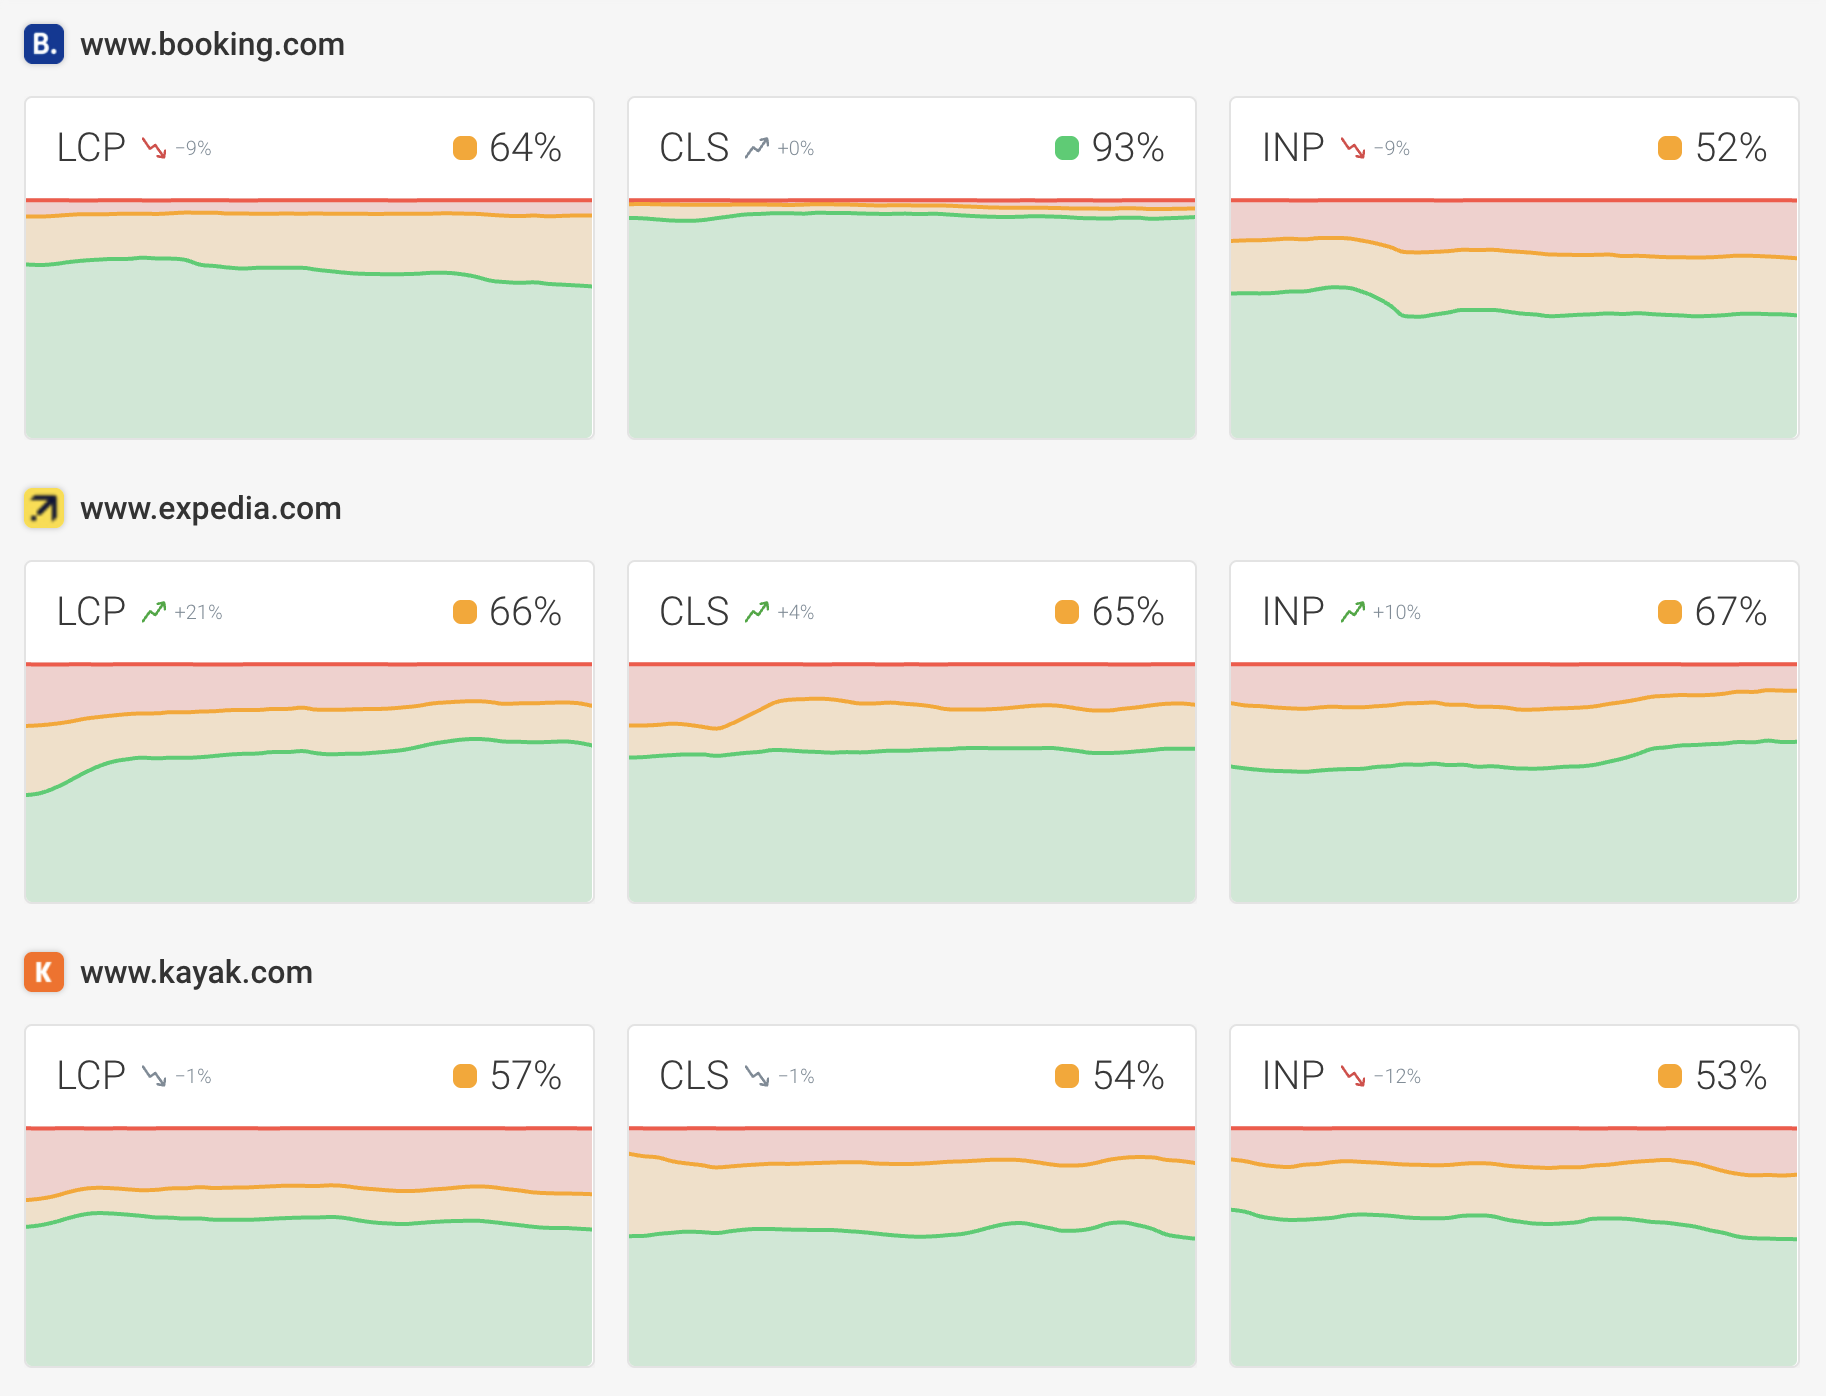
Benchmark within your industry
An efficient website optimization workflow
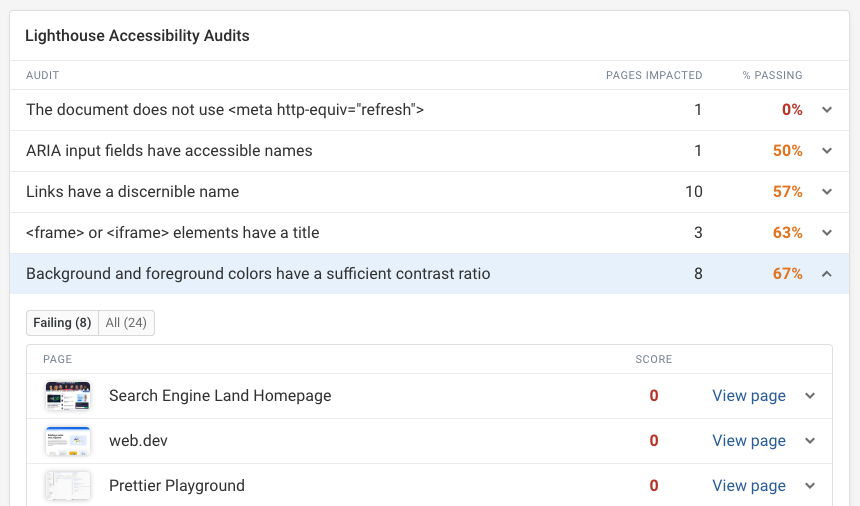
Audits dashboard
See all Lighthouse audit scores and identify the most common issues on your website in the audits dashboard. Check performance, accessibility, and SEO.
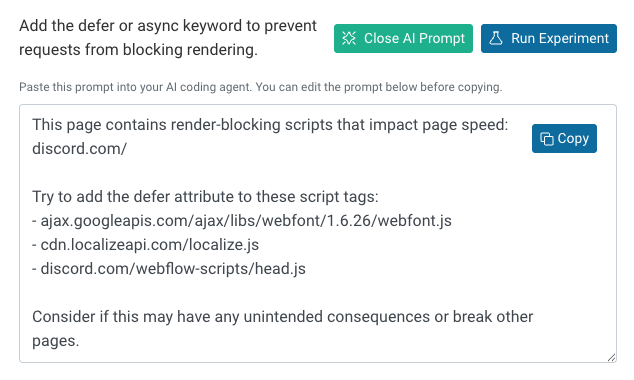
AI agent prompts
Generate ready-to-use prompts for AI coding agents like Claude Code or Cursor. Get specific, actionable fix instructions based on your test results.
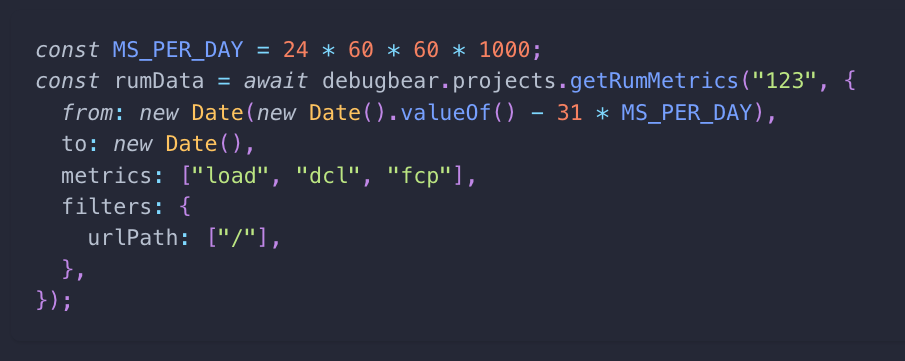
API integration
Our API allows you to trigger synthetic tests, access real user monitoring data, or receive webhook alerts when tests finish.
Hear from our users


You are using an old browser that is not supported anymore. You can continue using the site, but some things might not work as expected.