A Detailed Guide To Website Performance Metrics
Measuring website performance is important to understand how visitors experience your website and make your website faster. Tools like DebugBear, PageSpeed Insights, WebPageTest and Lighthouse capture many different metrics to describe the speed of your website.
This guide explains the different metrics that are available, what they measure, and which ones you should focus on.
Types of page speed data
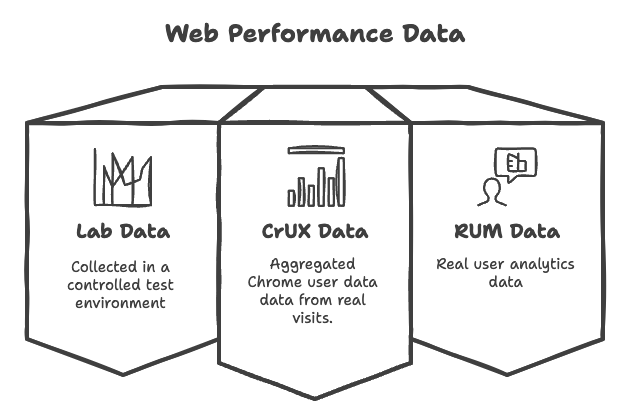
Web performance metrics can be collected in different environments. DebugBear reports three different types of data.
- Lab Data reports how a website performs in a controlled test environment using defined parameters such as network speed, location, and device speed.
- CrUX Data is collected automatically by Google based on real Chrome user visits. The results aggregate visits by different users across a 28-day period.
- RUM Data is collected from real users using an analytics snippet installed on the website. In addition to aggregate metrics, RUM data also surfaces individual user experiences.
Different types of website performance metrics
Different types of web performance metrics exist to measure different aspects of the user experience:
- Load time milestones: how long do users have to wait before they can see different parts of the content?
- Interactivity metrics: how quickly does the page respond to user interactions?
- UX metrics: for example, is the page layout stable after the page has rendered?
- Visitor metrics: what browser are visitors using and how fast is their network?
- Technical metrics: metrics that don't impact users directly but are used for debugging web performance issues
Often these metrics are also combined with business metrics like SEO traffic, bounce rate or conversion rate. That way it can be demonstrated that investing in performance is worth it.
Core Web Vitals metrics
Over the last few years Google has worked on developing three core metrics that website owners should focus on, covering three different aspects of the overall visitor experience:
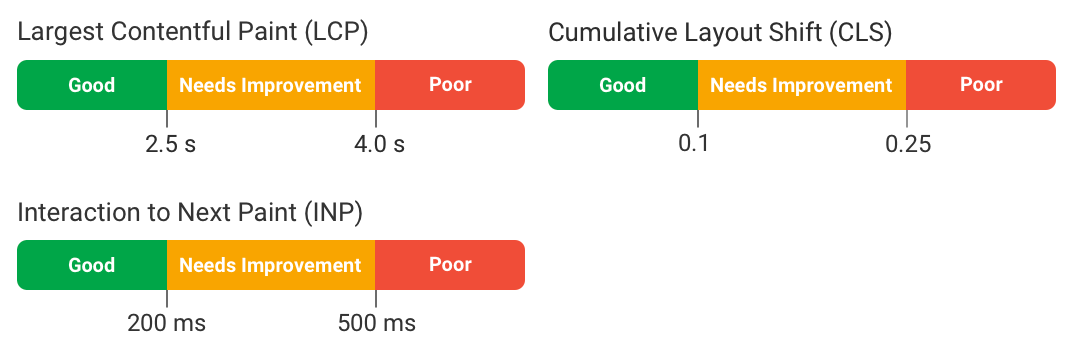
- Largest Contentful Paint: how soon after opening the page does the largest content element become visible
- Cumulative Layout Shift: how much does page content shift around after loading?
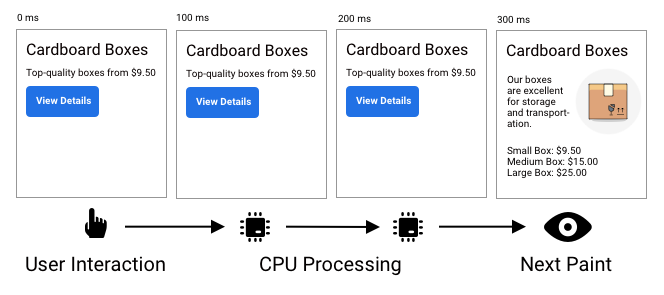
- Interaction to Next Paint: how long does the page stay frozen after a user interaction?
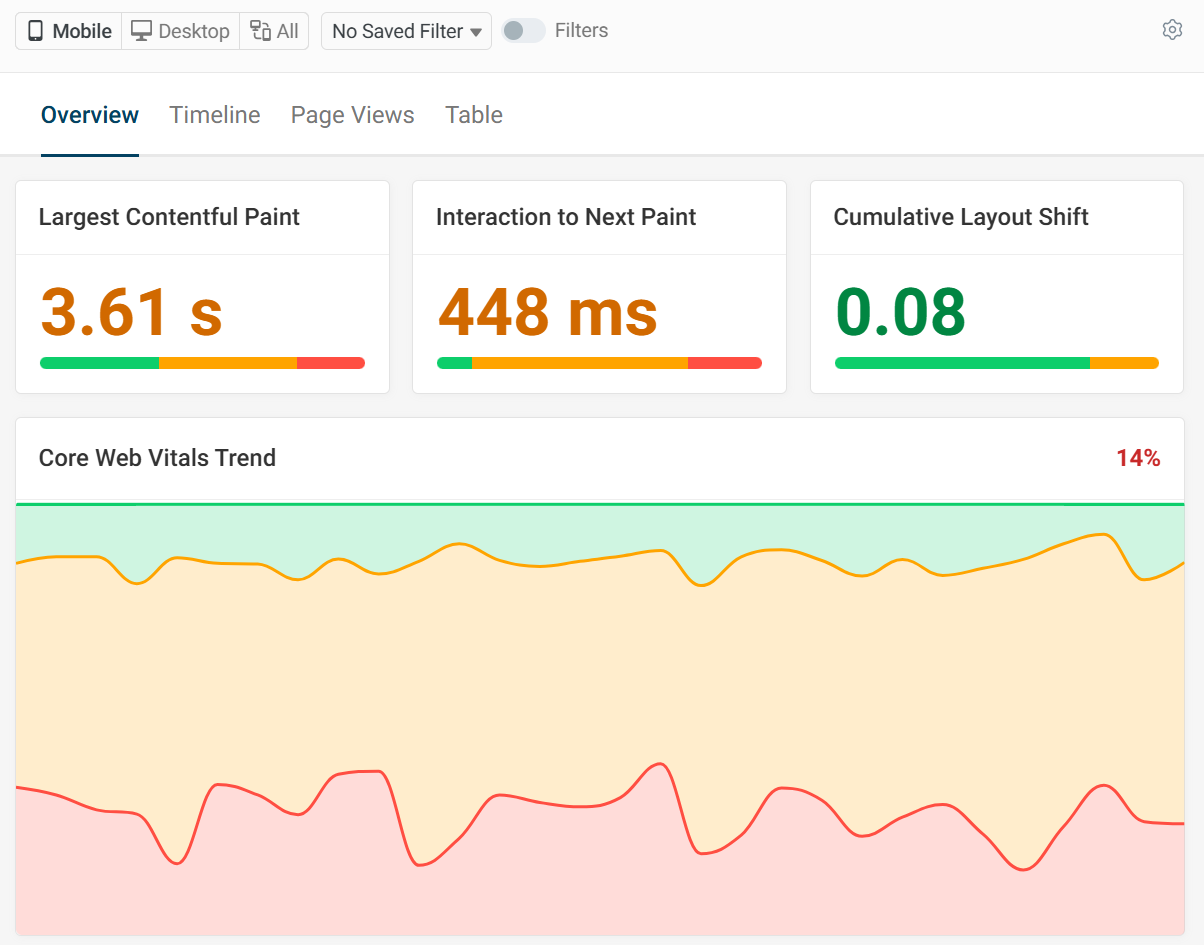
The Core Web Vitals are a great place to get started as these metrics focus on the user experience and also impact Google rankings.
Core Web Vitals tools like DebugBear can help you monitor and analyze the Core Web Vitals. Here's an example dashboard from DebugBear's real user monitoring product.
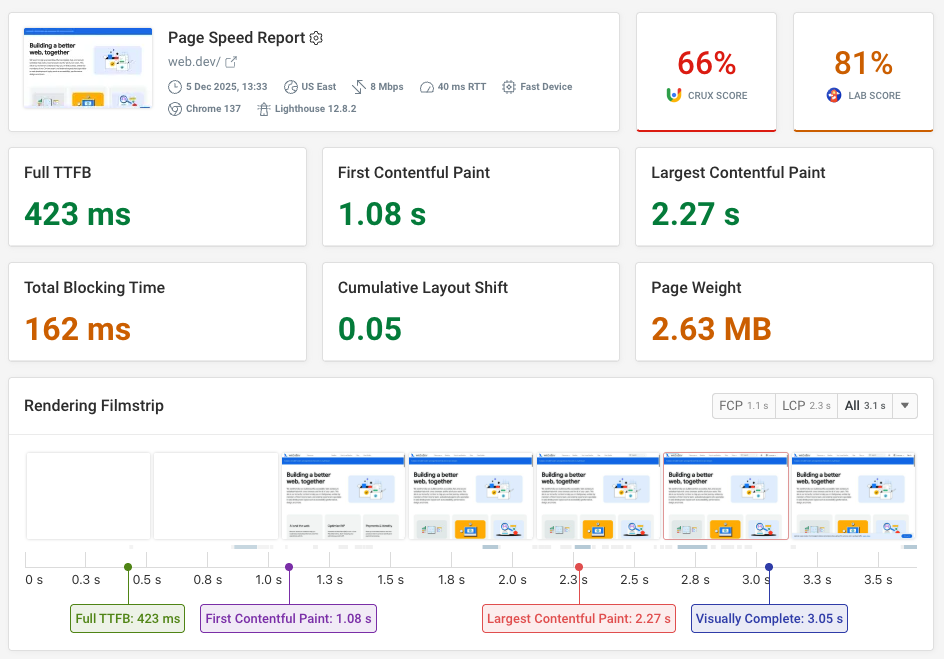
Page performance metrics and loading milestones
Page load timings measure how much time has elapsed since the browser started opening a page. Each timing describes a different progress event, from the initial rendering of the page up to the page having fully loaded with no more visual changes.
The lower these timings are, the faster the website feels for the user.
While the user may see a blank page until website content starts showing up, when the user clicks on a link browsers usually show the previous page content until the new page starts to render.
First Paint (FP)
The First Paint rendering milestone indicates that the user started seeing some part of the page. However, this might just be a page background color or outline without useful content.
First Contentful Paint (FCP)
The First Contentful Paint occurs when text or an image is first displayed.
At least two conditions have to be satisfied for this to happen:
- The document HTML code has to be loaded from the server
- Render-blocking stylesheets and scripts need to have loaded
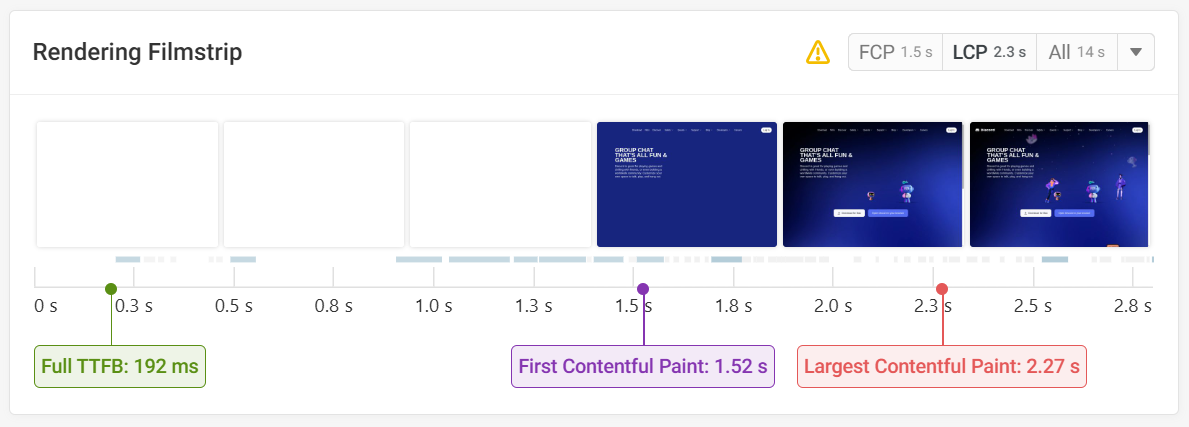
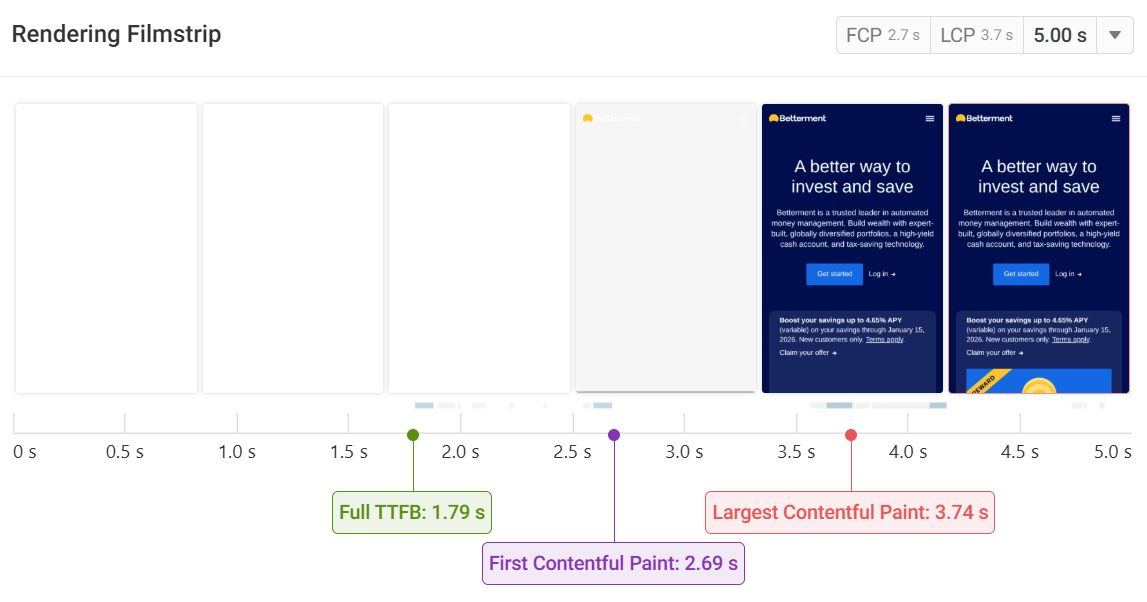
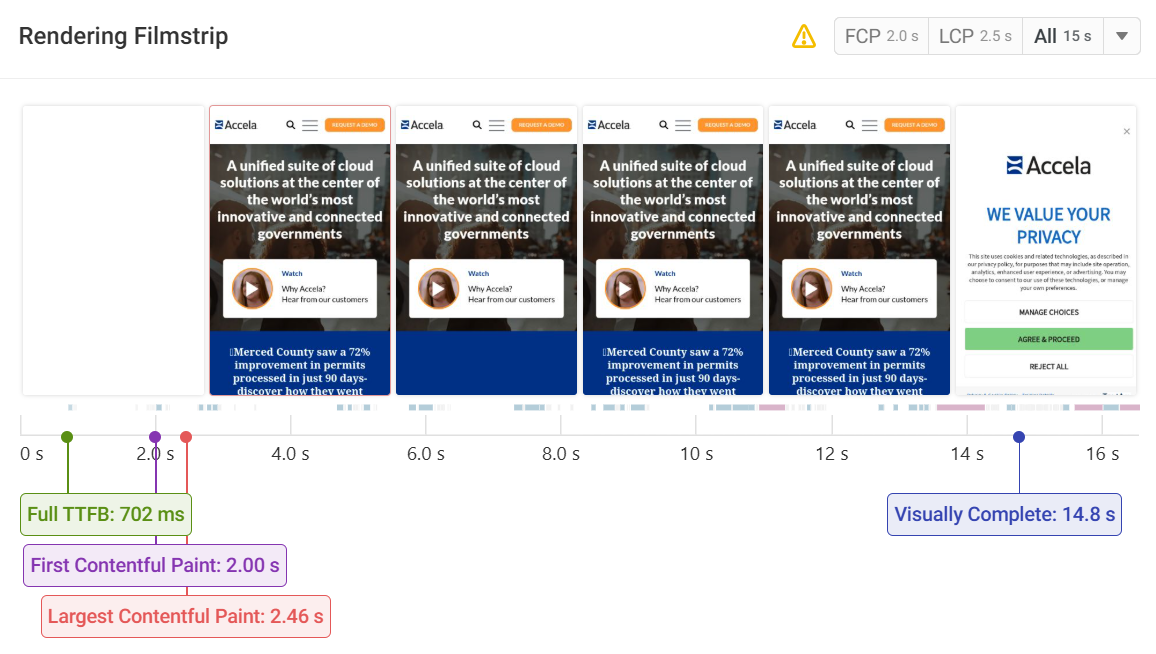
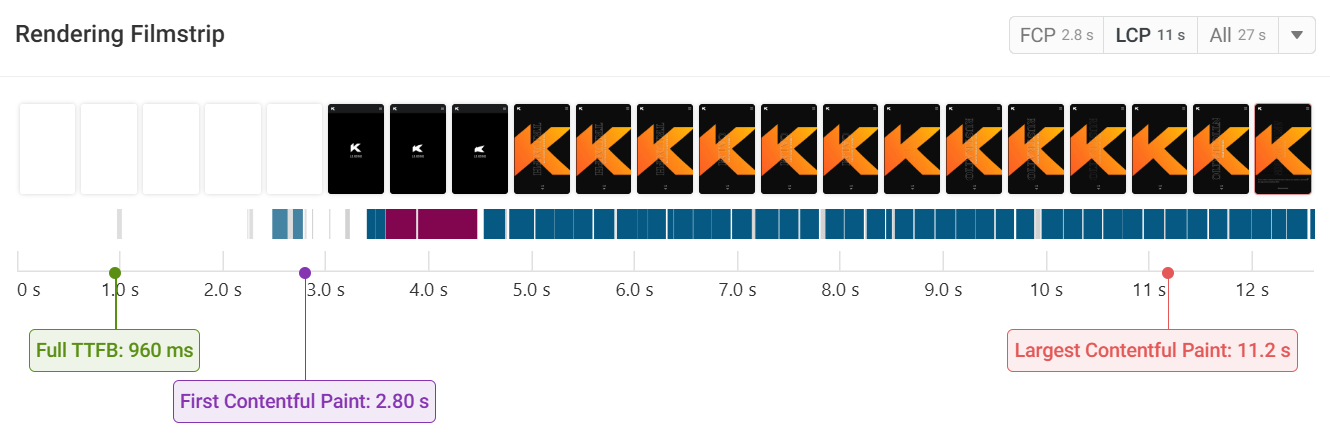
Largest Contentful Paint (LCP)
This metric describes when the largest contentful element on the page is rendered. Images and elements with background images count as painted only once the image has loaded.
For example, in this filmstrip the Largest Contentful Paint only occurs 3.74 s after the page has started to load.
Speed Index (SI)
The Speed Index measures how quickly most of the page content is rendered. Unlike Largest Contentful Paint it does not focus on a single UI element being rendered but instead looks at the whole screen.
Strictly speaking it is not a rendering milestone, but rather a statistic calculated based on the website's rendering filmstrip.
Visually Complete
The Visually Complete milestone marks when the page has been fully rendered and no additional visual changes occur. It's a useful way to look at whether all content on the page has loaded and is ready to use.
However, it can sometimes happen very late compared to other load timing metrics, for example if a chat widget is loaded and appears several seconds after the main page content.
Test the load time of your website
Running a lab-based website speed test is a great way to see how fast your website loads. You'll be able to diagnose performance issues using a request waterfall, view Lighthouse report data, and get custom web performance recommendations.
These tests also often incorporate real user page speed data from Google's Chrome User Experience Report.
Run A Free Page Speed Test
Test Your Website:
- Automated Recommendations
- Detailed Request Waterfall
- Web Vitals Assessment
Additional metrics for debugging page load time
So far we've looked at metrics that measure something that impacts user experience. While this is ultimately what matters, sometimes looking at other more technical milestones can help identify what part of the page load process needs to be optimized.
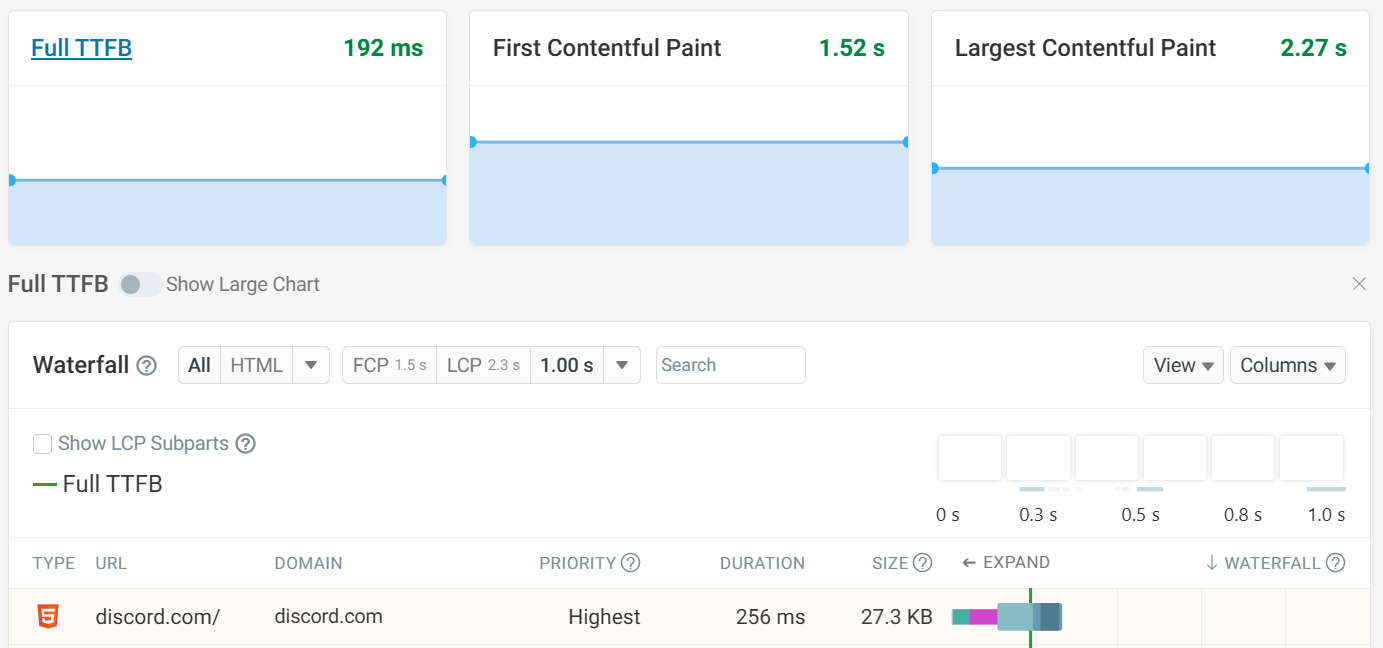
Time to First Byte (TTFB)
All websites start loading by requesting an HTML document. TTFB measures how long it takes for the server to respond with the first part of the HTML document. For larger documents there'll be additional time spent downloading the full response after that.
Time to first byte is a big factor in overall page speed, as other resources can't load until after the HTML document has been loaded. (Unless you use the Early Hints feature.)
Page weight
How long it takes to download a resource that's needed to render a website depends a lot on how large the resource is. Therefore measuring the page weight of a page can provide a lot of insights into what resources need to be optimized.
Page weight is usually dominated by images and JavaScript code.
Large resources especially impact user experience when they are loaded early on before the page starts to render. Loading additional code or resources after the page has rendered will increase page weight, but may not greatly hurt performance.
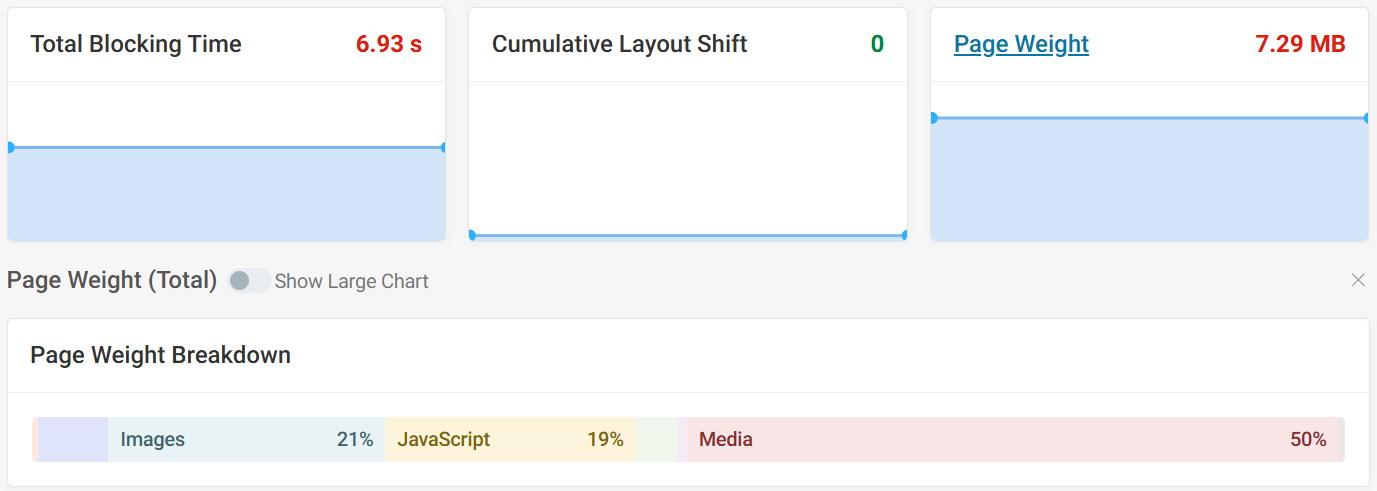
To reduce image size you can use modern image formats and use responsive images to make sure they are served at an appropriate size.
Load Event
The load event fires when all resources in the page have loaded, including stylesheets, scripts, iframes, and images.
It was one of the early performance metrics that could be measured. However, it might not have a close link to user experience, for example if there are many images below the fold that are fine to load a bit later.
DomContentLoaded
This metric indicates how long after the page navigation the DOMContentLoaded event is fired. This marks the point where the browser's HTML parser has reached the bottom of the document, including running any synchronous scripts.
Interactivity and CPU metrics
While load time measures how long it takes before the users can start using the page, interactivity metrics look at visitor experience after the initial load.
How fast page interactions feel depends a lot on the amount of CPU processing happening on the page during the interaction.
Interaction to Next Paint (INP)
INP is one of Google's Core Web Vitals and a relatively new metric. It measures how long it takes for the page UI to be ready to update after a user interaction. (Whether the page content actually changes does not matter.)
CPU Time
To debug interactivity it often helps to look at how much processing happens on the page in general. If the CPU is very busy that means interactions won't be processed as quickly.
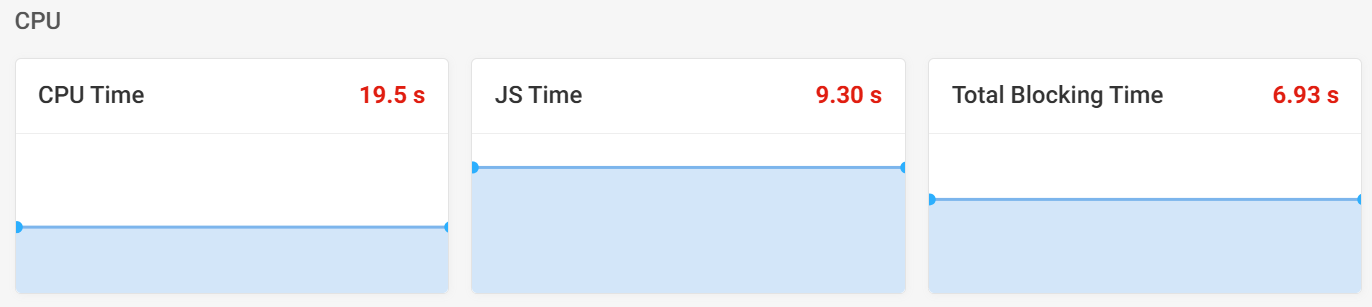
Total Blocking Time (TBT)
TBT also measures CPU processing time, however it only looks at tasks that exceed 50 milliseconds in duration. Shorter tasks won't significantly delay user interactions.
When looking at a rendering timeline on DebugBear you can see tasks longer than 50 milliseconds marked in blue and tasks over 250 milliseconds in red.
Time to Interactive (TTI)
A page is interactive when there are:
- No more than two GET requests are in progress (network quiet)
- No more main-thread CPU tasks taking longer than 50ms (CPU quiet)
The Time to Interactive generally indicates when the page has fully loaded. Lighthouse ends its test when both the network and CPU have reached an idle state. On DebugBear you can control this behavior with injected scripts that return promises.
We don't recommend focusing too much on Time to Interactive, as due to the hard idle duration cut-offs it can sometimes fluctuate significantly without major changes in how the page loads.
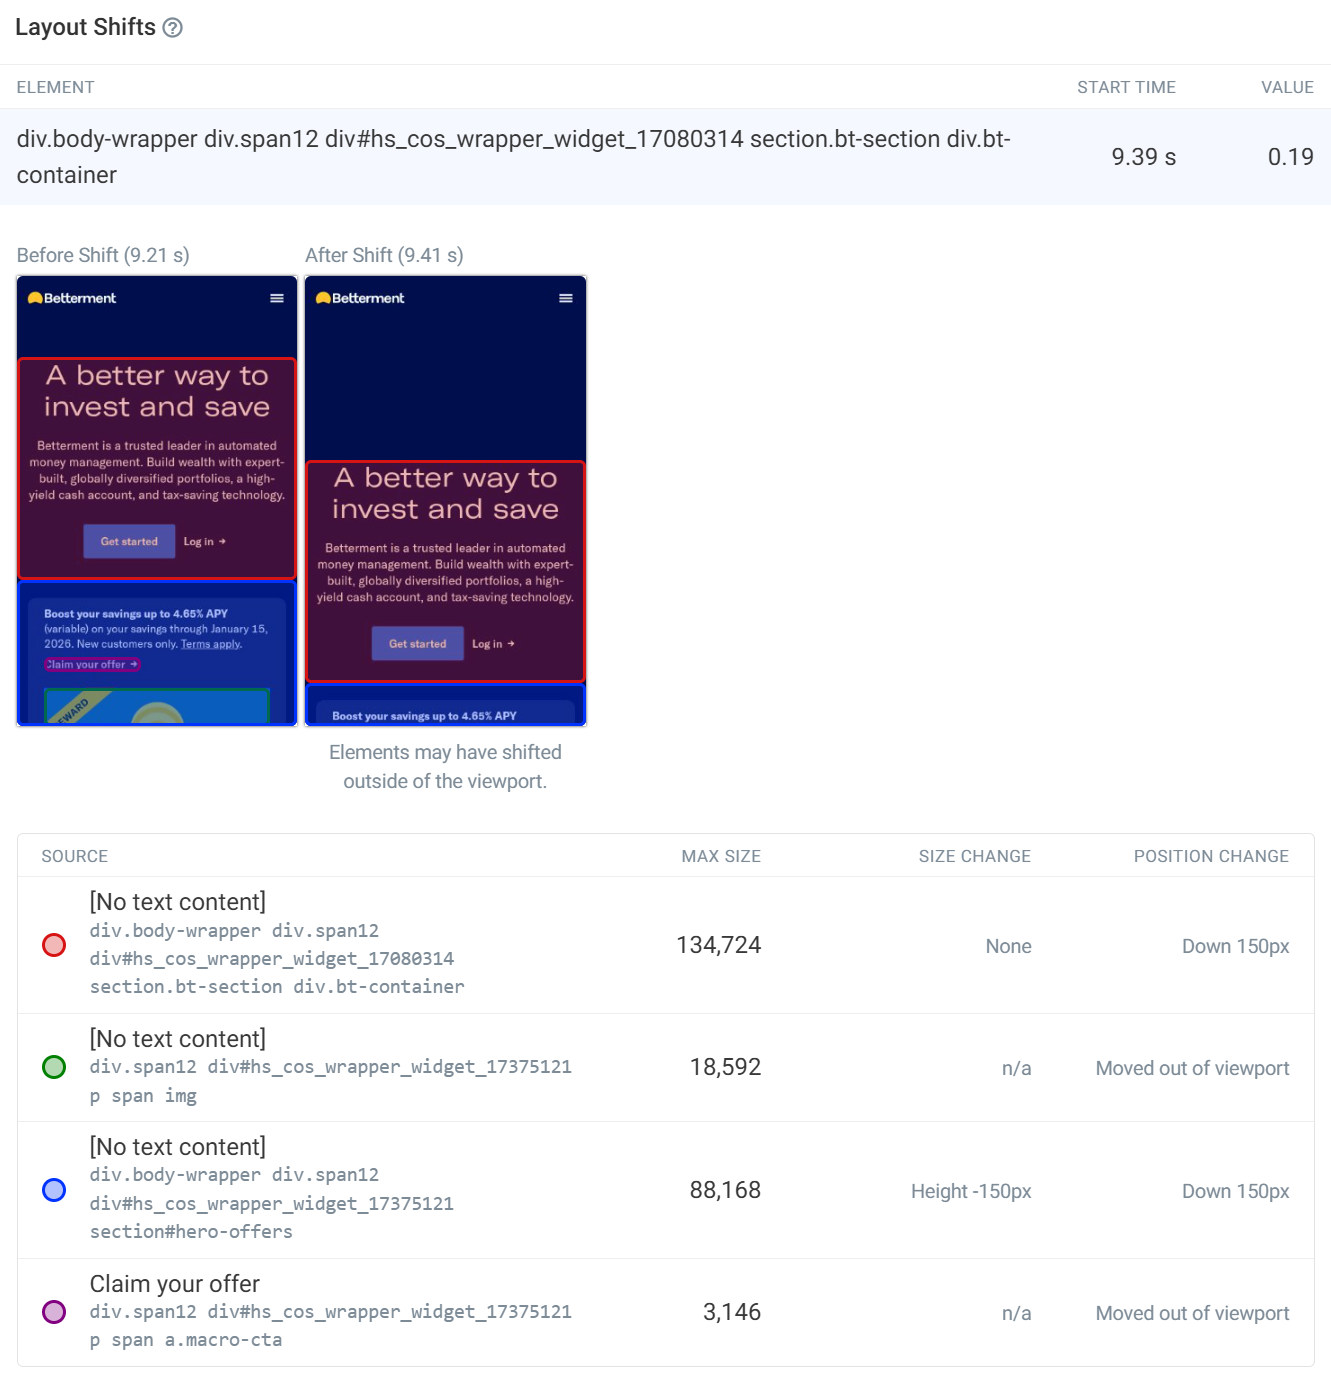
Cumulative Layout Shift (CLS)
There are many metrics that can measure different aspects of on-page experience. But most performance tools focus on Cumulative Layout Shift, as this metric is well-defined and is one of the Core Web Vitals.
CLS measures whether content moves around on the page after first rendering. If content shifts after the page starts to load that means users need to find what they were reading before or might accidentally click in the wrong place.
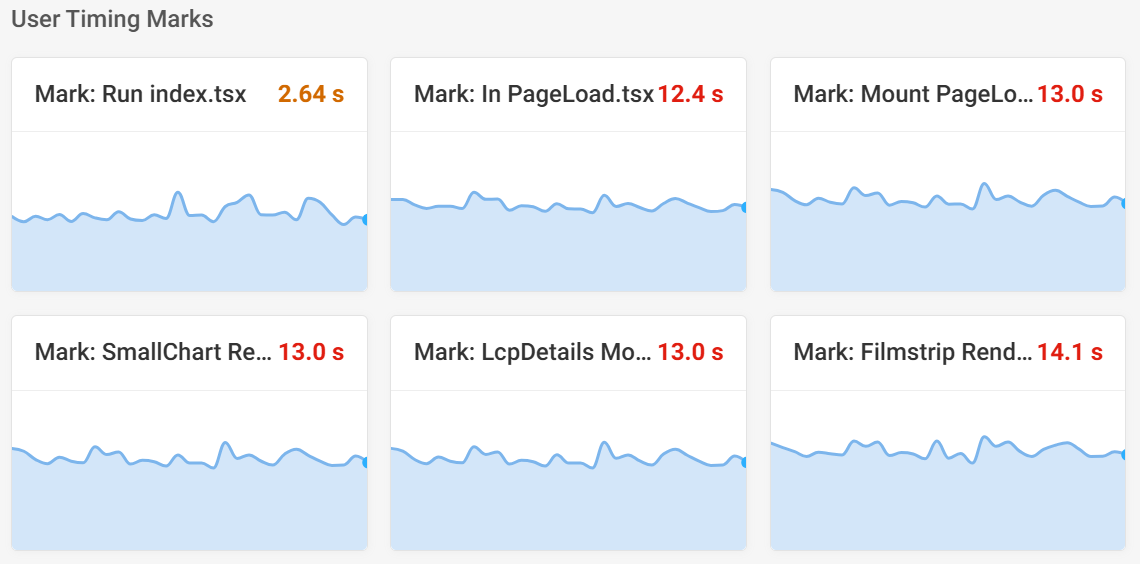
Custom performance metrics (User Timing API)
User timings are custom timings created by your website by calling performance.mark.
Unlike other metrics, user timings can track the metrics that are most important to your users. General-purpose browser metrics can sometimes be misleading, for example when a page reaches an interactive state while the app is still loading data and just rendering a spinner.
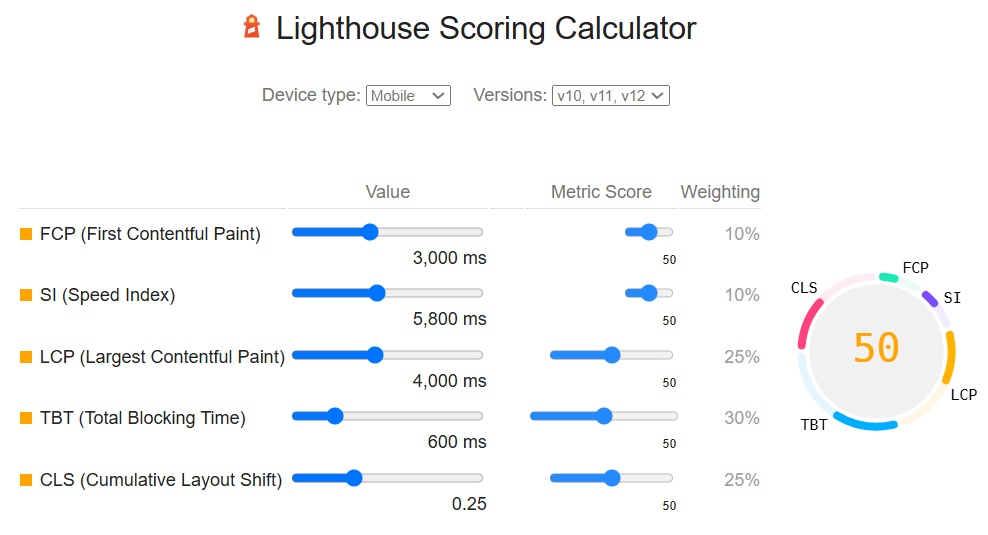
Lighthouse scores
Lighthouse scores range from 0 to 100, with scores above 90 shown in green.
Performance
The Lighthouse Performance score combines multiple performance metrics into one:
- First Contentful Paint
- Speed Index
- Largest Contentful Paint
- Total Blocking Time
- Cumulative Layout Shift
You can use the Lighthouse Score Calculator to get a better understanding of how your Performance score is determined.
Accessibility
This category includes audits that detect common accessibility issues. This includes:
- not using image alt tags
- not having sufficient color contrast
- not providing labels for form elements
Not all accessibility problems can be detected automatically, so you also need to test your website manually.
Best Practices
This score encompasses various good practices, for example
- using HTTPS
- not requesting unnecessary permissions (like for notifications or geolocation)
- using the correct doctype to avoid quirks mode
- not having browser errors in the console
SEO
The SEO category score includes various audits for on-page Search Engine Optimization.
- invalid robots.txt
- no title element
- no meta description
- poor mobile UX (small font sizes or links/buttons)
- and more
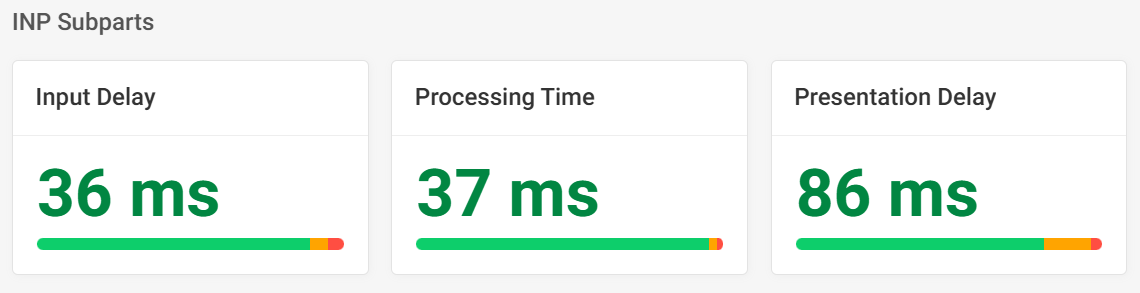
Metric component breakdowns
Many high-level metrics can be broken down further into submetrics. For example,
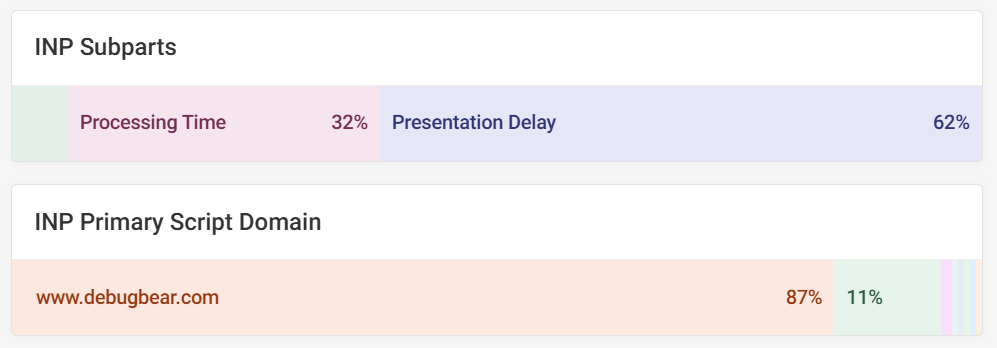
- Interaction to Next Paint can be broken down into input delay, processing time, and presentation delay
- Largest Contentful Paint can be split into subparts: TTFB, resource load delay, resource load duration, and element render delay
- Page weight is grouped by resource type (for example stylesheets and images)
- TTFB can be split into redirect time, connection time, and HTTP request time
- CPU time can be split into HTML parsing, style/layout calculations, painting, garbage collection, and JavaScript evaluation
- JavaScript time can be split into parsing, compilation, and execution
This screenshot shows the INP component breakdown in DebugBear's real user monitoring product.
Other information for debugging
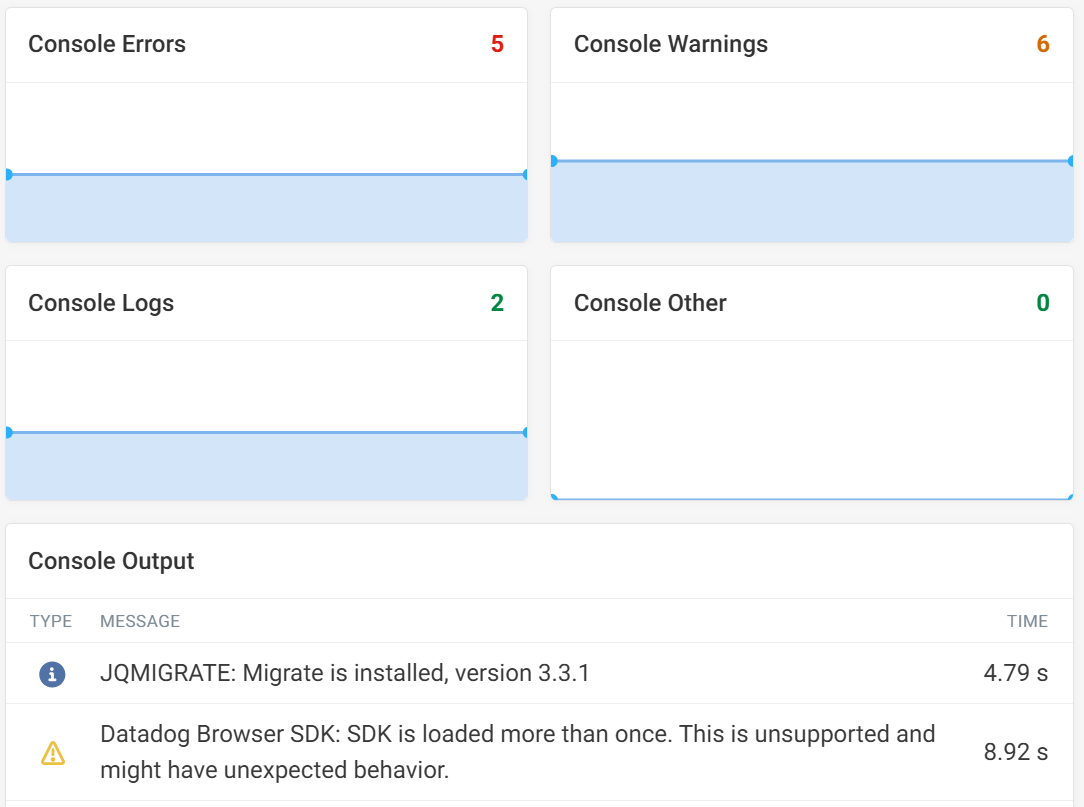
Console output
Console error and output metrics track how many log entries are shown in the console when loading your page. Errors indicate that some JavaScript code is broken, or that a file couldn't be loaded. Warnings often indicate that a browser feature is deprecated.
Real user visitor metrics
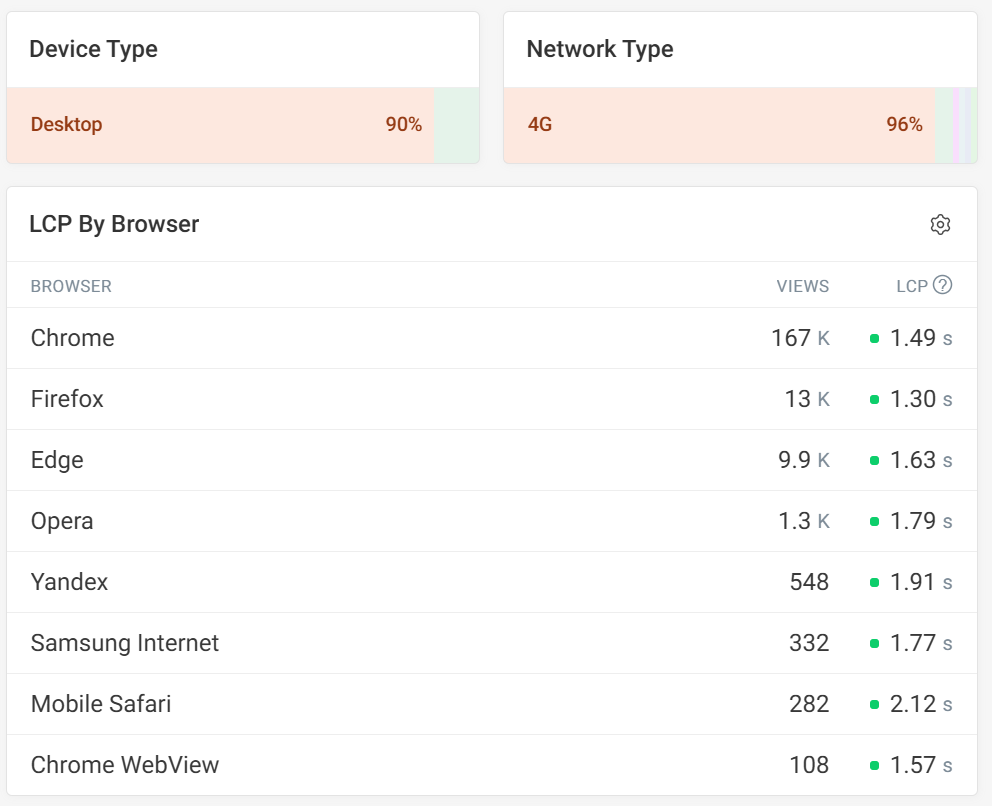
Understanding more about your visitors can tell you how their location, network, and device type is impacting their experience on your website.
If your website feels fast to you but your real users experience poor performance that may be because they use a low-powered mobile device or a slow mobile connection.
You can also track what's causing visitor experiences to be poor. For example, for debugging Interaction to Next Paint issues you can track what scripts are slowing down your website and why they are running. This data comes from the Long Animation Frames API.
What website performance metrics are most important?
Usually the initial loading speed of your website is the best place to start when measuring web performance, for example using the Largest Contentful Paint metric.
After that you can look at the other Core Web Vitals metrics on your website to measure additional aspects of your website's performance.
The Core Web Vitals are important because they impact Google rankings and cover a variety of factors impacting visitor experience. Google has defined metric thresholds for each of them.
Once you've audited Core Web Vitals on your website you can look at more detailed reporting to understand what causes speed issues on your website, for example the LCP subparts breakdown for the Largest Contentful Paint metric.
How to monitor web performance metrics
If you want to keep track of your website performance and find out how to improve it you can try DebugBear. We combine detailed synthetic tests, Google CrUX reporting, and real user Core Web Vitals data into one comprehensive tool.


Monitor Page Speed & Core Web Vitals
DebugBear monitoring includes:
- In-depth Page Speed Reports
- Automated Recommendations
- Real User Analytics Data