
Monitor Real User Core Web Vitals
Track and improve visitor experience with real user monitoring data.
Get the data you need to optimize Interaction to Next Paint and other Core Web Vitals.
”We deal with customers in Regional Western Australia where network speed is slow. RUM allows us to measure real experiences from our customers own eyes rather than guessing what the true value may be.“

”DebugBear has transformed how we approach performance. Instead of guessing based on Google's aggregated data, we're making decisions based on what our actual users are experiencing in the moment.“

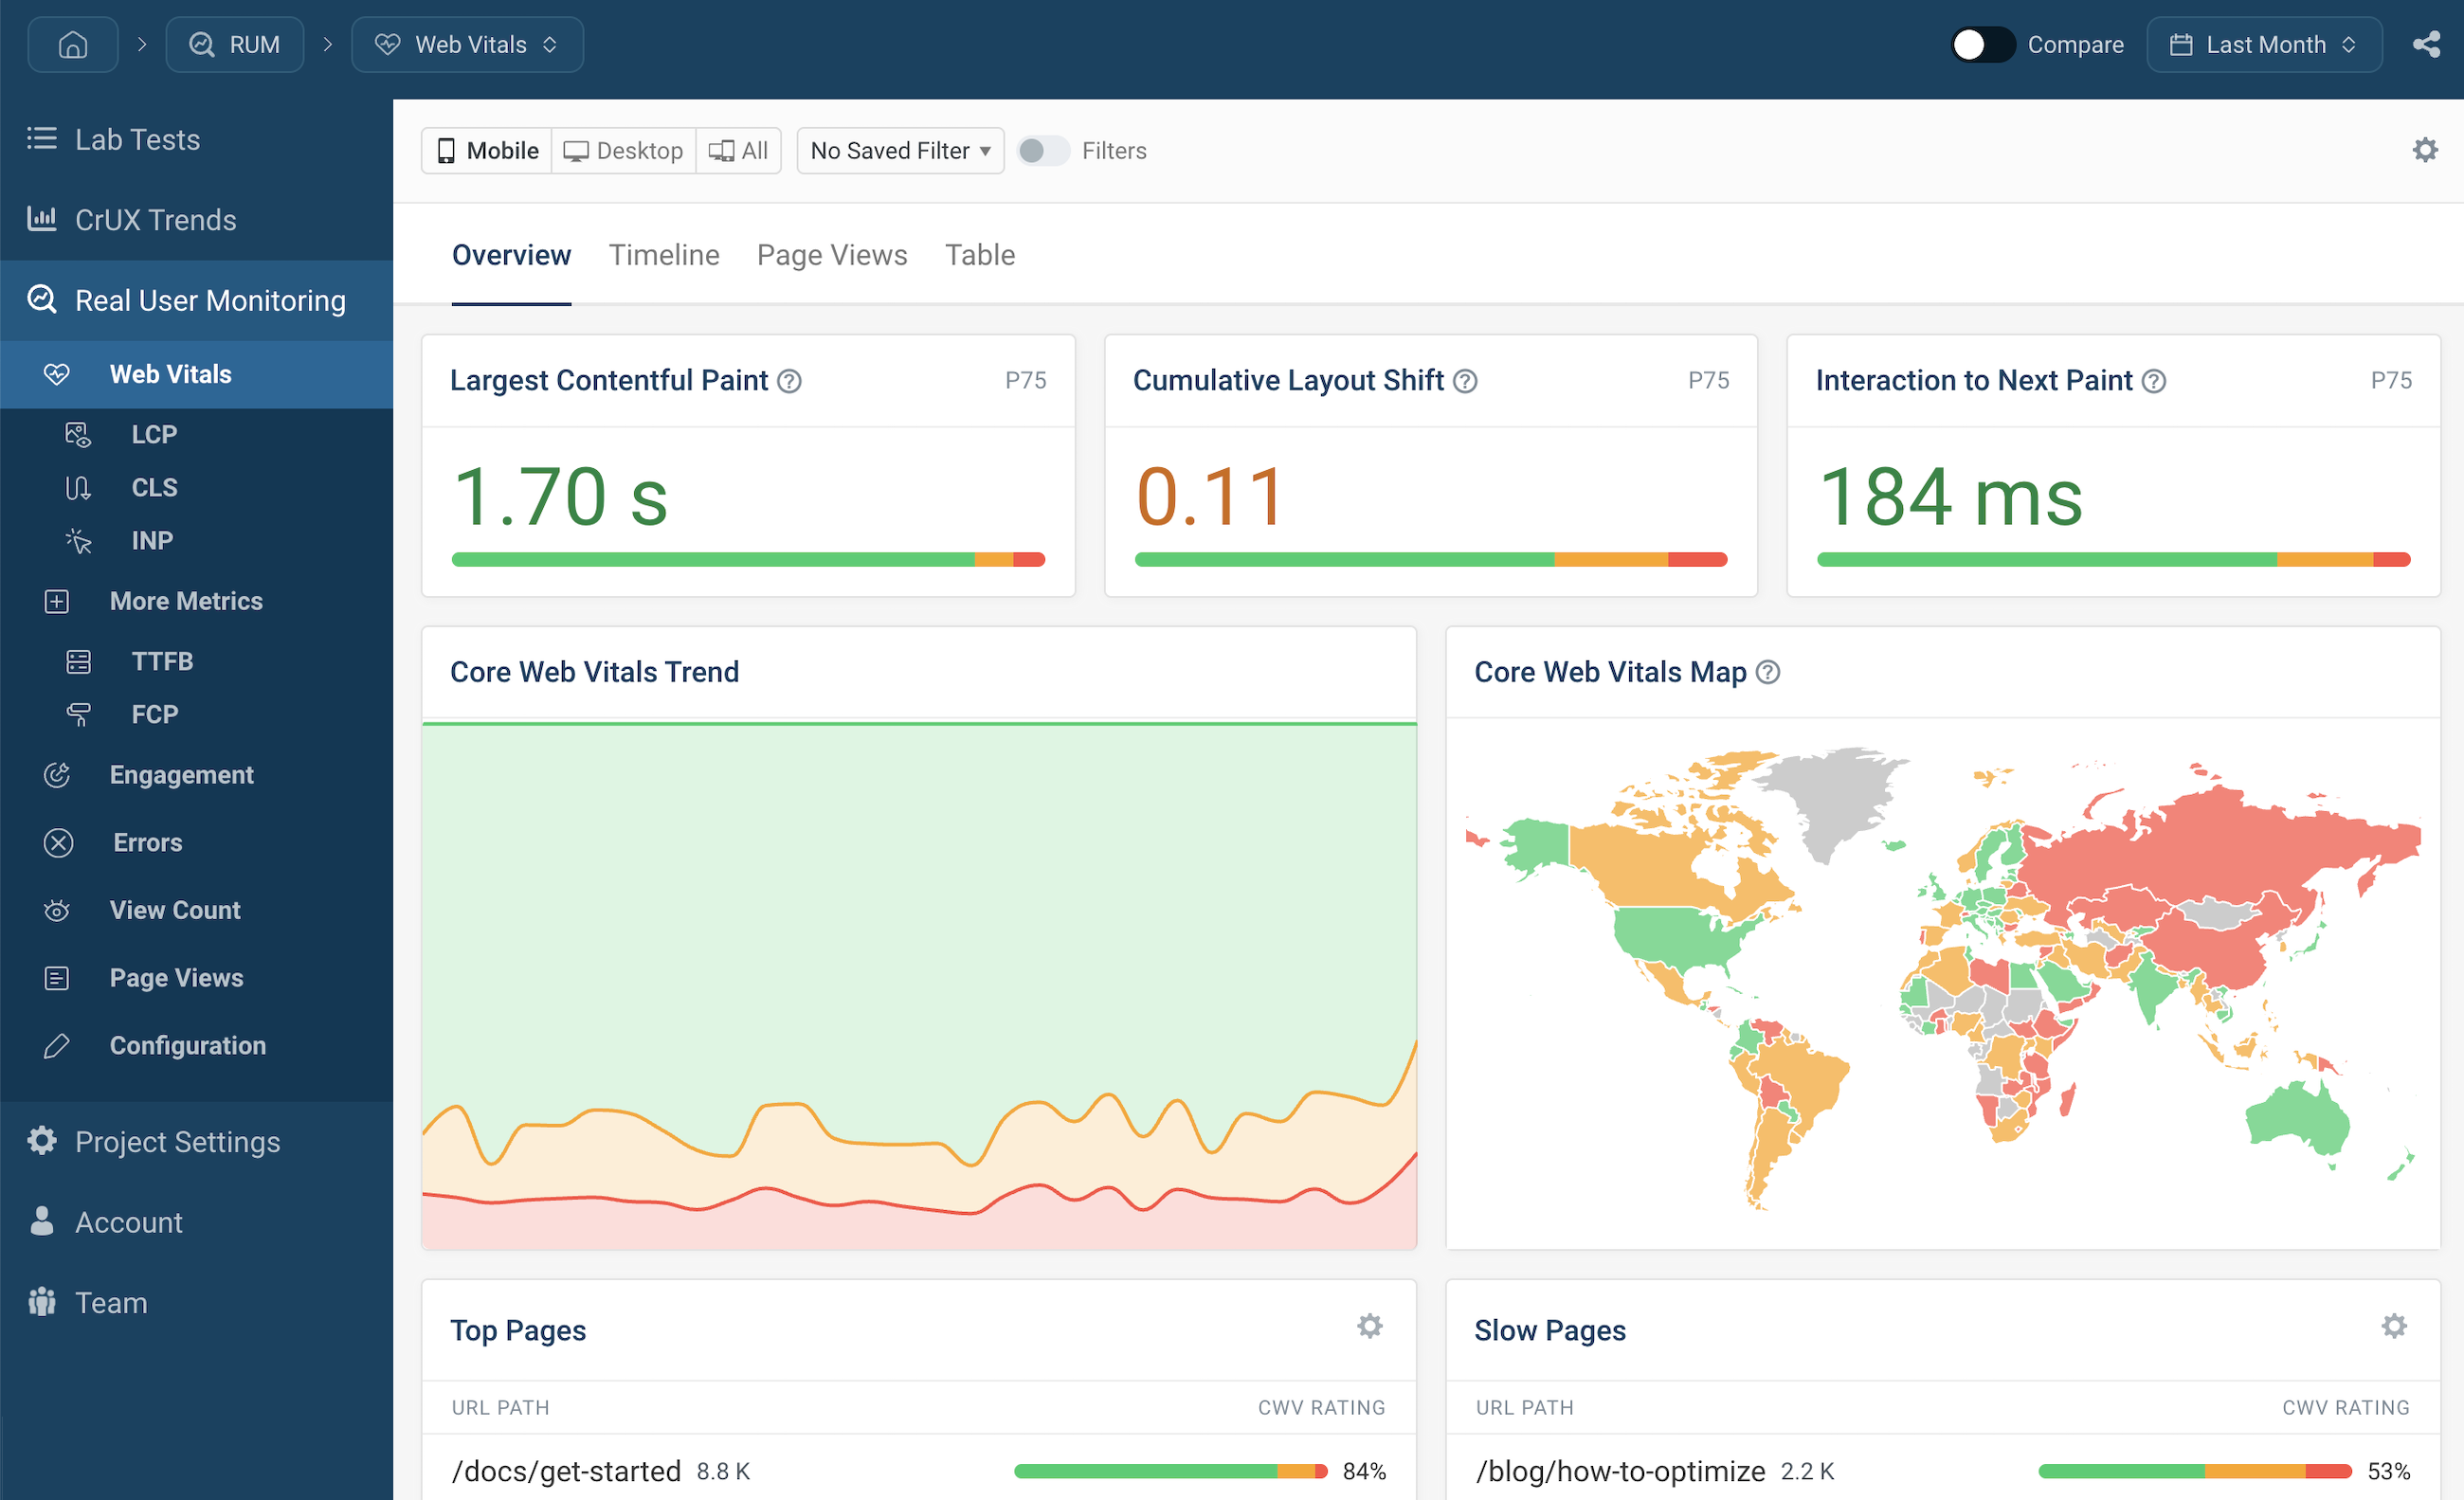
Track website performance with Real User Monitoring (RUM)
Get targeted insights to optimize your website
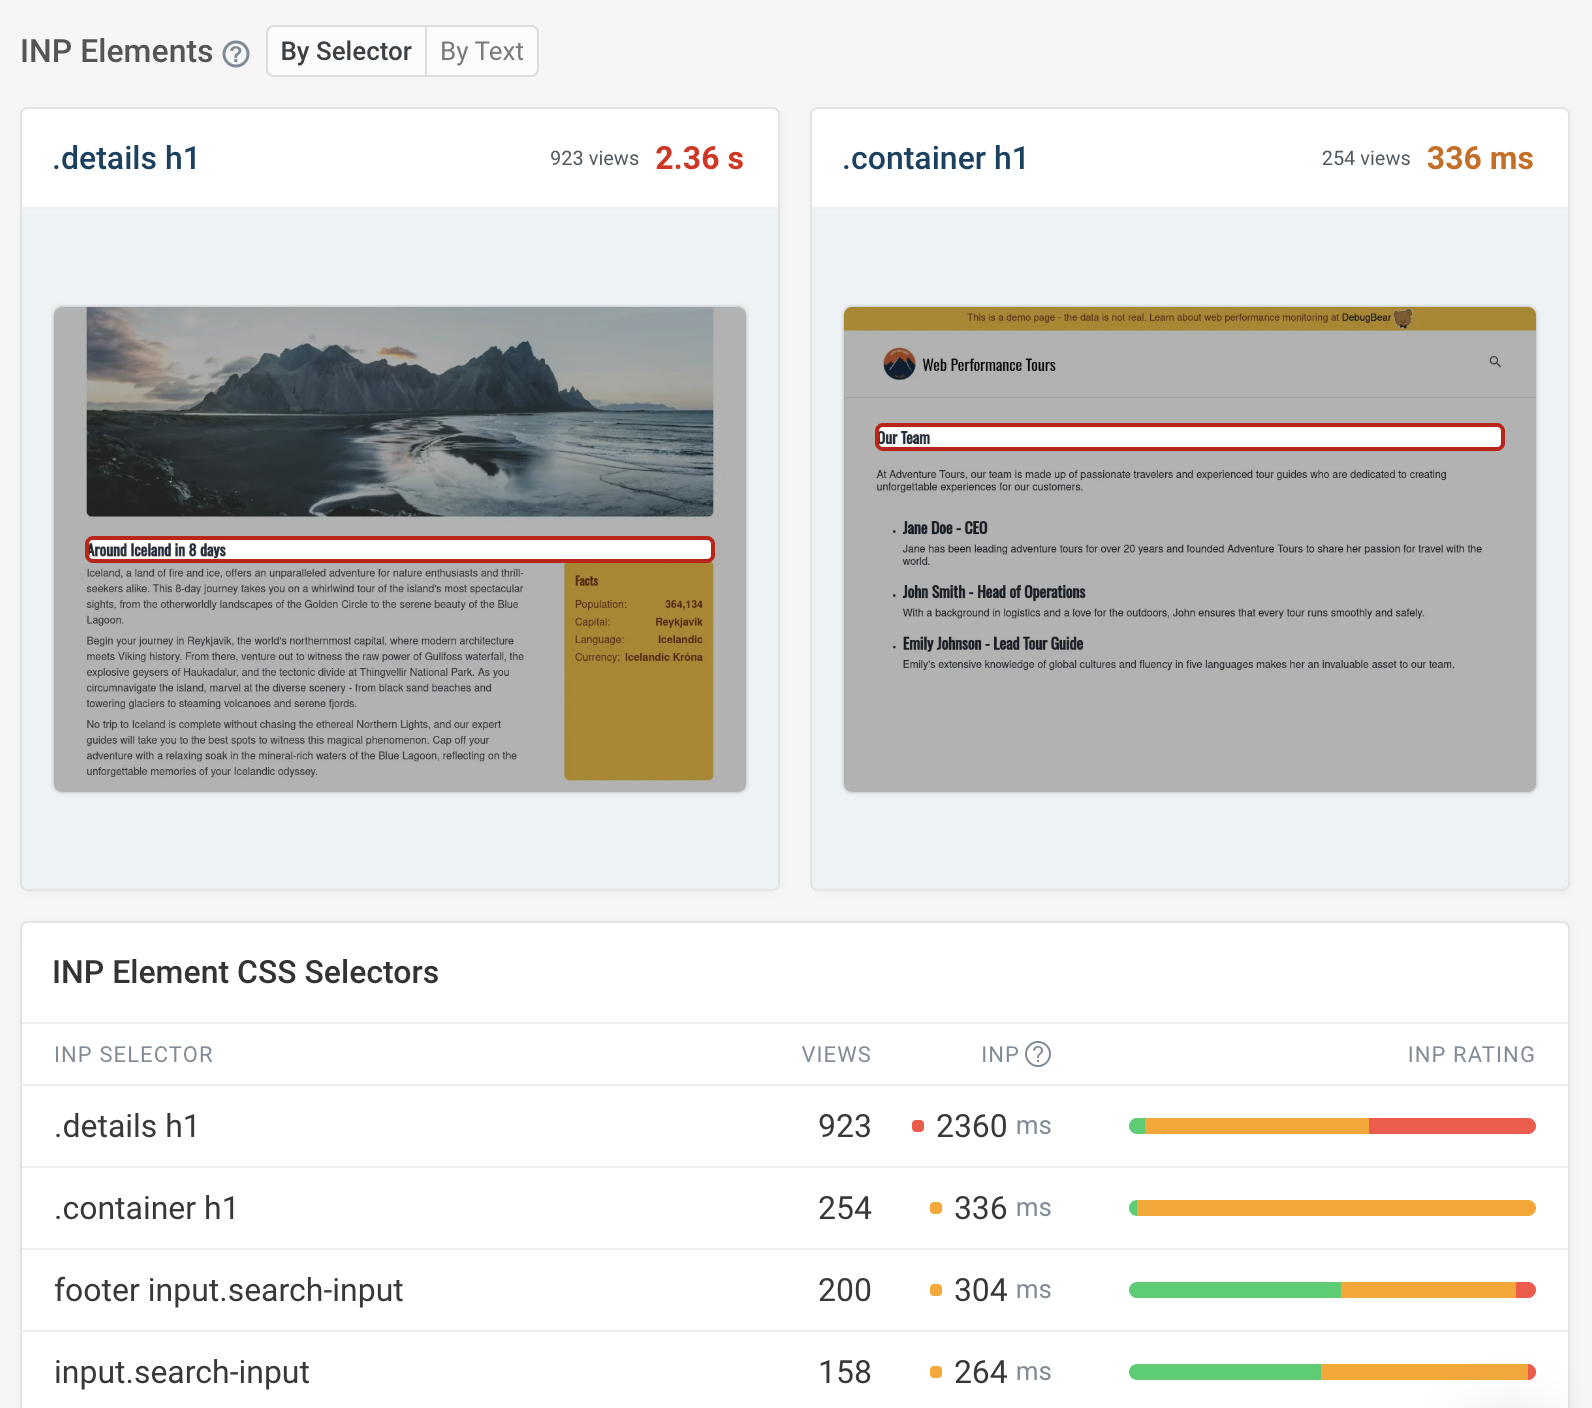
Improve Interaction to Next Paint (INP)
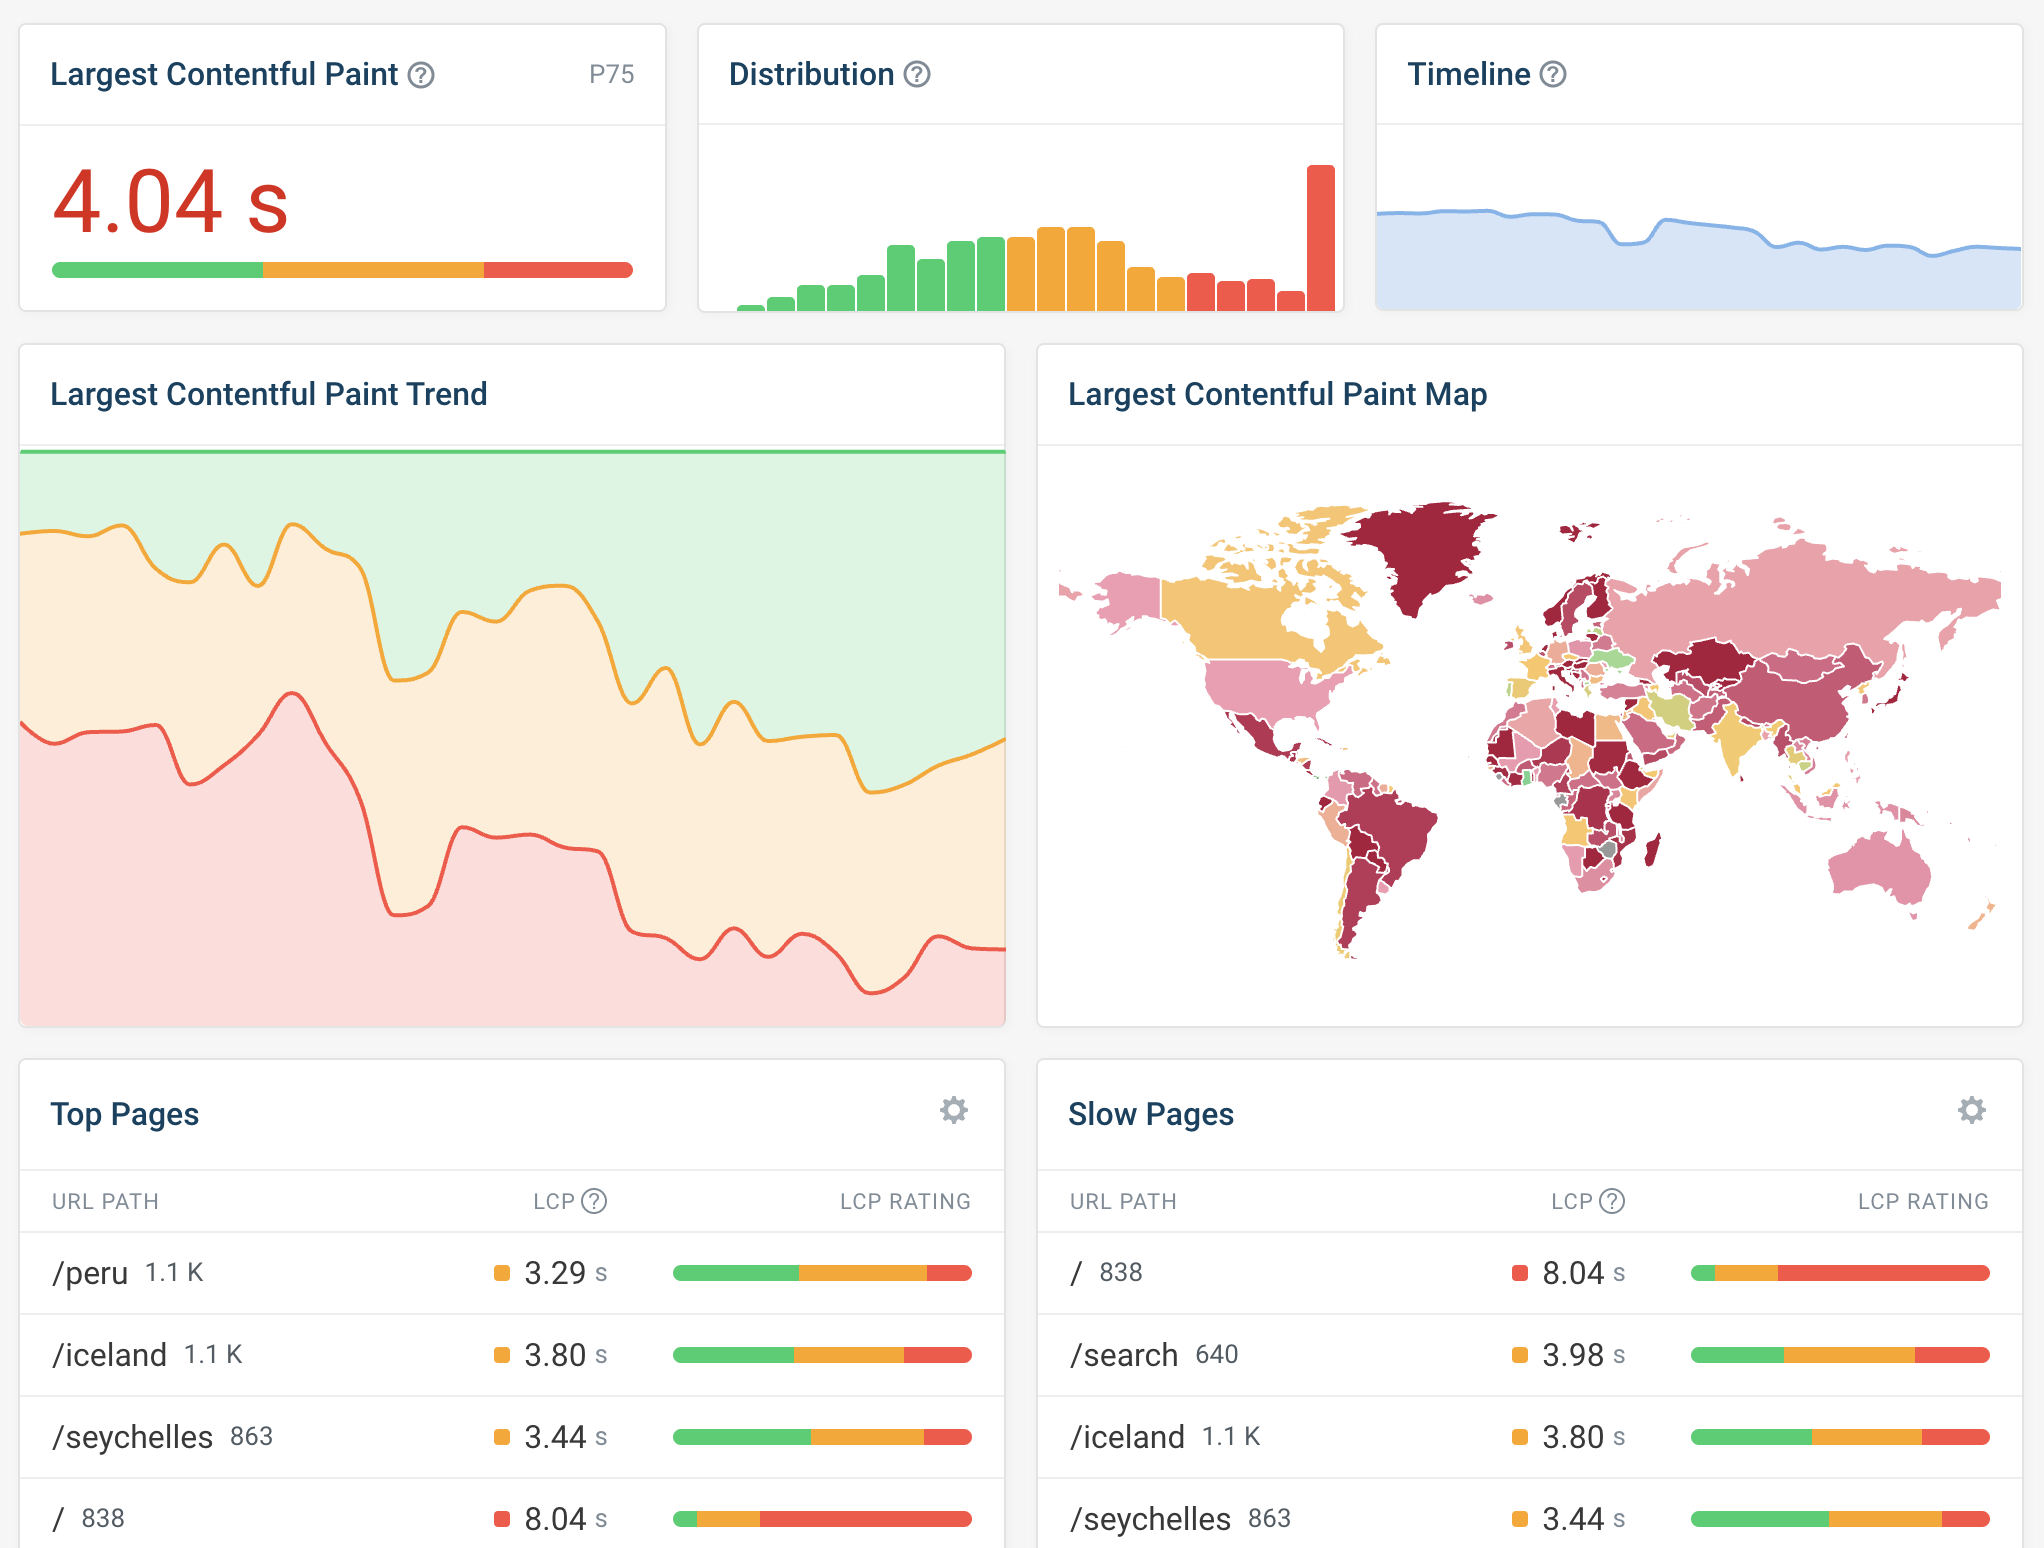
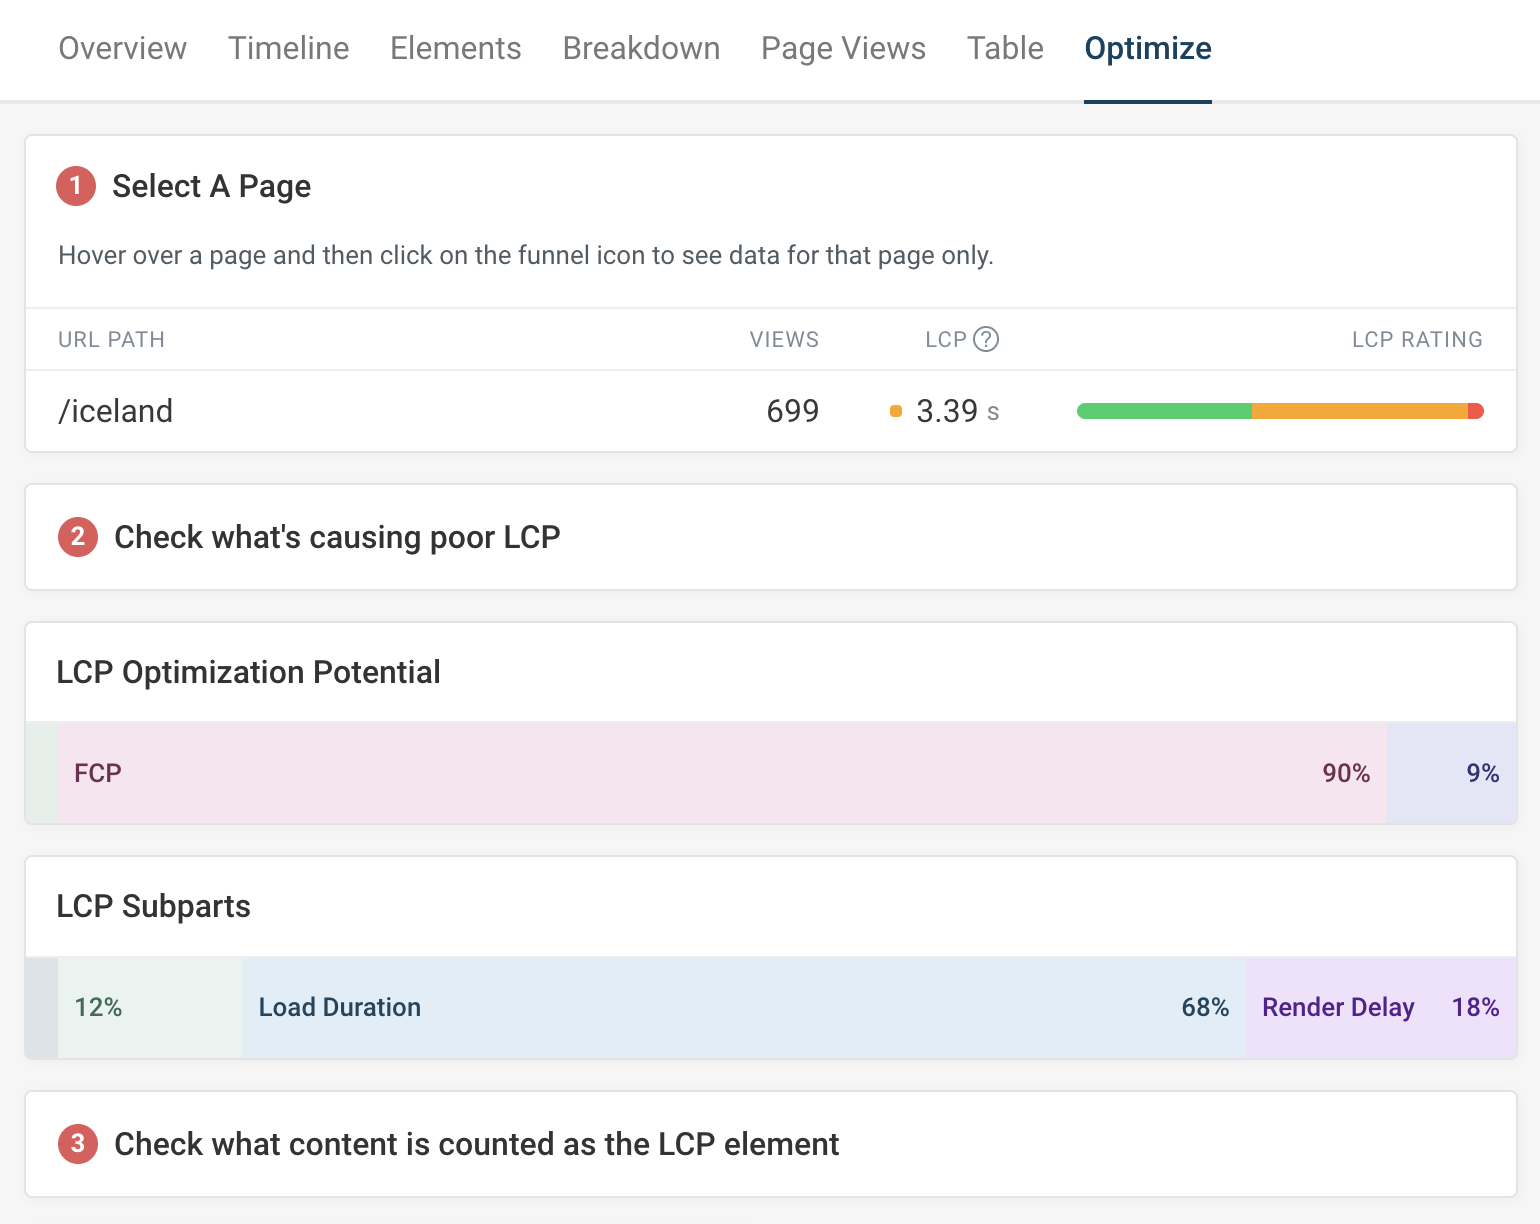
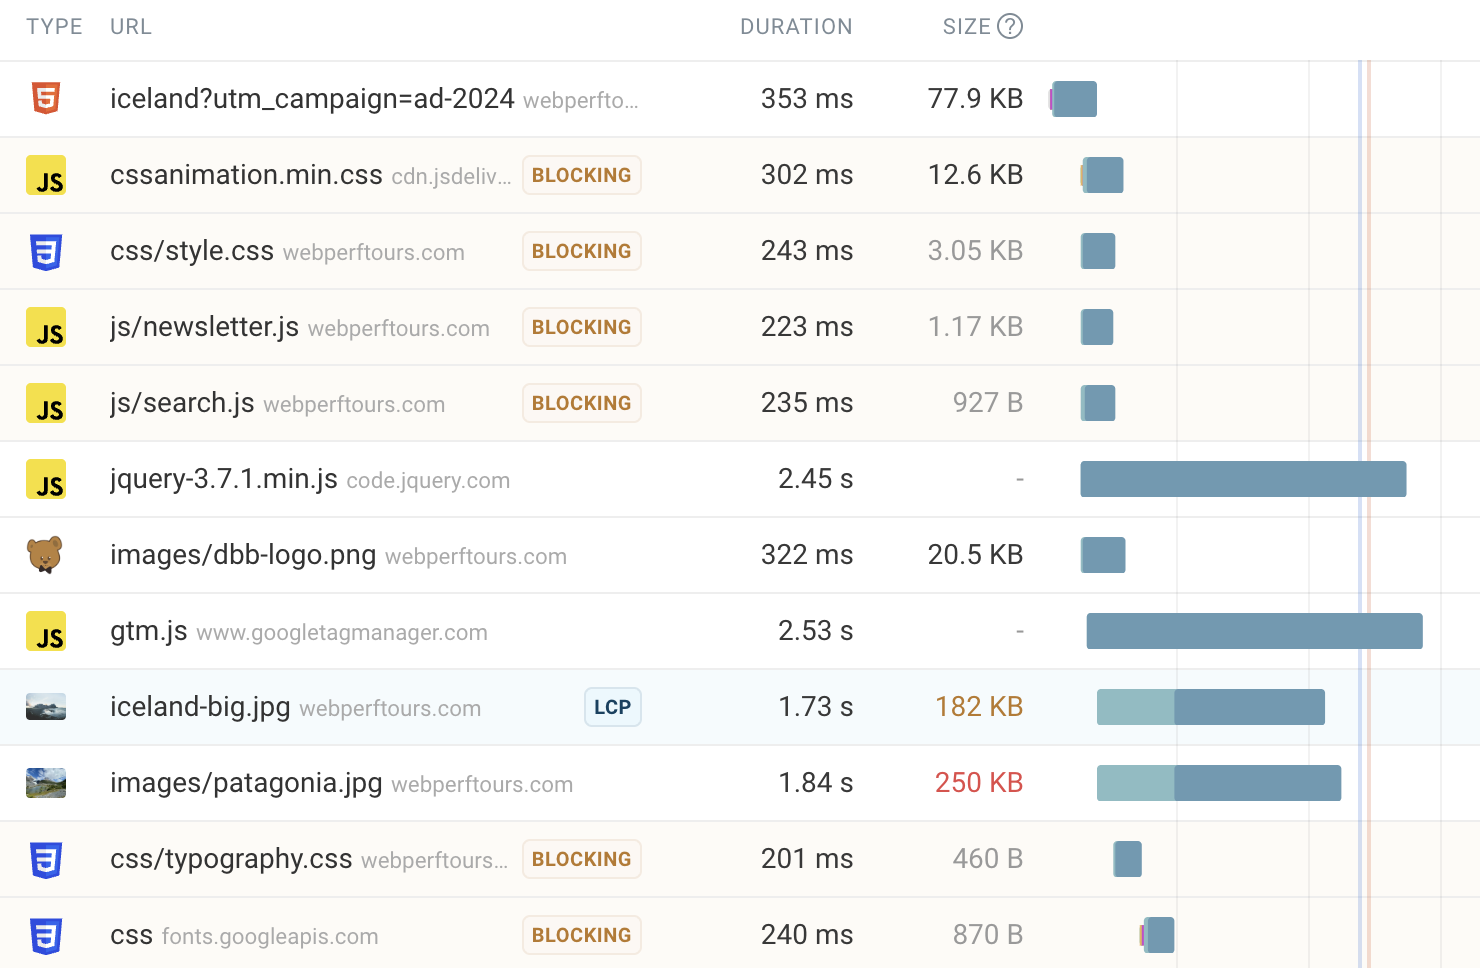
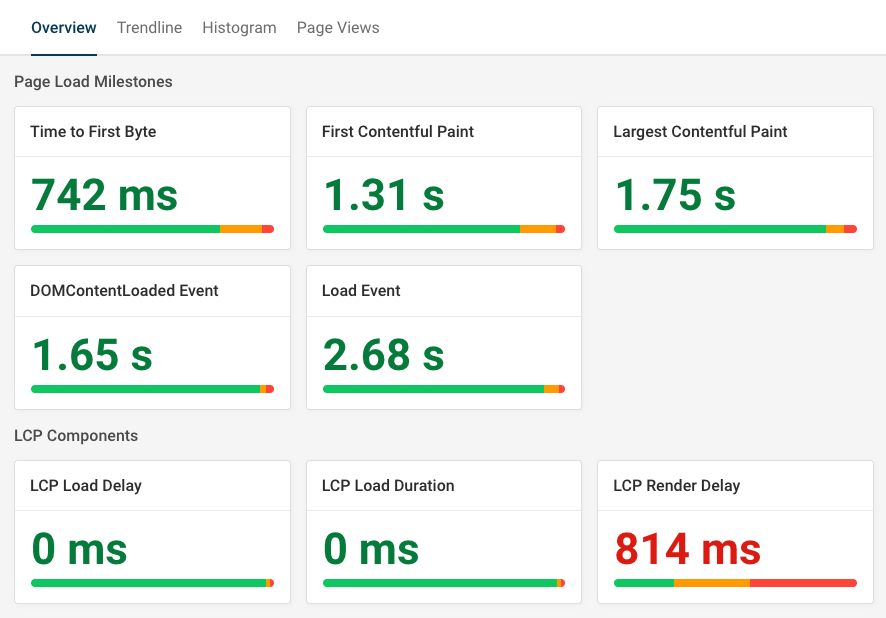
Improve Largest Contentful Paint (LCP)
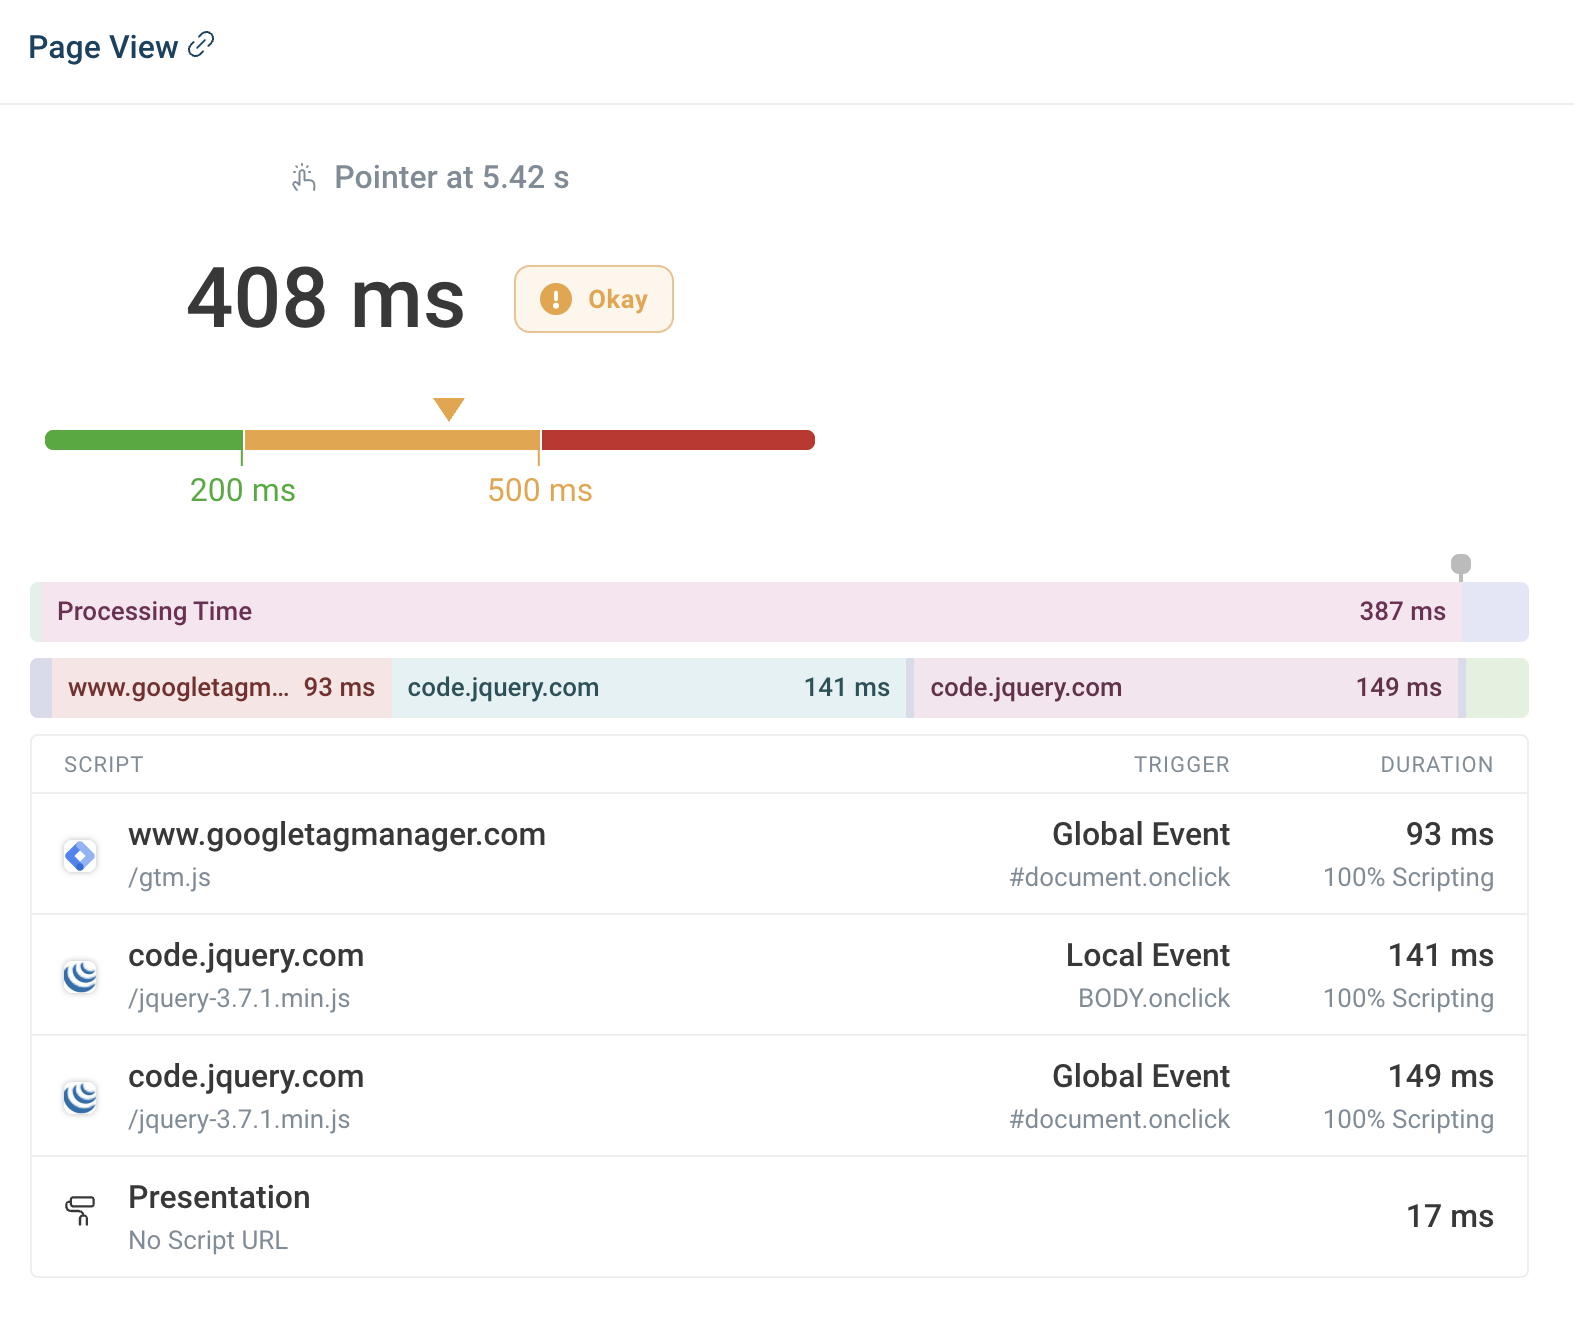
Analyze slow CPU tasks
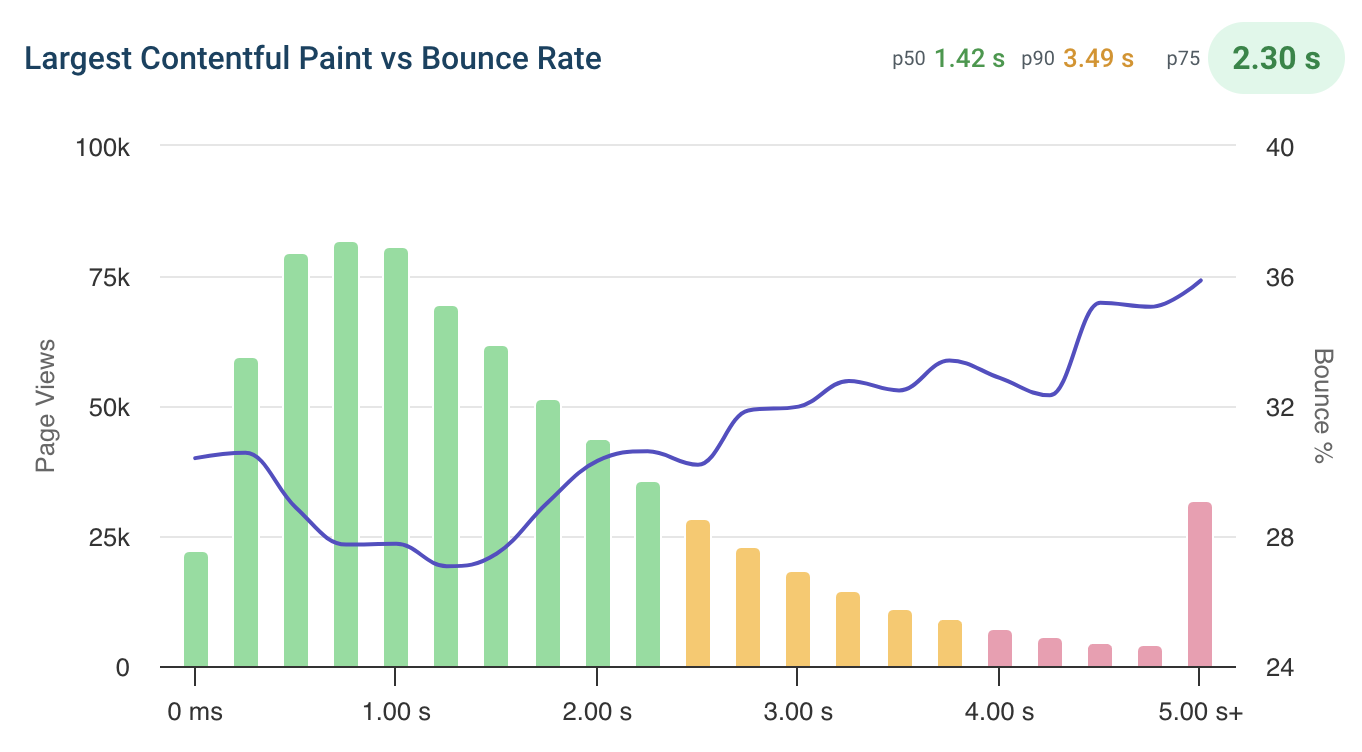
Correlate page speed with user behavior
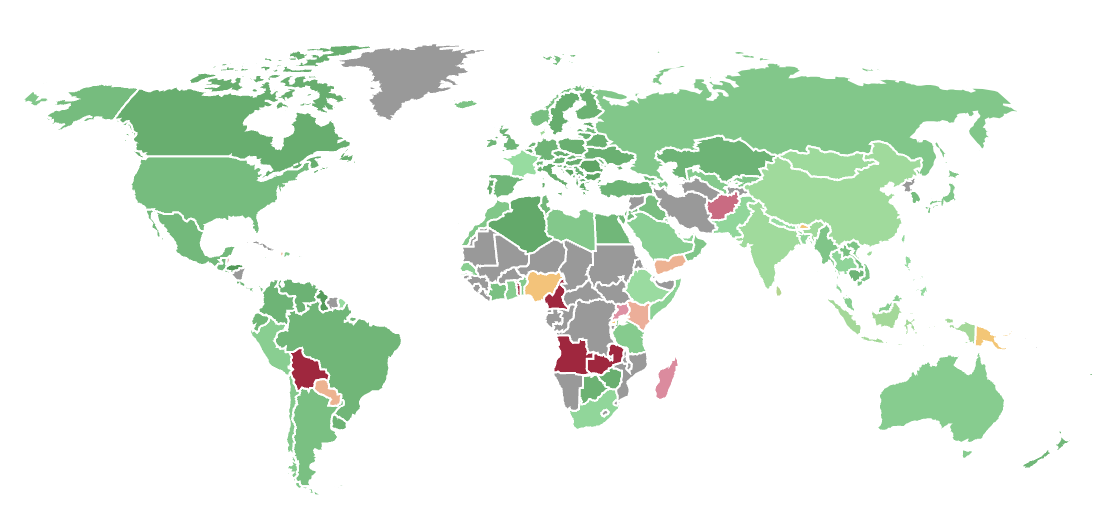
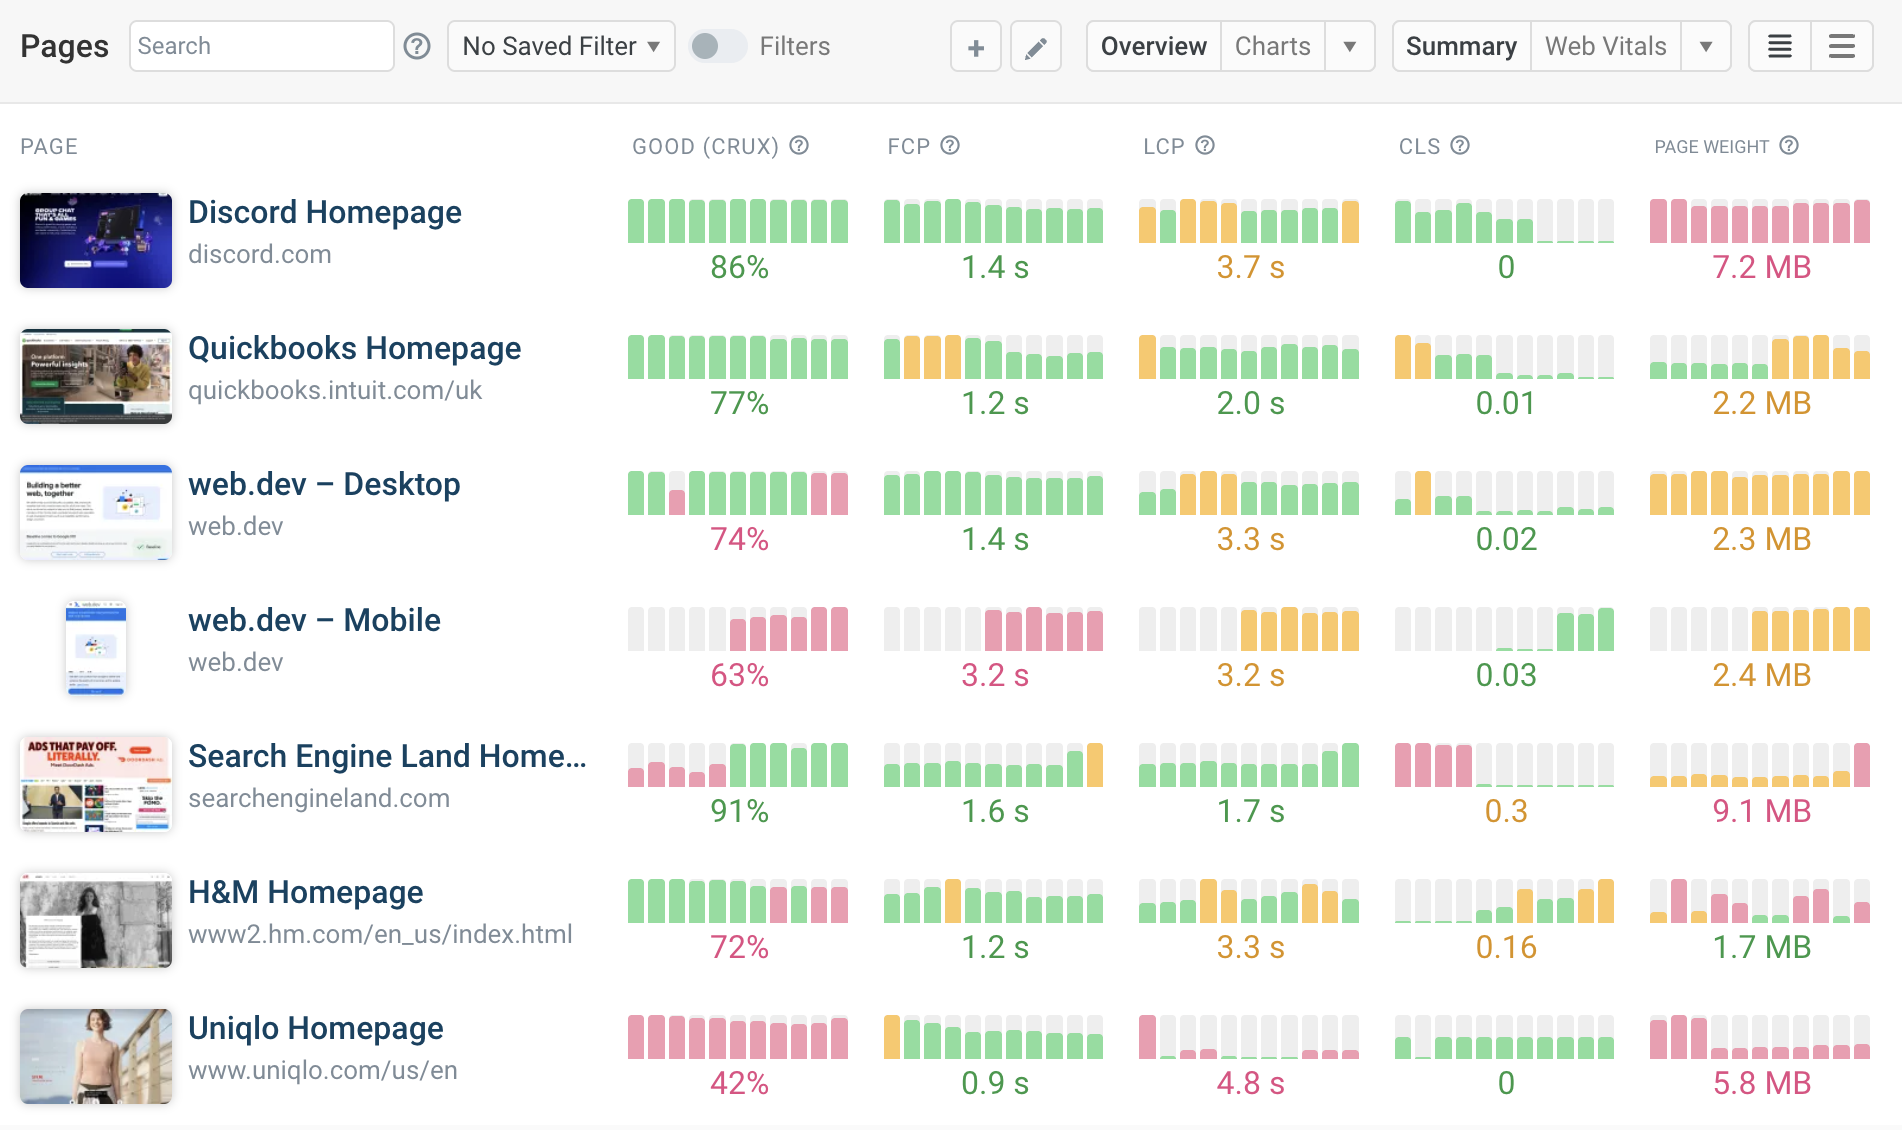
See how fast your site is for users across the world
More metrics for debugging
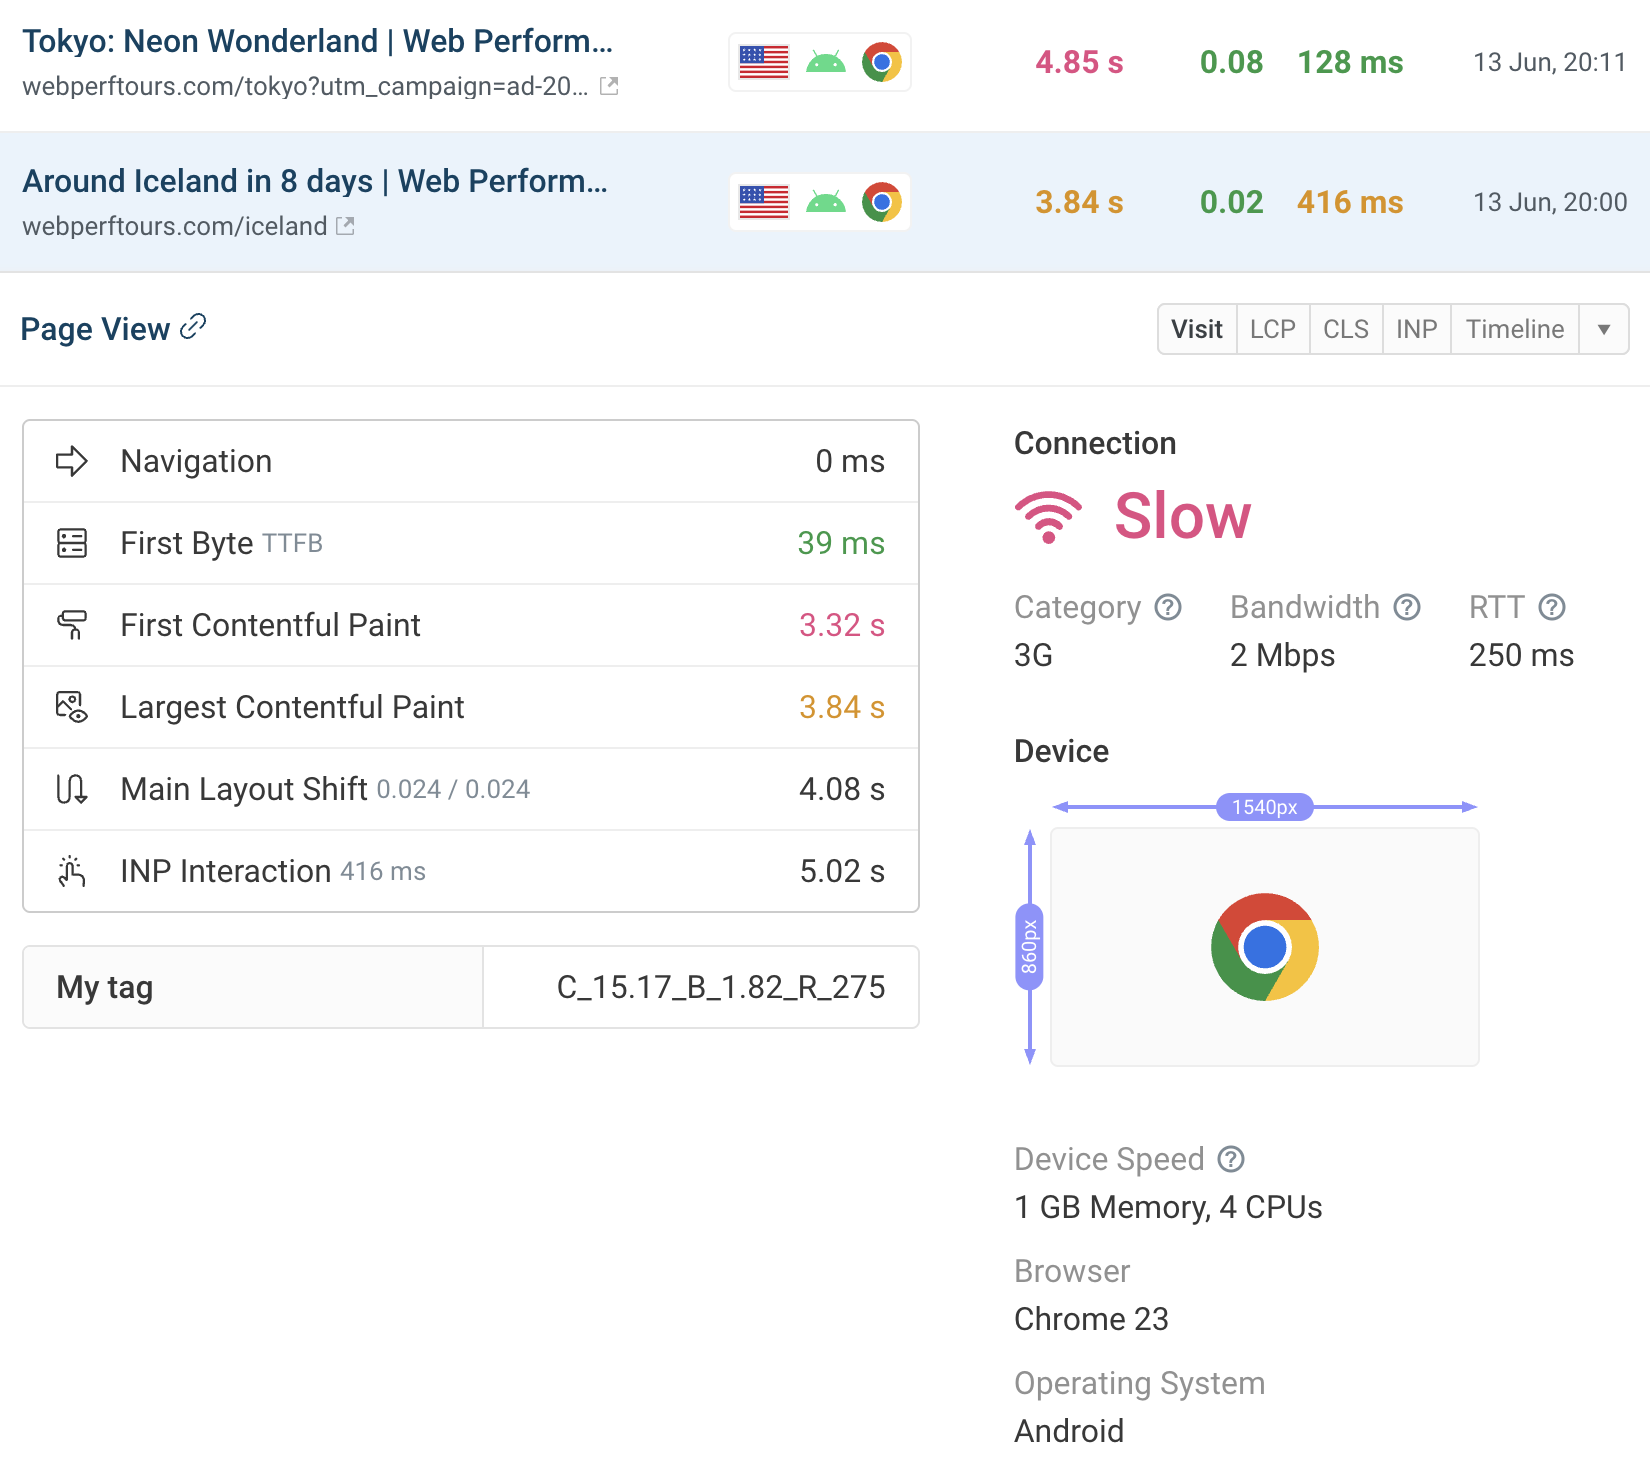
Review specific user experiences
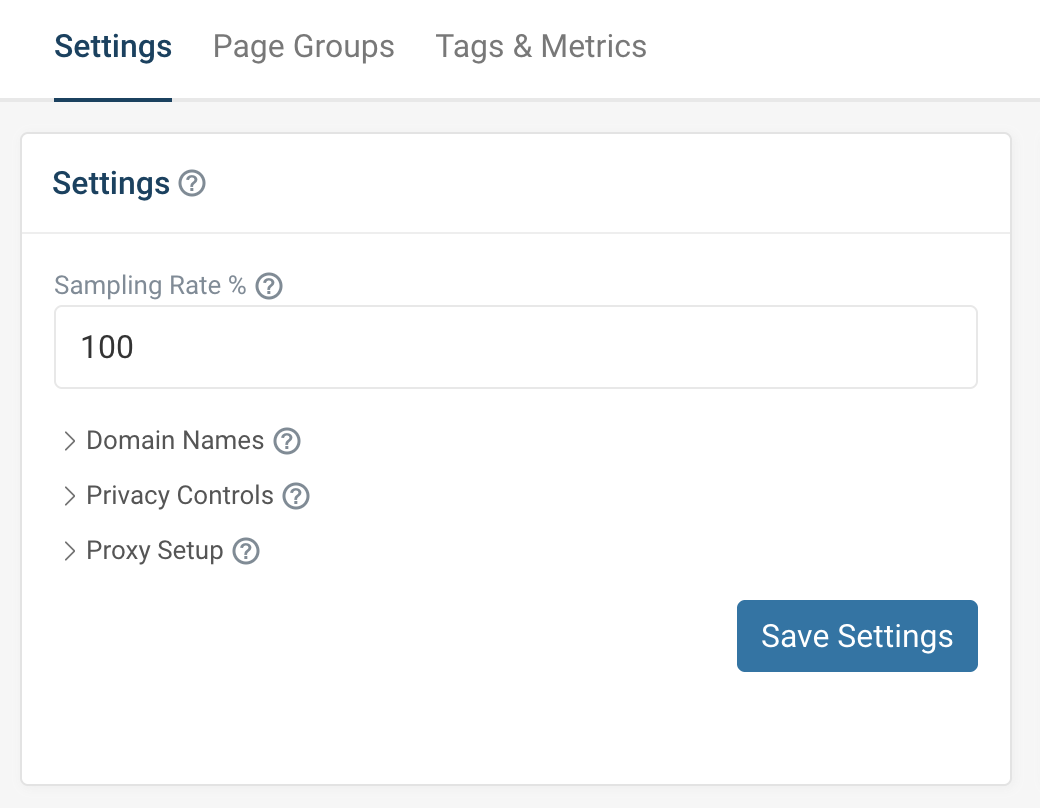
Advanced configuration
Complement RUM with lab-based tests and CrUX data
You are using an old browser that is not supported anymore. You can continue using the site, but some things might not work as expected.