Memory leaks can hurt the performance of your website and even crash your page, especially on mobile devices.
In this article we'll explain how to debug JavaScript memory issues and look at some common problems.
Visualize memory consumption with the performance profiler
The performance profiler in Chrome can visualize memory usage and graph it over time. To try this out, open the DevTools in Chrome and switch to the Performance tab.
Note that we use an Incognito window when measuring performance. If we do this in a normal window the measurement data would include all browser extensions, making it harder to identify issues caused by our own code.
Make sure to check the Memory checkbox.
Let's take this code snippet as an example:
<button id="grow">Click me</button>
<button id="remove">Remove me</button>
<script>
var x = [];

function grow() {
  for (var i = 0; i < 10000; i++) {
    document.body.appendChild(document.createElement("div"));
  }
  x.push(new Array(1000000).join("x"));
}

document.getElementById("grow").addEventListener("click", grow);
document.getElementById("remove").addEventListener("click", () => {
  window.x = null;
  document.body.innerHTML = "yep";
});
</script>
This will create a UI with two buttons:

Every time we click the "click me" button the script appends 10,000 nodes to the DOM and pushes a string consisting of a million x characters onto the array.
Navigate to the test page, open the DevTools performance tab, and hit the red Record icon.
Click the garbage collection button (trash icon) to force a garbage collection. This way we ensure that anything that can be cleaned up is cleaned up by the JavaScript engine, rather than being cleaned up later and confusing our results.
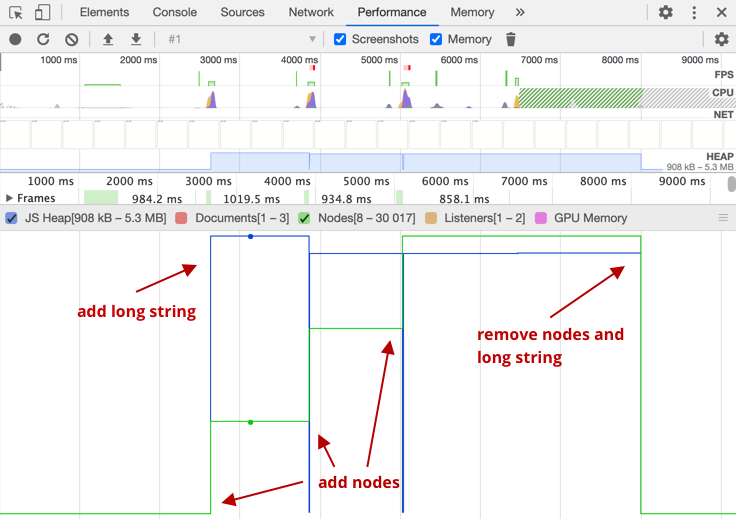
Next, we click the button on our page several times and wait 2-3 seconds after each click. The result looks like this:
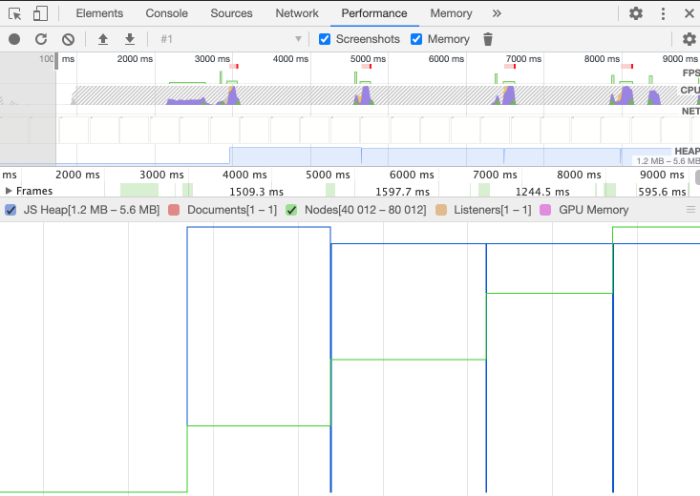
We see that the green graph is rising after every click, as more nodes are added to the DOM.
The blue line represents the JS heap. It rises after the first click, but not after that. That's because we always push the same string onto the array, and storing the same string twice doesn't take any additional memory.
Clicking the Remove button clears up the array and removes the divs from the DOM. Memory consumption on the page returns to normal:
Identify detached DOM nodes with the Heap Snapshot
The garbage collectors of modern browsers will free up memory if a DOM node is no longer referenced, either by the DOM tree or by JavaScript code.
Detached DOM nodes are nodes that are removed from the page but are still referenced by JavaScript. The garbage collector cannot remove them and they stay in memory.
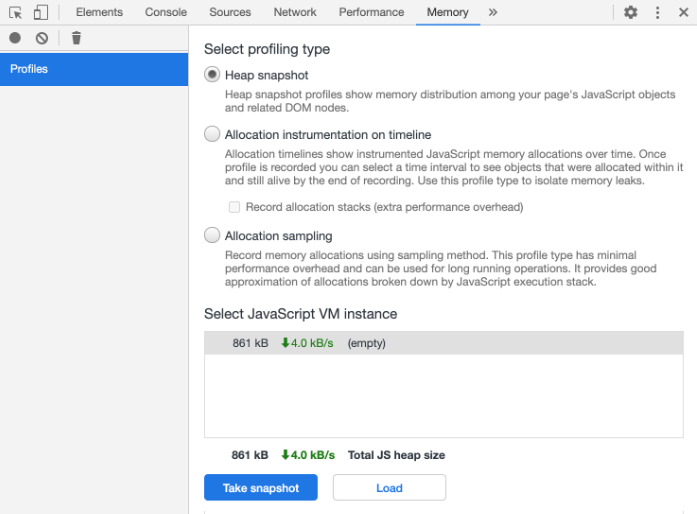
We can use a Heap Snapshot to detect them. To do this, switch to the Memory tab in Chrome DevTools
In this example we have a list in the DOM, and assign the DOM element to a variable to change its styles.
<ul>
  <li>1</li>
  <li>2</li>
  <li>3</li>
</ul>
<button id="remove">Remove list</button>
<script>
var list = document.querySelector("ul")
list.style.background = "yellow"

document.getElementById("remove").addEventListener("click", () => {
  document.body.innerHTML = "Empty"
});
</script>
When we empty the page body, the DOM elements remain in memory as they are still referenced by the JavaScript code.
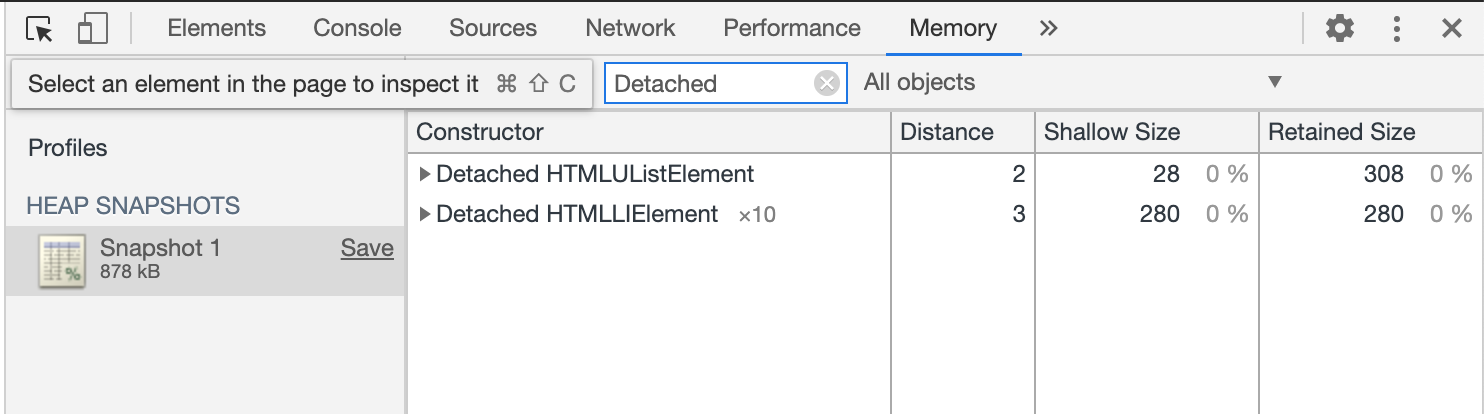
Load the page, click the Remove list button, then click Take Snapshot in the DevTools.
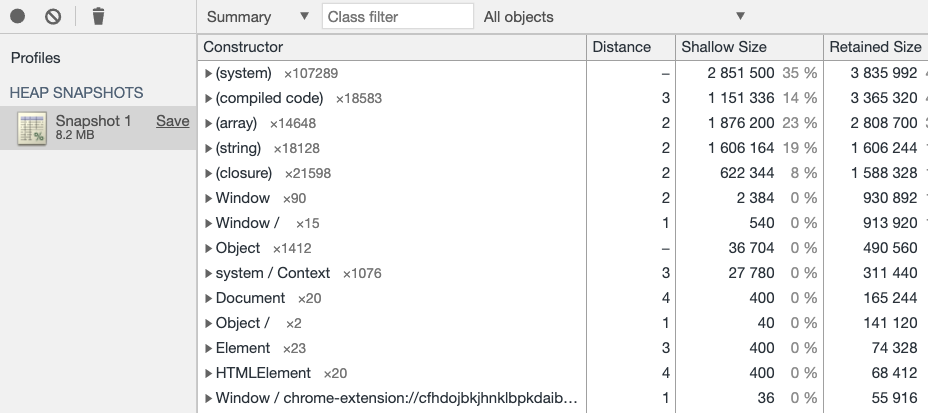
The snapshot contains a lot of detail about the Heap, but we only want to find detached nodes that are still being referenced by the heap.
We can find them by searching for "Detached" in the Class filter.
To fix this issue we can set list to undefined and let the garbage collector remove the unused nodes.
Other common JavaScript memory leaks
In-memory caching
We often use in-memory caching in JavaScript. A simple example is caching an API response in a JavaScript object for later usage.
This approach can have adverse effects on application performance, more precisely on memory usage. If we save large responses and never remove them, memory usage grows over time, even if we aren't using the responses.
In this case, we recommend using an LRU cache to minimize the memory footprint of old cached responses. LRU stands for Least Recently Used.
The central part for us is that it limits the amount of data it stores. We define a size limit, and as soon as we reach it, the list deletes the least recently used item from the list.
const LRU = require("lru-cache");

const cache = new LRU({
  max: 150,
});
cache.set("something", {});
cache.get("something");
Internally the LRU cache uses a doubly linked list, and reads and writes still have a complexity of O(1) using Big O notation.
Big O notation describes how fast our algorithm is. O(1) means that no matter how much data we have, the algorithm will execute in constant time. O(n) would be time proportional to the amount of data.
Uncleared timers
setTimeout and setInterval are useful for doing tasks regularly or after a specific time. But we need to make sure to remove them when a component is removed, as their handlers can otherwise continue to be called and keep values in memory.
When you remove a component, use clearTimeout and clearInterval to clean up timers.
Monitor web performance over time
When working on web performance issues, monitoring site speed over time can alert you to new problems as well as see the impact of your optimizations.
DebugBear is a site speed monitoring tool that provides an in-depth report to help you speed up your website.


Monitor Page Speed & Core Web Vitals
DebugBear monitoring includes:
- In-depth Page Speed Reports
- Automated Recommendations
- Real User Analytics Data