
Nobody I know purposely designs a slow website. I have never found a person yet who said, “I like your website, but I wish it was just a little slower.”
Poor website speed can be a major roadblock to success. It impacts everything from the end user experience to search engine rankings. It definitely has financial costs. This is now pretty much common knowledge, yet it's still easy to find slow websites everywhere.
In this blog, I want to guide you through practical steps to diagnose and fix my own slow website. I will show you how I used insights from DebugBear to find and solve the performance issues fast with just a few tweaks and very few changes to the actual site itself.
Why is my website so slow?
I had a simple Wordpress website that had only two pages - the main page with a few images and a blog page. It was originally a static website (meaning a snapshot of the Wordpress site with only HTML, CSS, and Images) that was hosted on Cloudflare Pages.
I was getting ready to add a WooCommerce shopping cart to it, so I converted it to a basic Wordpress site with the Divi theme. Once I moved everything over, I noticed it was taking a fairly long time to load.
Running my site through DebugBear's free website speed test confirmed that it took a while to load even on a fairly fast internet connection.
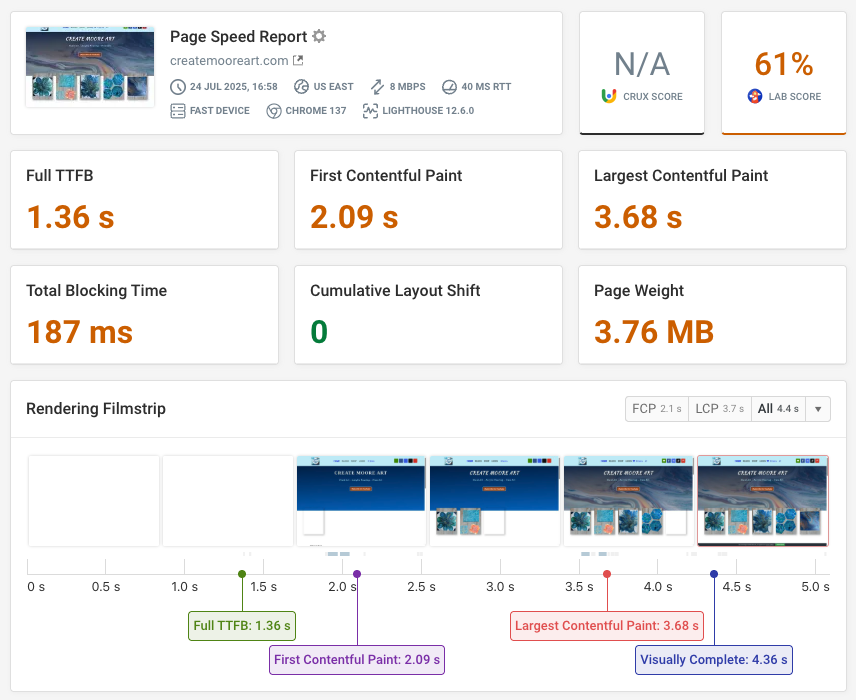
Once I looked at the site information, it was pretty easy to see what was going on. The Largest Contentful Paint (LCP) for desktop users was 3.7 seconds, and for mobile users the page load time was as high as 12 seconds.
The Time to First Byte (TTFB) metric, which measures how quickly the server responds to the HTML document request, was also poor at 1.36 seconds. As a result, almost two seconds passed before anything even began to appear on the screen. This slow initial response would be a major turn-off for visitors.
These days, you don't have the luxury of page rendering delays. Mobile users are not going to wait 12 seconds to see something. They will go somewhere else.
The video recording of a synthetic test run in DebugBear confirmed the problem, showing a noticeable delay before the images and content fully rendered on the page. This meant we had some work to do to make this better.
I used DebugBear's MP4 video export to show the loading speed at the start of this project:
Common causes of slow loading websites
There are several factors can cause a website to load slowly. Here are some of the most common issues I see:
- Unoptimized Images: If images aren't scaled properly or prioritized for display, they can significantly slow down the page loading. Even if you are using a modern compressed file type like webp or avif, if you do not size the image for the exact size you need, it can still cause an issue.
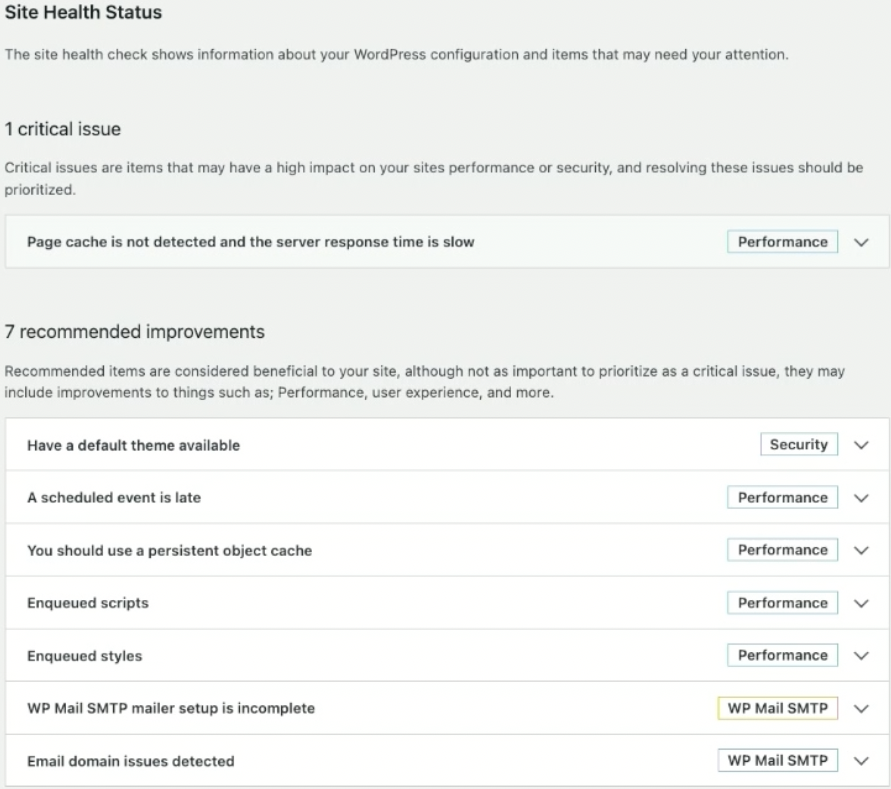
- Lack of Caching: Without proper caching, your server has to re-process and re-deliver the same content for every user request, leading to increased server response times. This was a major finding for my site, as the site health score revealed that page caching was not detected and the server response time was slow.
- Slow Server-Side Processing: Dynamic websites (like WordPress) involve server-side languages (PHP) and database queries (MySQL). If these processes aren't optimized, they can introduce significant delays before the browser even receives the first byte of data.
- No Content Delivery Network (CDN): A CDN distributes copies of your website's static content (like images, CSS, and JavaScript) to servers worldwide, reducing the physical distance data has to travel to reach a user. Without a CDN, users far from your hosting server will experience longer load times due to network latency.
- Inefficient Code and Scripts: Unoptimized JavaScript or CSS can block the rendering of your page, leading to a higher Total Blocking Time. Even though a visual builder like Divi makes development easier, it can introduce more JavaScript code that potentially impacts performance.
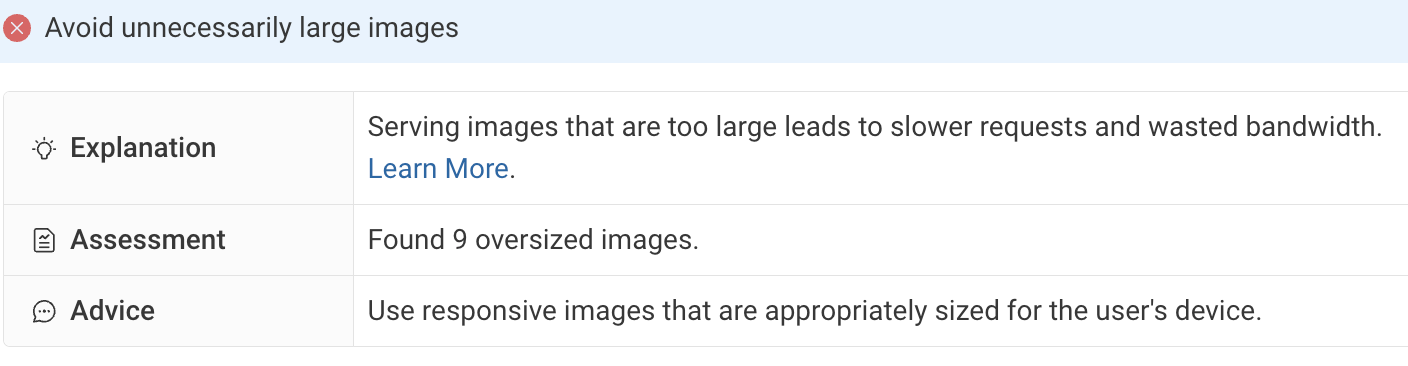
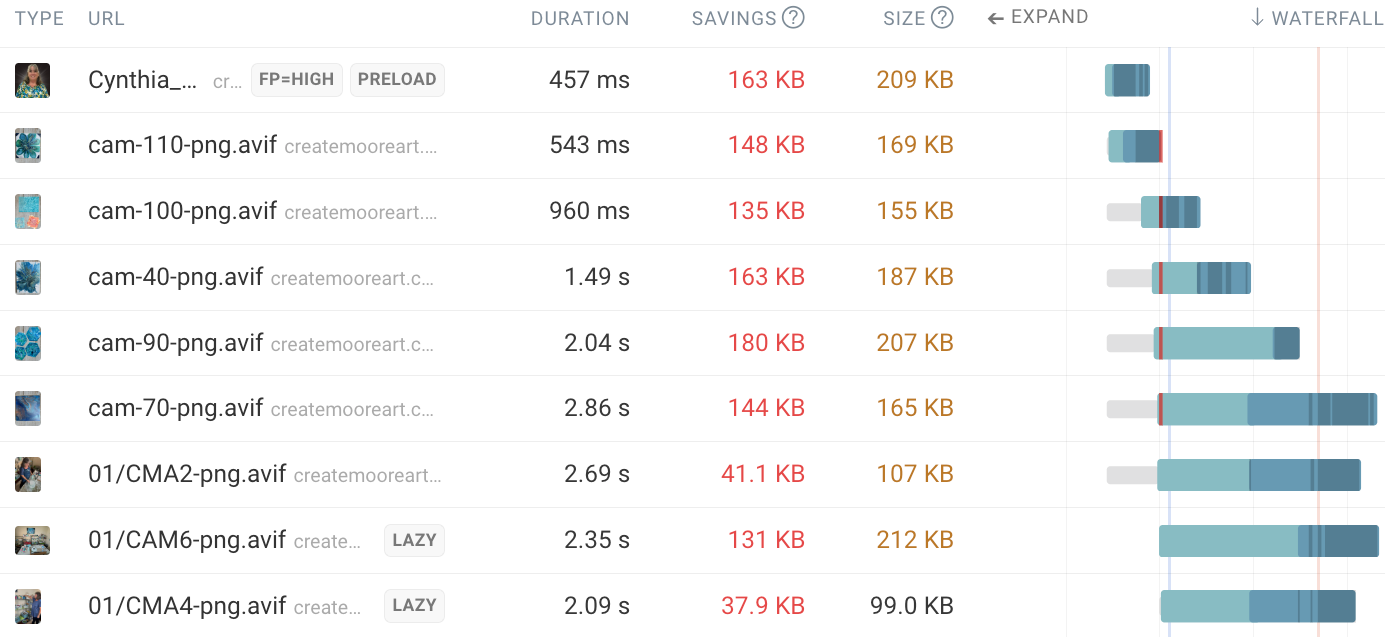
For example, my test results with DebugBear showed nine oversized images, even after attempting to use a compressed file format.
The waterfall for these images shows that many of them load before the Largest Contentful Paint milestone, as indicated by the red line. That means they compete for bandwidth with the main image at the top of the page.
Web performance advocates like me have been talking about these and other common problems for years, but they still tend to be overlooked by new website developers until users start to complain.
If you are in the process of rolling out your own site, understand that these issues are easily corrected, but you need a plan.
What I did to fix my slow website
The key to fixing a slow website is to identify the most impactful issues first. I call this strategy “fix the obvious and prioritize the changes”.
DebugBear is invaluable here as it not only highlights problems but also allows you to experiment with solutions before making live changes.
Using this strategy I identified the bottlenecks and worked my way down the list, starting with the most impactful change I could make. I started by addressing the initial connection time (TTFB) and then leveraged various caching mechanisms and a CDN.
Lowering Time To First Byte
Moving the site from a static generated site to Wordpress meant that I now had a single server that had to process all of the pages and talk to a database.
In order to get the browser to render the pages faster, I had to make sure that the Wordpress instance was as efficient as it could be. Taking load off of the web server allows it to process pages faster. I needed to be caching as much data as possible for assets that do not change often.
My hosting service (SiteGround) provided several ways to do this out of the box with some of their own suggested plugins, and server side configuration settings.
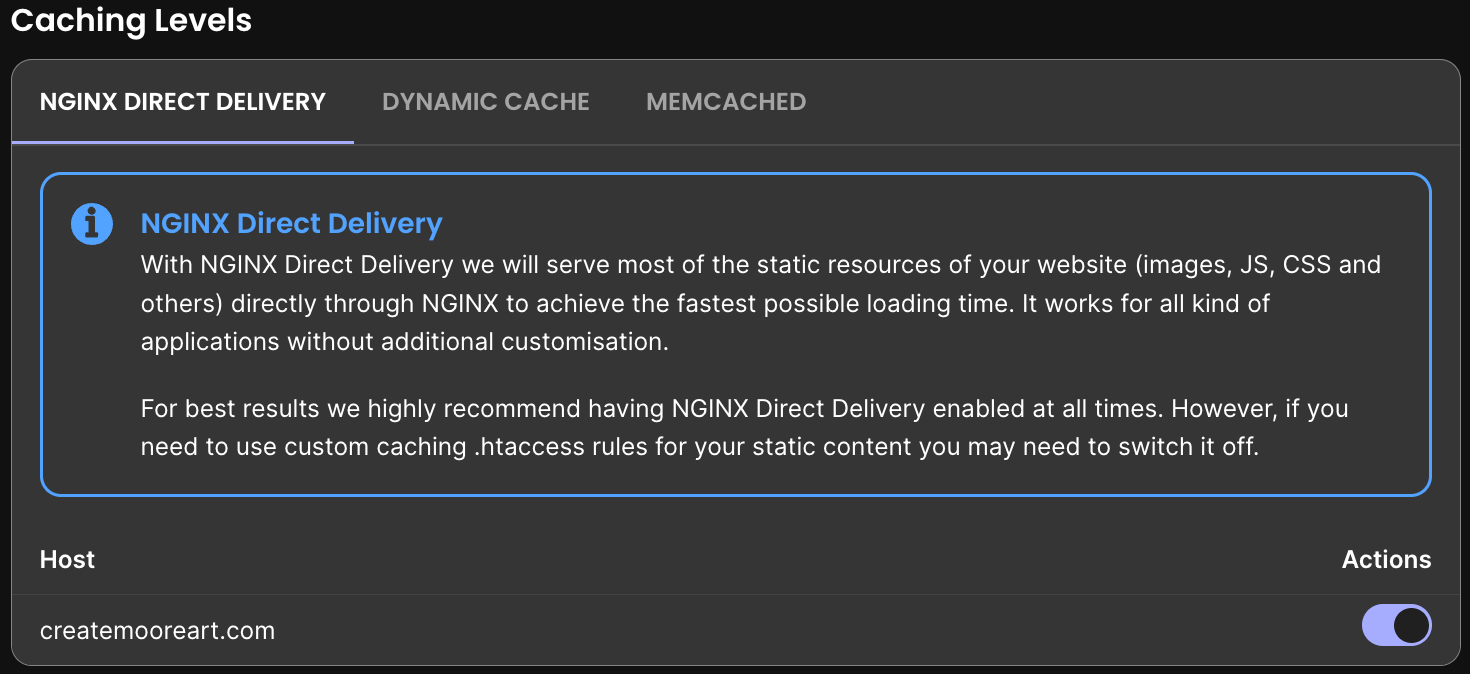
For example, the NGINX Direct Delivery option ensures that requests for static resources never reach my application code. That way my server spends less time serving stylesheets and images and can spend more resources on generating dynamic content.
Caching with the Speed Optimizer plugin
The most critical issue was the lack of caching. WordPress's site health report explicitly reported this as a critical issue:
Page cache is not detected and the server response time is slow
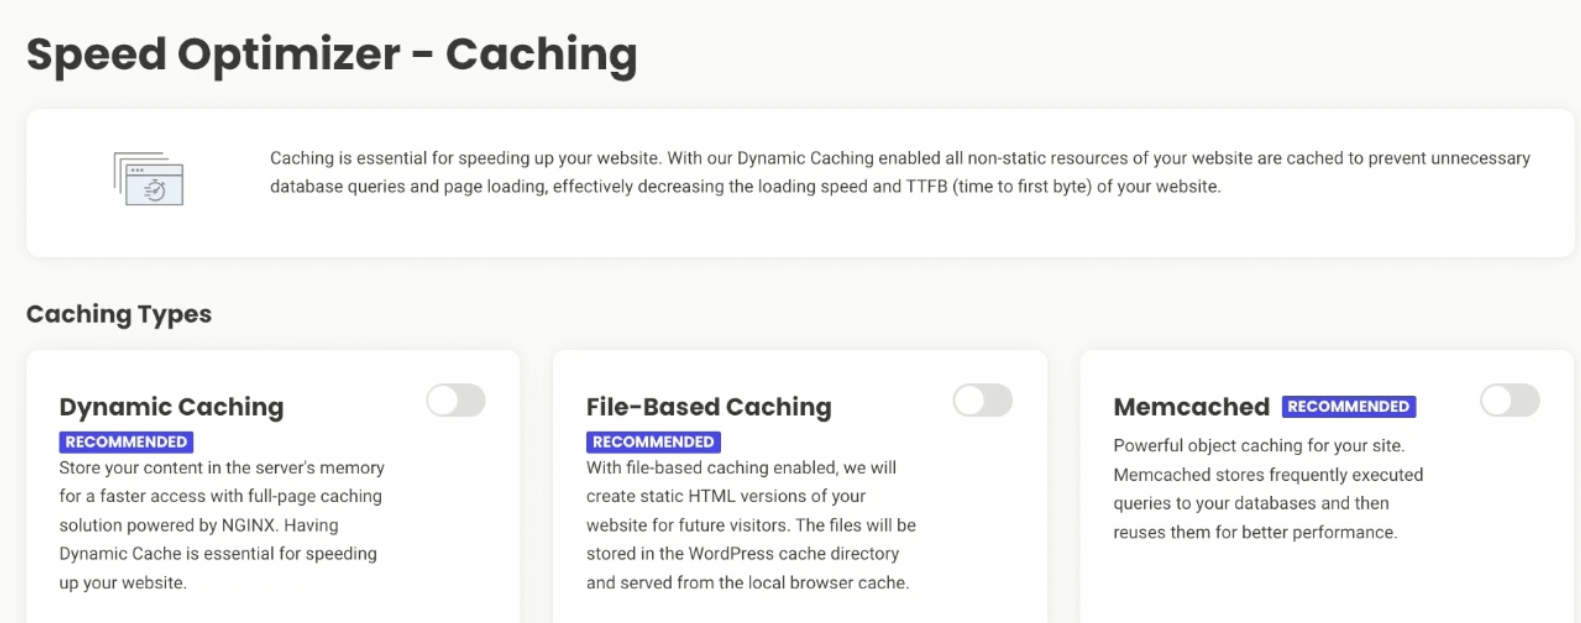
I used the SiteGround Speed Optimizer plugin to enable multiple types of caching:
- Dynamic Caching (Page Caching): This bypasses PHP and MySQL processing for static content, making pages available faster to anonymous users.
- Memcached (Persistent Object Caching): This makes the database more efficient by caching frequently used queries, reducing server processing. This also needed to be enabled directly in SiteGround's backend settings before activating it in the WordPress plugin.
- File-based Caching (Browser Caching): This instructs the user's browser to store static assets locally, so subsequent visits don't require re-downloading from the server. The fastest requests are the ones that you never have to actually make.
With the plugin installed, all you need to do to speed up your site is switch the relevant toggle for each of these settings.
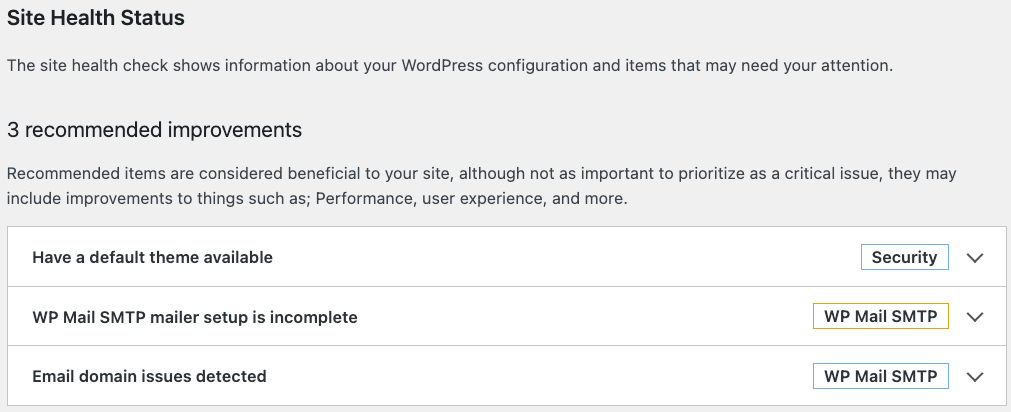
After enabling all three caching mechanisms, WordPress's Site Health reported that all performance recommendations were satisfied.
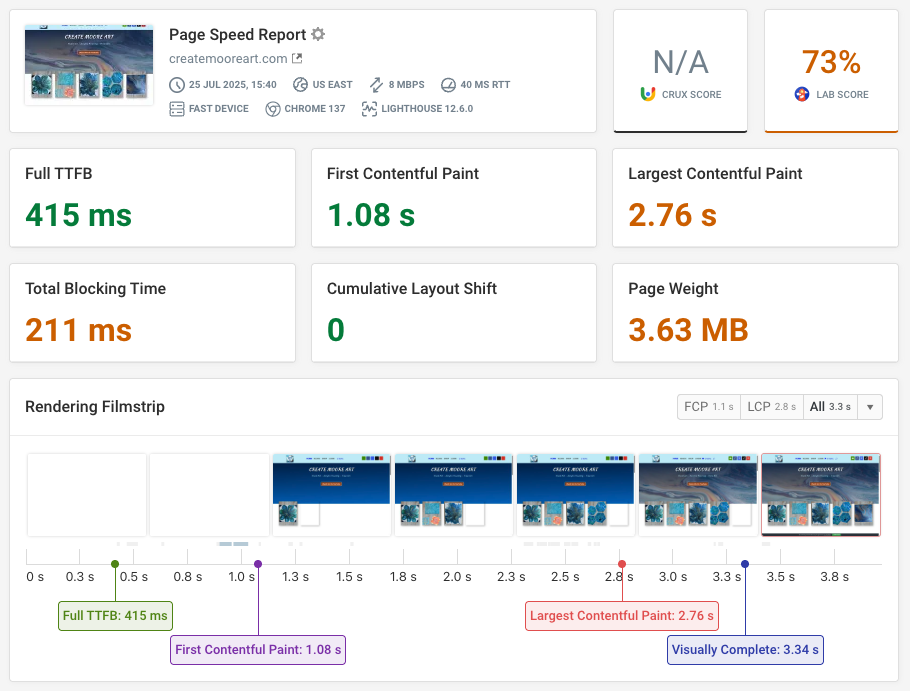
My score in the DebugBear test result also increased, with a TTFB of 415 milliseconds compare to the initial score of 3.68 seconds. My overall Performance score jumped from 61% to 73%.
Even if you use another host, there are ways to apply these same settings with plugins from the Wordpress main store.
Check out our WordPress performance guide to learn more about WordPress-specific ways to make your website fast.
Using a Content Delivery Network
While SiteGround offers its own CDN, I chose Cloudflare because my DNS servers were already pointing there, and Cloudflare provides additional free settings and a dedicated WordPress plugin.
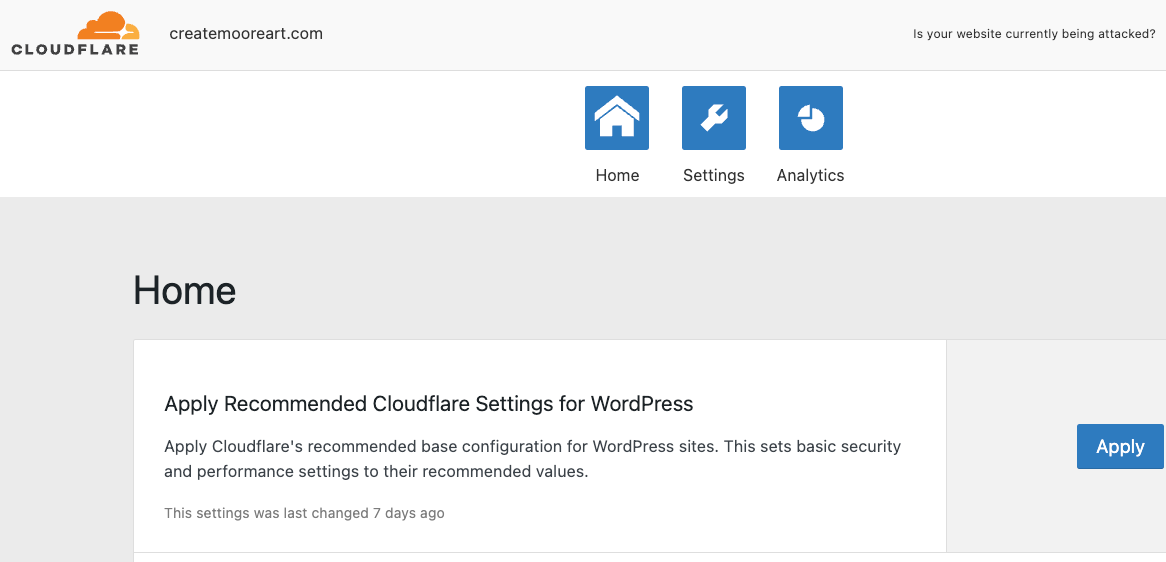
I installed and activated the Automatic Platform Optimization for WordPress plugin and applied Cloudflare's recommended settings for WordPress. I also made the following changes:
- On the Cloudflare UI, I enabled Speed Brain, which uses the Speculation Rules API to intelligently preload likely next pages, speeding up navigation.
- I ensured HTTP/3 (QUIC) was enabled for faster connection setup and data transfer, especially with TLS/authentication.
- Enabling 0-RTT Connection Resumption helps return users by speeding up connections for those who have previously visited the site.
- Early Hints were also turned on to allow browsers to preload linked assets before the main page response is fully received.
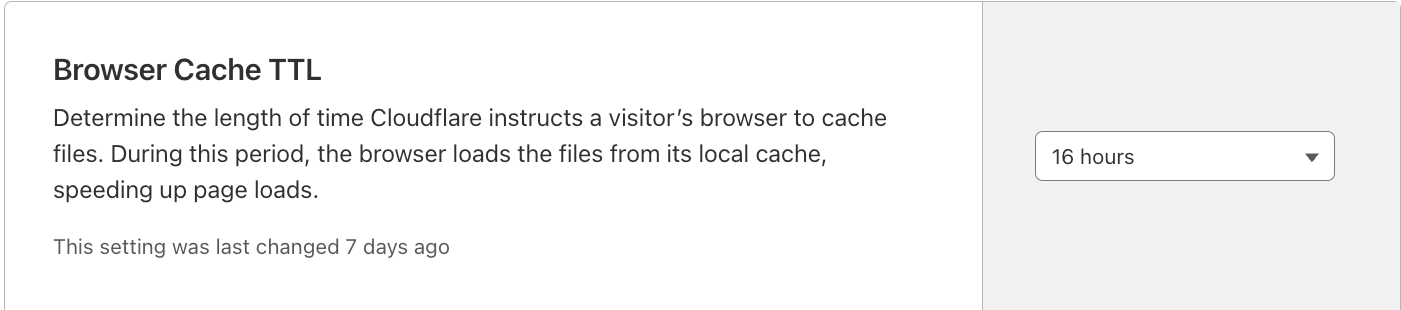
- I adjusted the browser caching "time to live" in Cloudflare to 16 hours (from the default 4 hours), as the front page of the website wouldn't change frequently. I may actually increase this for more gains in the future.
Optimizing Images
One thing I saw in my test result was that the largest image on the page, the background image, had a low request priority and was contributing significantly to the LCP.
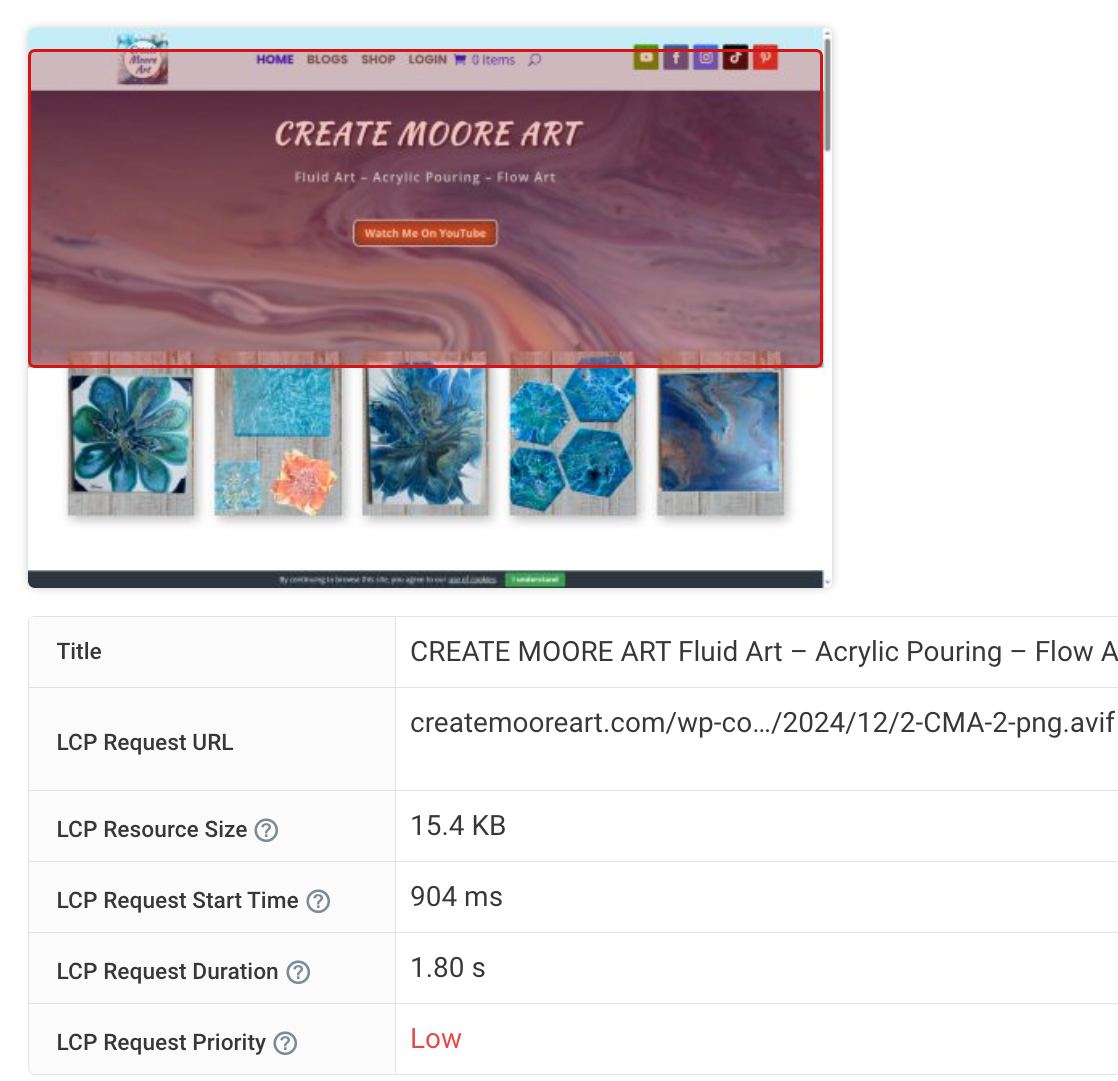
DebugBear's experiments feature allowed me to test the impact of prioritizing the largest contentful image without altering the live site.
It automatically added a preload link tag with a fetchpriority="high" attribute to ensure the browser starts loading the image as early as possible.
<link
  rel="preload"
  href="https://createmooreart.com/wp-content/uploads/2024/12/2-CMA-2-png.avif"
  as="image"
  fetchpriority="high"
/>
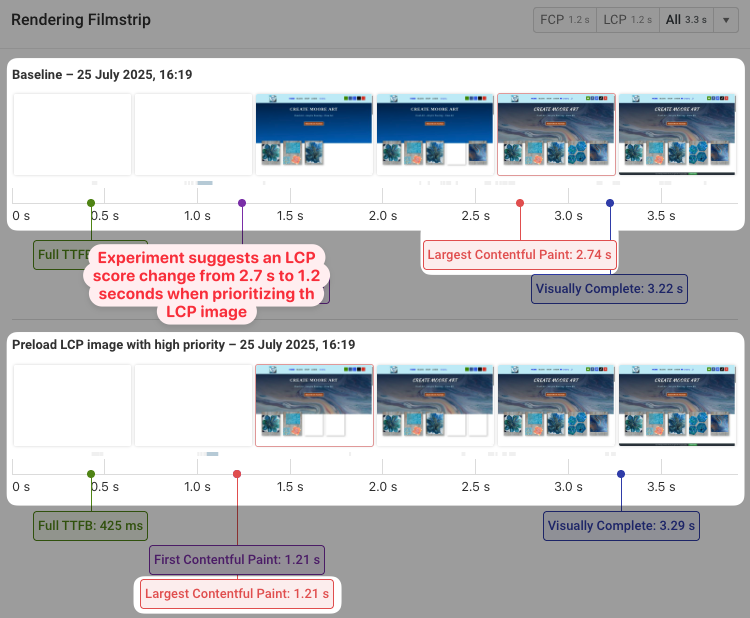
This experiment dramatically improved the LCP from 2.7 seconds to 1.2 seconds.
You see how this impacts the user experience in the side-by-side filmstrip view. Instead of showing the blue placeholder, the page now immediately renders with the main image in place.
I then implemented this change by adding a code snippet in Divi's Theme Options, instructing the browser to prioritize that specific image.
I also scaled down multiple oversized images to recommended sizes and reinserted them into the page through Divi's visual builder.
Images that aren't immediately visible to the user when the page loads (below the fold) can be lazy loaded, meaning they only load when the user scrolls down to them. This further reduces initial page weight. I ensured this was the case for all images that this should apply to and retested the page.
What was the outcome?
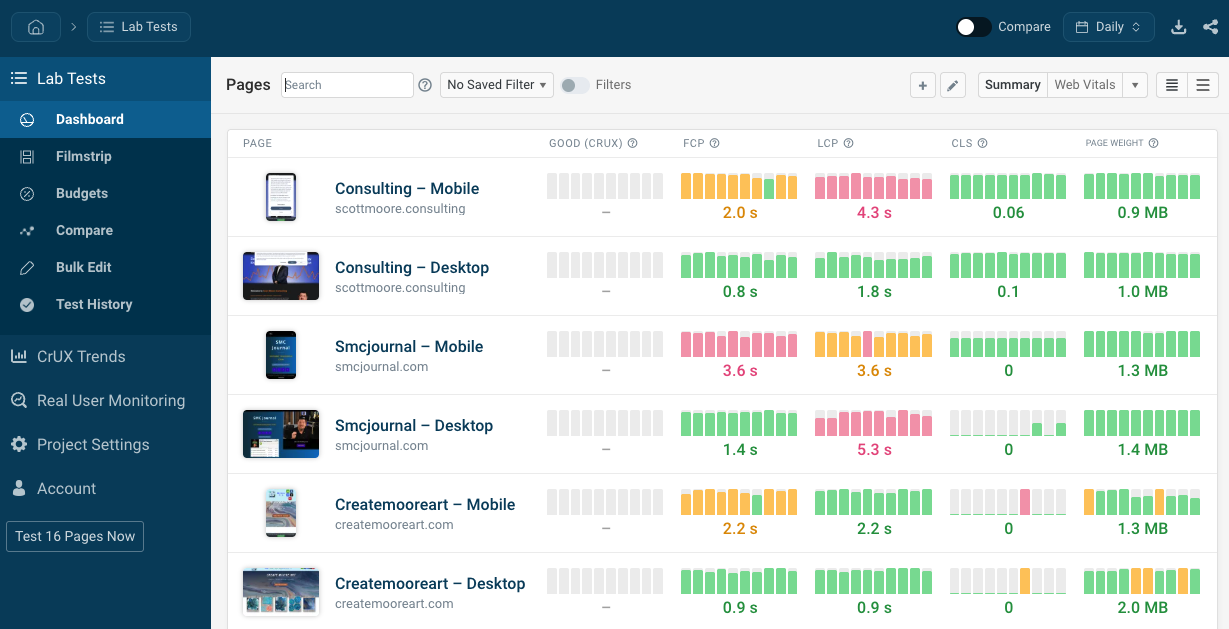
The initial DebugBear performance score for desktop was 61%, and for mobile, a dismal 33%. After implementing the caching strategies, the desktop score jumped to 73%.
The time to first byte was reduced from over 1 second to the 400-millisecond range, and the First Contentful Paint was under one second (previously around two seconds).
Adding Cloudflare's CDN and optimizing its settings maintained these improvements, with minor fluctuations in the overall score.
However, the most dramatic improvement came from prioritizing images and scaling them correctly. After these image optimizations, the desktop score soared to an impressive 94%!
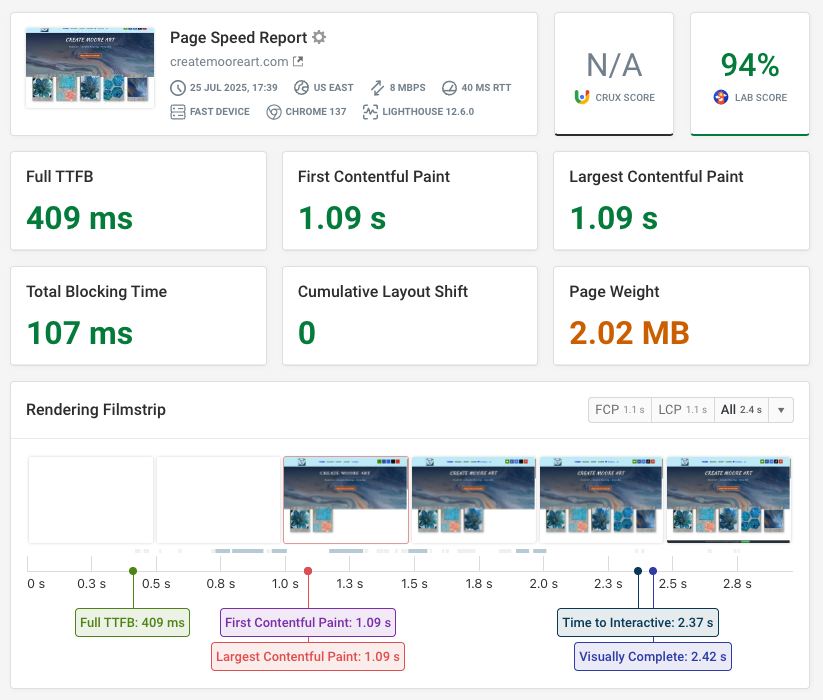
The mobile LCP also improved significantly, from 12 seconds to 1.8 seconds, and the mobile score increased to 86%.
These improvements were achieved largely through configuration changes and minor code adjustments, without fundamentally altering the website's structure.
Here's what these numbers mean for visitors coming to my website:
Your website can probably also benefit from some of these optimizations. But if you don't get the results you need, check out our guide on how to improve website performance, detailing over 10 different techniques.
Why Slow Loading Websites Matter For Business
A fast website goes beyond being a technical achievement. Speed unlocks a range of additional benefits, including:
- Improved User Experience: Users now expect instant gratification. A website that loads quickly provides a smooth and enjoyable experience, encouraging visitors to stay longer, explore more, and interact with your content. The less friction your site provides for users, the better opinion they have of your brand.
- Higher Search Engine Rankings (SEO): Google prioritizes website speed as a ranking factor. Faster websites are more likely to rank higher in search results, increasing visibility and organic traffic. Improved Core Web Vitals, which directly correlate with website speed, are essential for SEO.
- Increased Conversions: For e-commerce sites, speed directly translates to sales. A slow checkout process or delayed product images can lead to abandoned carts and lost revenue. Optimizing for speed creates a frictionless buying experience, leading to higher conversion rates.
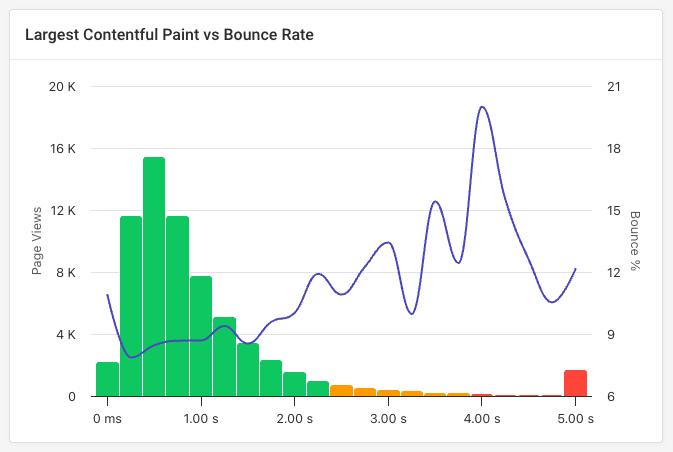
- Reduced Bounce Rate: When the cost of switching is low (meaning users can simply point their browser to somewhere else to get what they need), users are more likely to leave a slow website. A high bounce rate signals to search engines that your site isn't providing a good user experience, which goes right back to having a negative impact on your rankings.
- Competitive Advantage: In a crowded online marketplace, a fast website can differentiate you from competitors. When users can easily access and navigate your site, they are more likely to choose you over a slower alternative.
If you have an e-commerce site built on Magento, check out our guide to optimizing Magento performance.
Website Monitoring: The Key To Staying Fast
The journey to a fast website isn't a one-time fix; it's an ongoing process. This is where continuous website monitoring tools like DebugBear become indispensable. Here are just a few benefits:
- Identify Regressions: Website code changes, new plugins, or increased traffic can all impact performance. Ongoing monitoring helps you quickly identify any performance regressions and address them before they significantly affect your users.
- Track Real User Experience (RUM): While synthetic tests (like those run by DebugBear) provide controlled benchmarks, real user monitoring (RUM) captures actual user experiences from different locations, devices, and network conditions. This provides invaluable insight into how your website performs for your actual audience. DebugBear offers both synthetic and real user monitoring, allowing for comprehensive performance tracking.
- A/B Test Performance Improvements: Continuously monitoring allows you to A/B test different optimization strategies and measure their real-world impact on your website's speed and user engagement.
DebugBear is an extremely helpful tool for determining and addressing performance issues. Its ease of use, retesting capabilities, and ability to run experiments without live site changes make it an invaluable asset for anyone looking to optimize their website's performance.
While a perfect 100% score isn't the ultimate goal, a focus on continuous improvement and providing a great user experience will ultimately lead to better performance, higher conversions, and sustained business success.


Monitor Page Speed & Core Web Vitals
DebugBear monitoring includes:
- In-depth Page Speed Reports
- Automated Recommendations
- Real User Analytics Data