Lighthouse automatically evaluates the performance, accessibility, and technical SEO of your website. But did you know that you can add your own custom tests as well?
Custom audits can check requirements specific to your website. Here are some examples we'll discuss in this article:
- Checking that Twitter Card meta tags are present
- Ensuring that the page is included in the sitemap
- Scoring a custom performance metric
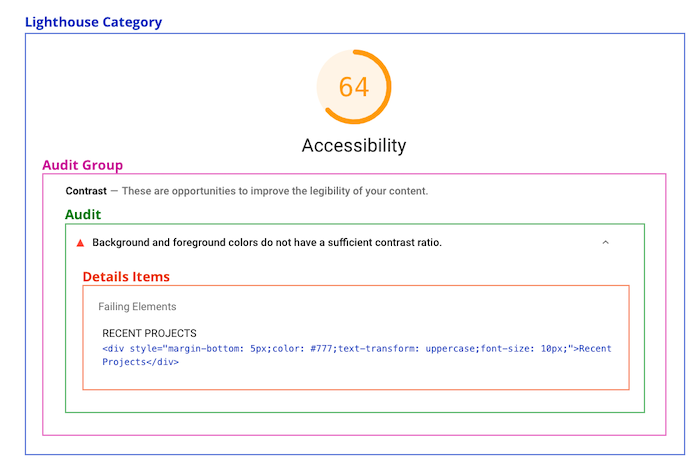
Lighthouse audits and categories
By default, a Lighthouse report consists of 5 categories:
- Performance
- Accessibility
- Best Practices
- SEO
- Progressive Web App
Each category consists of multiple audits, each testing some aspect of the page. The audit scores are then combined into an overall category score.
You can see all predefined audits in the default Lighthouse config.
Adding a Twitter Cards audit
Our first custom audit will check if the page contains a twitter:card meta tag. If this meta tag is present, Twitter shows a page preview whenever someone tweets the URL.
1. Add Lighthouse to your node modules
npm init
npm install lighthouse
2. Create Twitter Cards audit
The TwitterCardsAudit consists of a bunch of metadata plus the audit logic that actually evaluates the page and assigns a score.
Artifacts contain information that Lighthouse has collected about the page. In this case that's the list of meta tags. We'll learn more about artifacts and how to create custom ones later on.
// twitter-cards.js
const { Audit } = require("lighthouse");

class TwitterCardsAudit extends Audit {
  static get meta() {
    return {
      id: "twitter-cards",
      title: "Has Twitter Cards meta tags",
      failureTitle: "Does not have required Twitter Cards meta tags",
      description:
        "Twitter needs a twitter:card meta element to show previews.",
      requiredArtifacts: ["MetaElements"],
    };
  }

  static audit(artifacts) {
    const twitterCardsMetaTag = artifacts.MetaElements.find(
      (meta) => meta.name === "twitter:card",
    );
    const score = twitterCardsMetaTag ? 1 : 0;

    return {
      score,
    };
  }
}

module.exports = TwitterCardsAudit;
The audit function is where the magic happens. We look at the list of meta elements that Lighthouse has provided to us. If the list contains a twitter:card tag we assign a score of 1, otherwise the score is 0 and the audit should fail.
3. Create a custom config file
We've created our own audit, but Lighthouse doesn't know about it yet. To change that we need to extend the default configuration with our new audit, and create a new category for it.
// custom-config.js
module.exports = {
  extends: "lighthouse:default",
  audits: ["twitter-cards"],
  categories: {
    "social-sharing": {
      title: "Social Sharing",
      description: "Page has the right meta tags for sharing on social media.",
      auditRefs: [
        {
          id: "twitter-cards",
          weight: 1,
        },
      ],
    },
  },
};
If we have multiple audits, the weight lets us to define how much each individual audit contributes to the overall category score.
4. Run Lighthouse with the custom configuration
Finally, run Lighthouse using the custom configuration file.
lighthouse --config-path=custom-config.js https://example.com --view
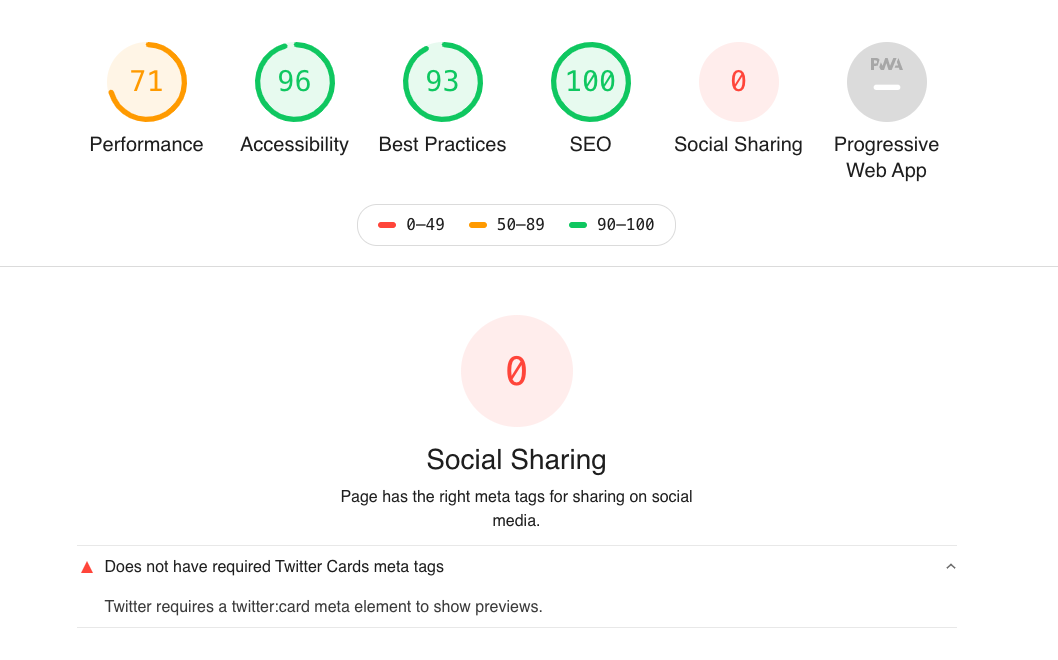
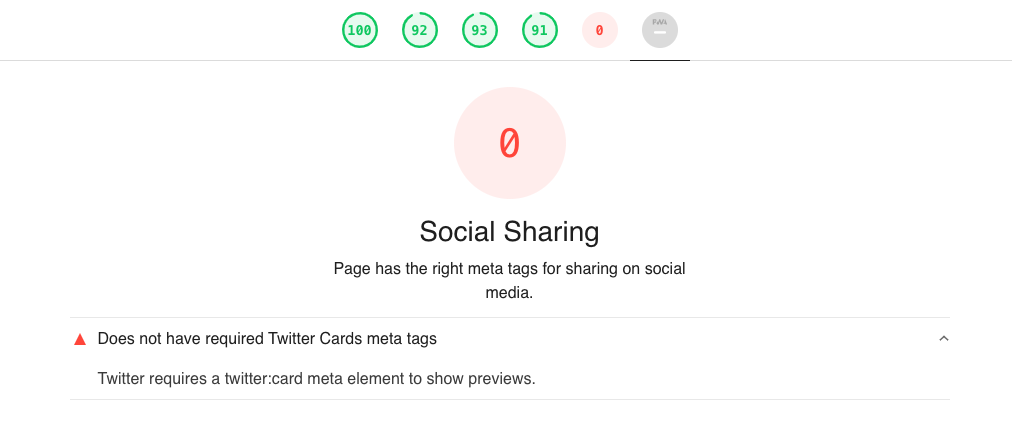
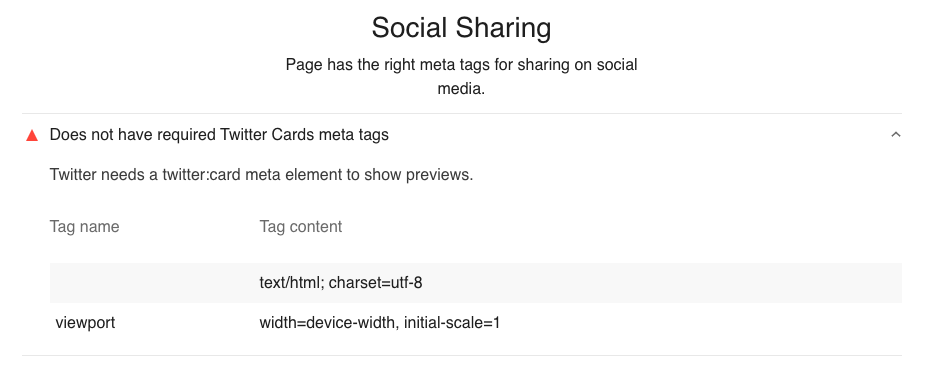
The Lighthouse report now contains a new "Social Sharing" category.
Adding details
Audit details provide additional information about an audit result. This can make it easier to debug and fix the audit.
Here we'll show all meta tags on the page, so if someone misspelled the name attribute of the meta tag they can spot it easily.
To achieve this, our audit needs to return a details property. We can use Audit.makeTableDetails to create a table containing debug info.
static audit(artifacts) {
  const twitterCardsMetaTag = artifacts.MetaElements.find(
    meta => meta.name === "twitter:card"
  )
  const score = twitterCardsMetaTag ? 1 : 0

  const foundTags = artifacts.MetaElements.map(el => ({
    name: el.name,
    content: el.content
  }))
  const headings = [
    { key: 'name', itemType: 'text', text: "Tag name" },
    { key: 'content', itemType: 'text', text: "Tag content" },
  ];
  const details = Audit.makeTableDetails(headings, foundTags);

  return {
    score,
    details
  };
}
What are Lighthouse artifacts?
Artifacts contain information that Lighthouse collected about a page. This information is collected by gatherers.
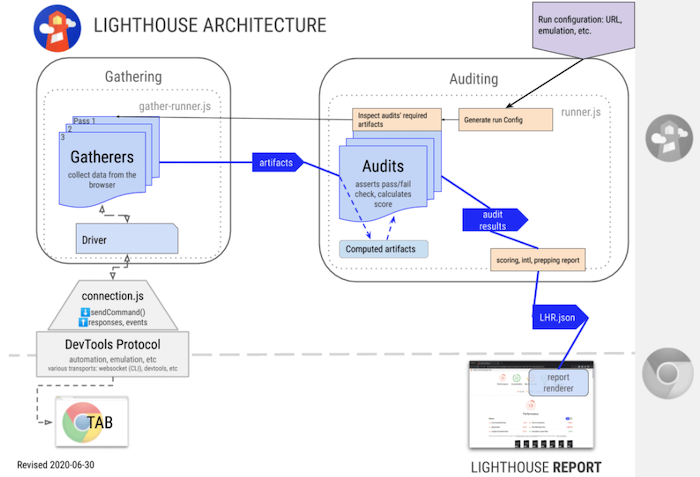
Lighthouse goes through the following steps when you run it:
- Open Chrome and go to the test URL
- Wait for the page to become idle, while collecting things like the Chrome trace
- Gather additional information about the page (for example viewport dimensions or a list of
atags) - Run audits that evaluate the collected artifact data and score the page
- Render a report based on the audit results
This diagram from the Lighthouse docs illustrates this process.
When writing a custom audit, we can either use an existing artifact, or write a custom gatherer that collects the information we need.
Gathering and auditing separately
Gathering and auditing are two separate steps. Gatherers produce artifacts, and audits consume them. Running the two steps separately can make development easier.
lighthouse https://example.com -G
This will gather the artifacts for the page and save them in a latest-run directory.
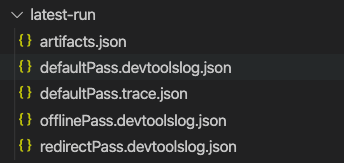
Most of the artifacts will be in artifacts.json. Before writing a custom gatherer, check if the data you need is already available.
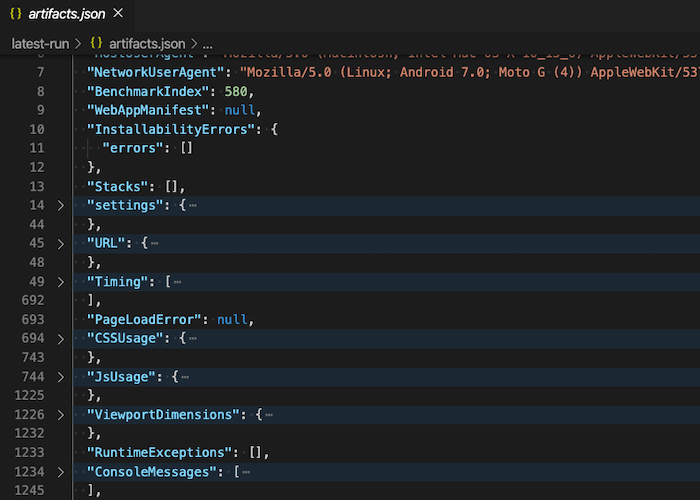
You can also run just the audits based on the artifacts in the latest-run directory. This can be helpful when developing audits, since opening Chrome and loading the test page usually takes a lot longer than just running the audits.
lighthouse https://example.com -A
Writing a custom gatherer to check if the sitemap contains the test URL
You'll often be able to use existing artifacts to create new audits. However, if you need information that Lighthouse doesn't already collect, you'll need to write a custom gatherer.
For example,this gatherer downloads the domain's sitemap and saves it as Sitemap artifact.
const { Gatherer } = require("lighthouse");

class Sitemap extends Gatherer {
  afterPass(passContext) {
    const expression = `fetch("/sitemap.xml").then(response => response.text())`;
    return passContext.driver.evaluateAsync(expression);
  }
}

module.exports = Sitemap;
The driver object
The passContext.driver object gives you access to the Chrome instance that's used to test the page. In this case we use it to run some code on the page.
What are passes?
A pass is when Lighthouse navigates to a page in Chrome. This actually happens more than once as part of each test. For example, Lighthouse tries loading the page using HTTP to check if it redirects to HTTPS.
However, the vast majority of artifacts are collected as part of the defaultPass, which just loads the page normally as you'd expect.
afterPass means that we'll wait for the page to finish loading before collecting the sitemap.
You can also add a beforePass method that runs before Chrome navigates to the tested page. This is useful if you want to listen to events emitted by the browser.
beforePass(passContext) {
  passContext.driver.on(
    "Runtime.exceptionThrown"
    exception => console.log(exception)
  );
}
Adding the gatherer to the config
Add this to custom-config.js to include the custom gatherer in the default pass:
passes: [
  {
    passName: "defaultPass",
    gatherers: ["sitemap"],
  },
],
Writing the IsInSitemap audit
To check if the page URL is in the sitemap our audit requires the Sitemap and URL artifacts.
// is-in-sitemap.js
const { Audit } = require("lighthouse");

class IsInSitemapAudit extends Audit {
  static get meta() {
    return {
      id: "is-in-sitemap",
      title: "Checks that the tested URL is in the sitemap.",
      failureTitle: "URL not found in sitemap",
      description:
        "URL should be in sitemap so that search engines can find it",
      requiredArtifacts: ["URL", "Sitemap"],
    };
  }

  static audit(artifacts) {
    const { URL, Sitemap } = artifacts;
    const isInSitemap = Sitemap.includes(`<loc>${URL.finalUrl}</loc>`);

    return {
      score: isInSitemap ? 1 : 0,
    };
  }
}

module.exports = IsInSitemapAudit;
Add the audit to the config file and run Lighthouse.
module.exports = {
  extends: "lighthouse:default",
  passes: [
    {
      passName: "defaultPass",
      gatherers: ["sitemap"],
    },
  ],
  audits: ["is-in-sitemap"],
  categories: {
    "extra-seo": {
      title: "Extra SEO",
      description: "Custom SEO validation",
      auditRefs: [
        {
          id: "is-in-sitemap",
          weight: 1,
        },
      ],
    },
  },
};
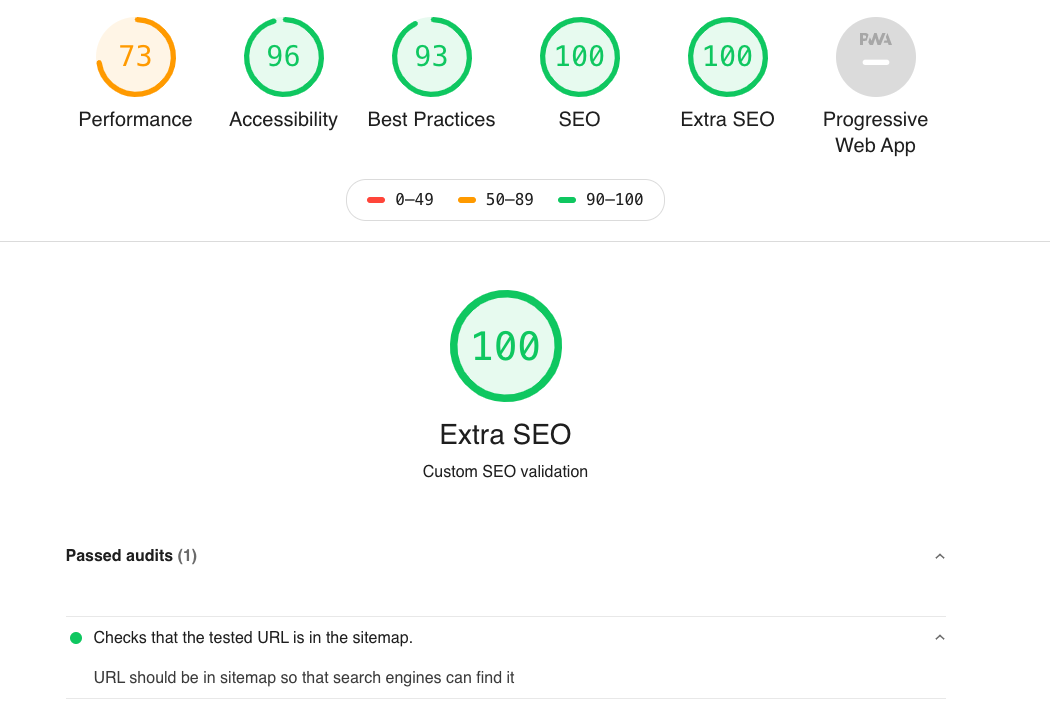
This is how the audit will look in the Lighthouse report.
Scoring a user timing
Lighthouse automatically collects a bunch of broadly applicable performance metrics, like First Contentful Paint and Time to Interactive. However, these metrics aren't tailored to your site and might not capture the actual user experience.
You can use the User Timing API to create custom metrics that mark rendering milestones that are important for your site.
performance.mark("app-rendered");
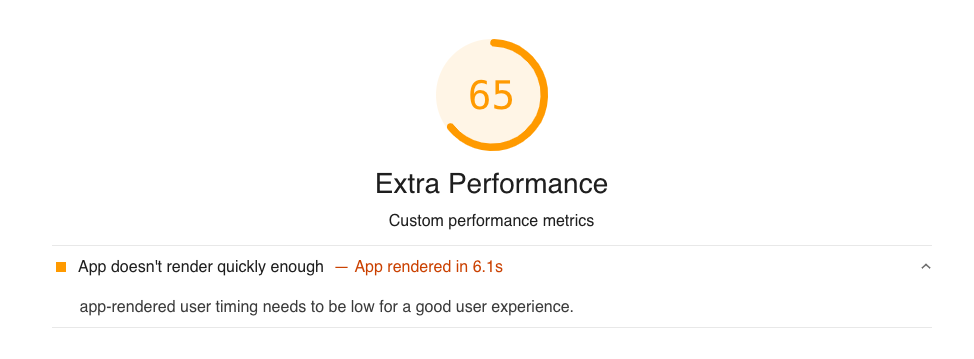
As a final example, we'll write an audit that scores the app-rendered metric.
Accessing user timings
Lighthouse does not provide a UserTiming artifact, but the user timings can be derived from the Chrome trace. The Lighthouse module contains a computed artifact called ComputedUserTimings which does this for us.
Note that we'll need to include traces in the required artifacts.
const { Audit } = require("lighthouse");
const ComputedUserTimings = require("lighthouse/lighthouse-core/computed/user-timings.js");

class AppRenderedAudit extends Audit {
  static get meta() {
    return {
      id: "app-rendered",
      title: "Measures when the app has been rendered",
      failureTitle: "App doesn't render quickly enough",
      description:
        "app-rendered user timing needs to be low for a good user experience.",
      requiredArtifacts: ["traces"],
    };
  }

  static async audit(artifacts, context) {
    const trace = artifacts.traces[Audit.DEFAULT_PASS];
    const userTimings = await ComputedUserTimings.request(trace, context);
    const appRendered = userTimings.find(
      (ut) => ut.name === "app-rendered",
    ).startTime;
    // todo: calculate score
  }
}

module.exports = AppRenderedAudit;
There's one catch with this: Lighthouse simulates how the page would have loaded on a slower device, but it does not apply this simulation to the user timing metrics. So their values will be out of whack with the simulated metrics.
To fix this, we can run the test using DevTools throttling instead of simulated throttling.
lighthouse\
  --config-path=custom-config.js\
  --throttling-method=devtools\
  https://www.test-app.com
Scoring the user timing
Let's say a great mobile load time for our app is 4s. We can use that as a threshold where the score is 100, and then the score gradually goes down as the load time increases.
function calculateScore(appRendered) {
  const score100Timing = 4000;
  return Math.min(score100Timing / appRendered, 1);
}
This logic is pretty basic, but it's good enough for us. You might want to take a look at the Audit.computeLogNormalScore method that's normally used by Lighthouse.
Finally, let's return the score from the audit.
const formattedTiming = Math.round((appRendered / 1000) * 10) / 10 + "s";

return {
  numericValue: appRendered,
  score: calculateScore(appRendered),
  displayValue: `App rendered in ${formattedTiming}`,
};
numericValue makes sure the absolute metric value is included in the Lighthouse result, and displayValue allows us to show a message on the audit.