CPU And JavaScript Timeline
CPU processing activity impacts overall page load time and delays user interactions. DebugBear synthetic test results can help you identify slow CPU tasks.
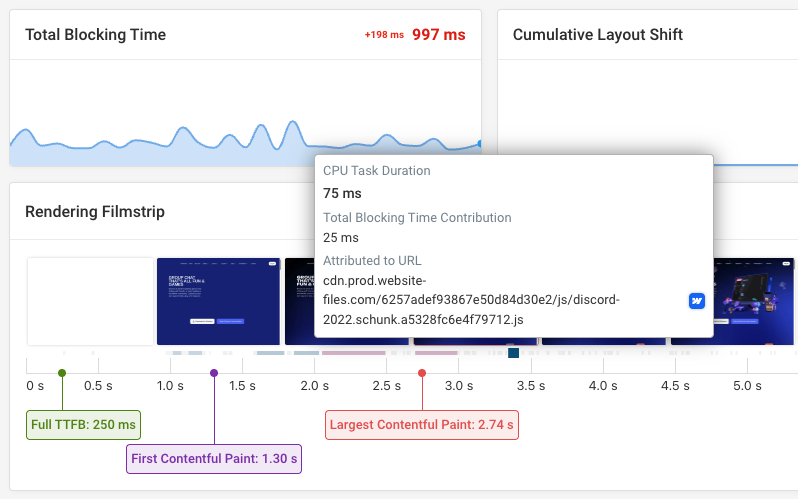
DebugBear CPU timeline
Each DebugBear result contains a timeline of work done on the page main thread.
Most of this work often consists of JavaScript code execution. However, it also includes other CPU tasks, such as calculating the page layout, or parsing HTML code.
The CPU timeline is shown below the filmstrip view.
View script-specific processing time
If you expand the Total Blocking Time metric you'll see a larger version of the CPU timeline as well as a script-level breakdown of processing duration.
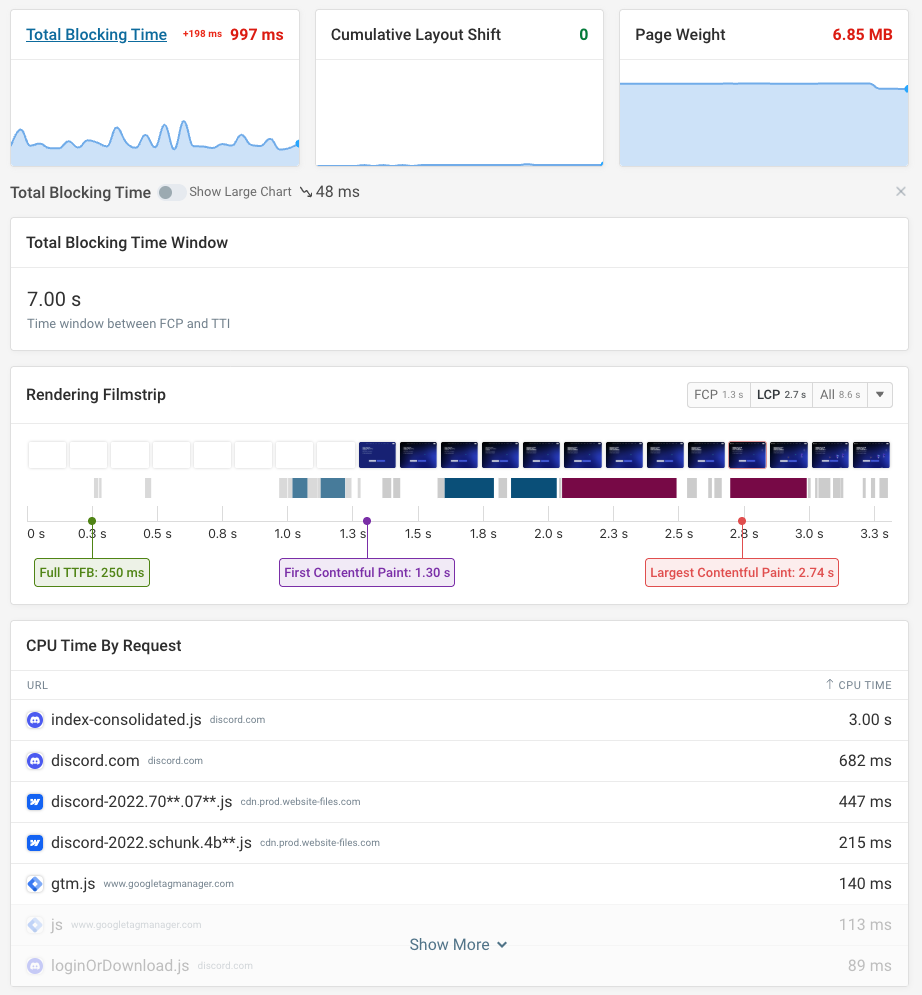
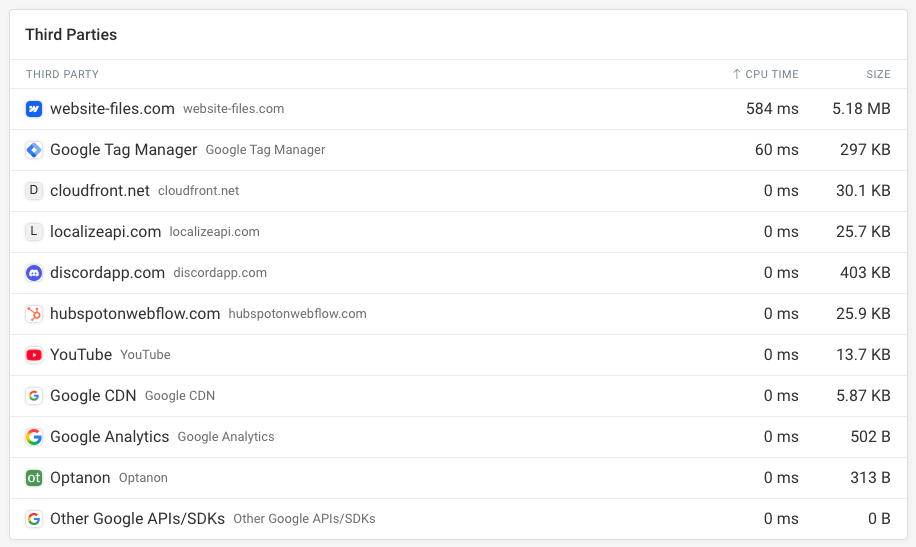
You can also view a list of third-party scripts to see how other service providers used on your website impact performance.
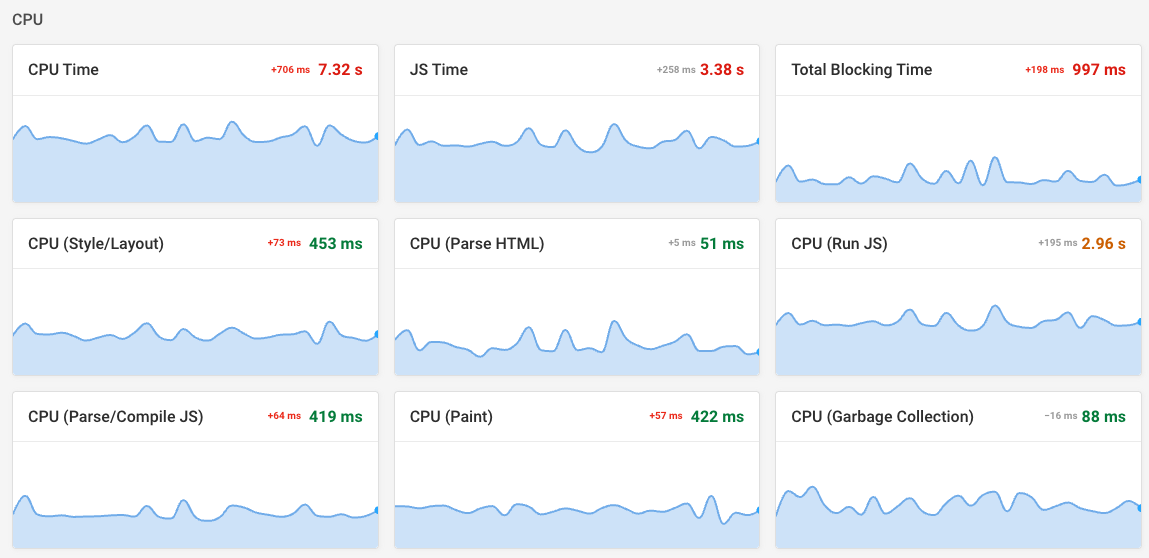
Additional CPU time metrics
The Metrics tab shows a more granular breakdown of CPU processing time. For example, you can view how much time was spent on:
- JavaScript execution
- Style calculations
- Layout and rendering
- HTML Parsing
- Garbage collection
- Painting