
The modern alternative to GTmetrix
Looking for GTmetrix alternatives?
Test and monitor website performance with DebugBear.
”We've updated around 15,000 pages and saw some nice gains from it. "Good URLs" and their impressions
have increased 3x since implementation.“


”DebugBear has been an eye opener for us and has really shown what's causing the Core Web Vitals issues on our website.


We help startups, agencies, and enterprises keep their website fast

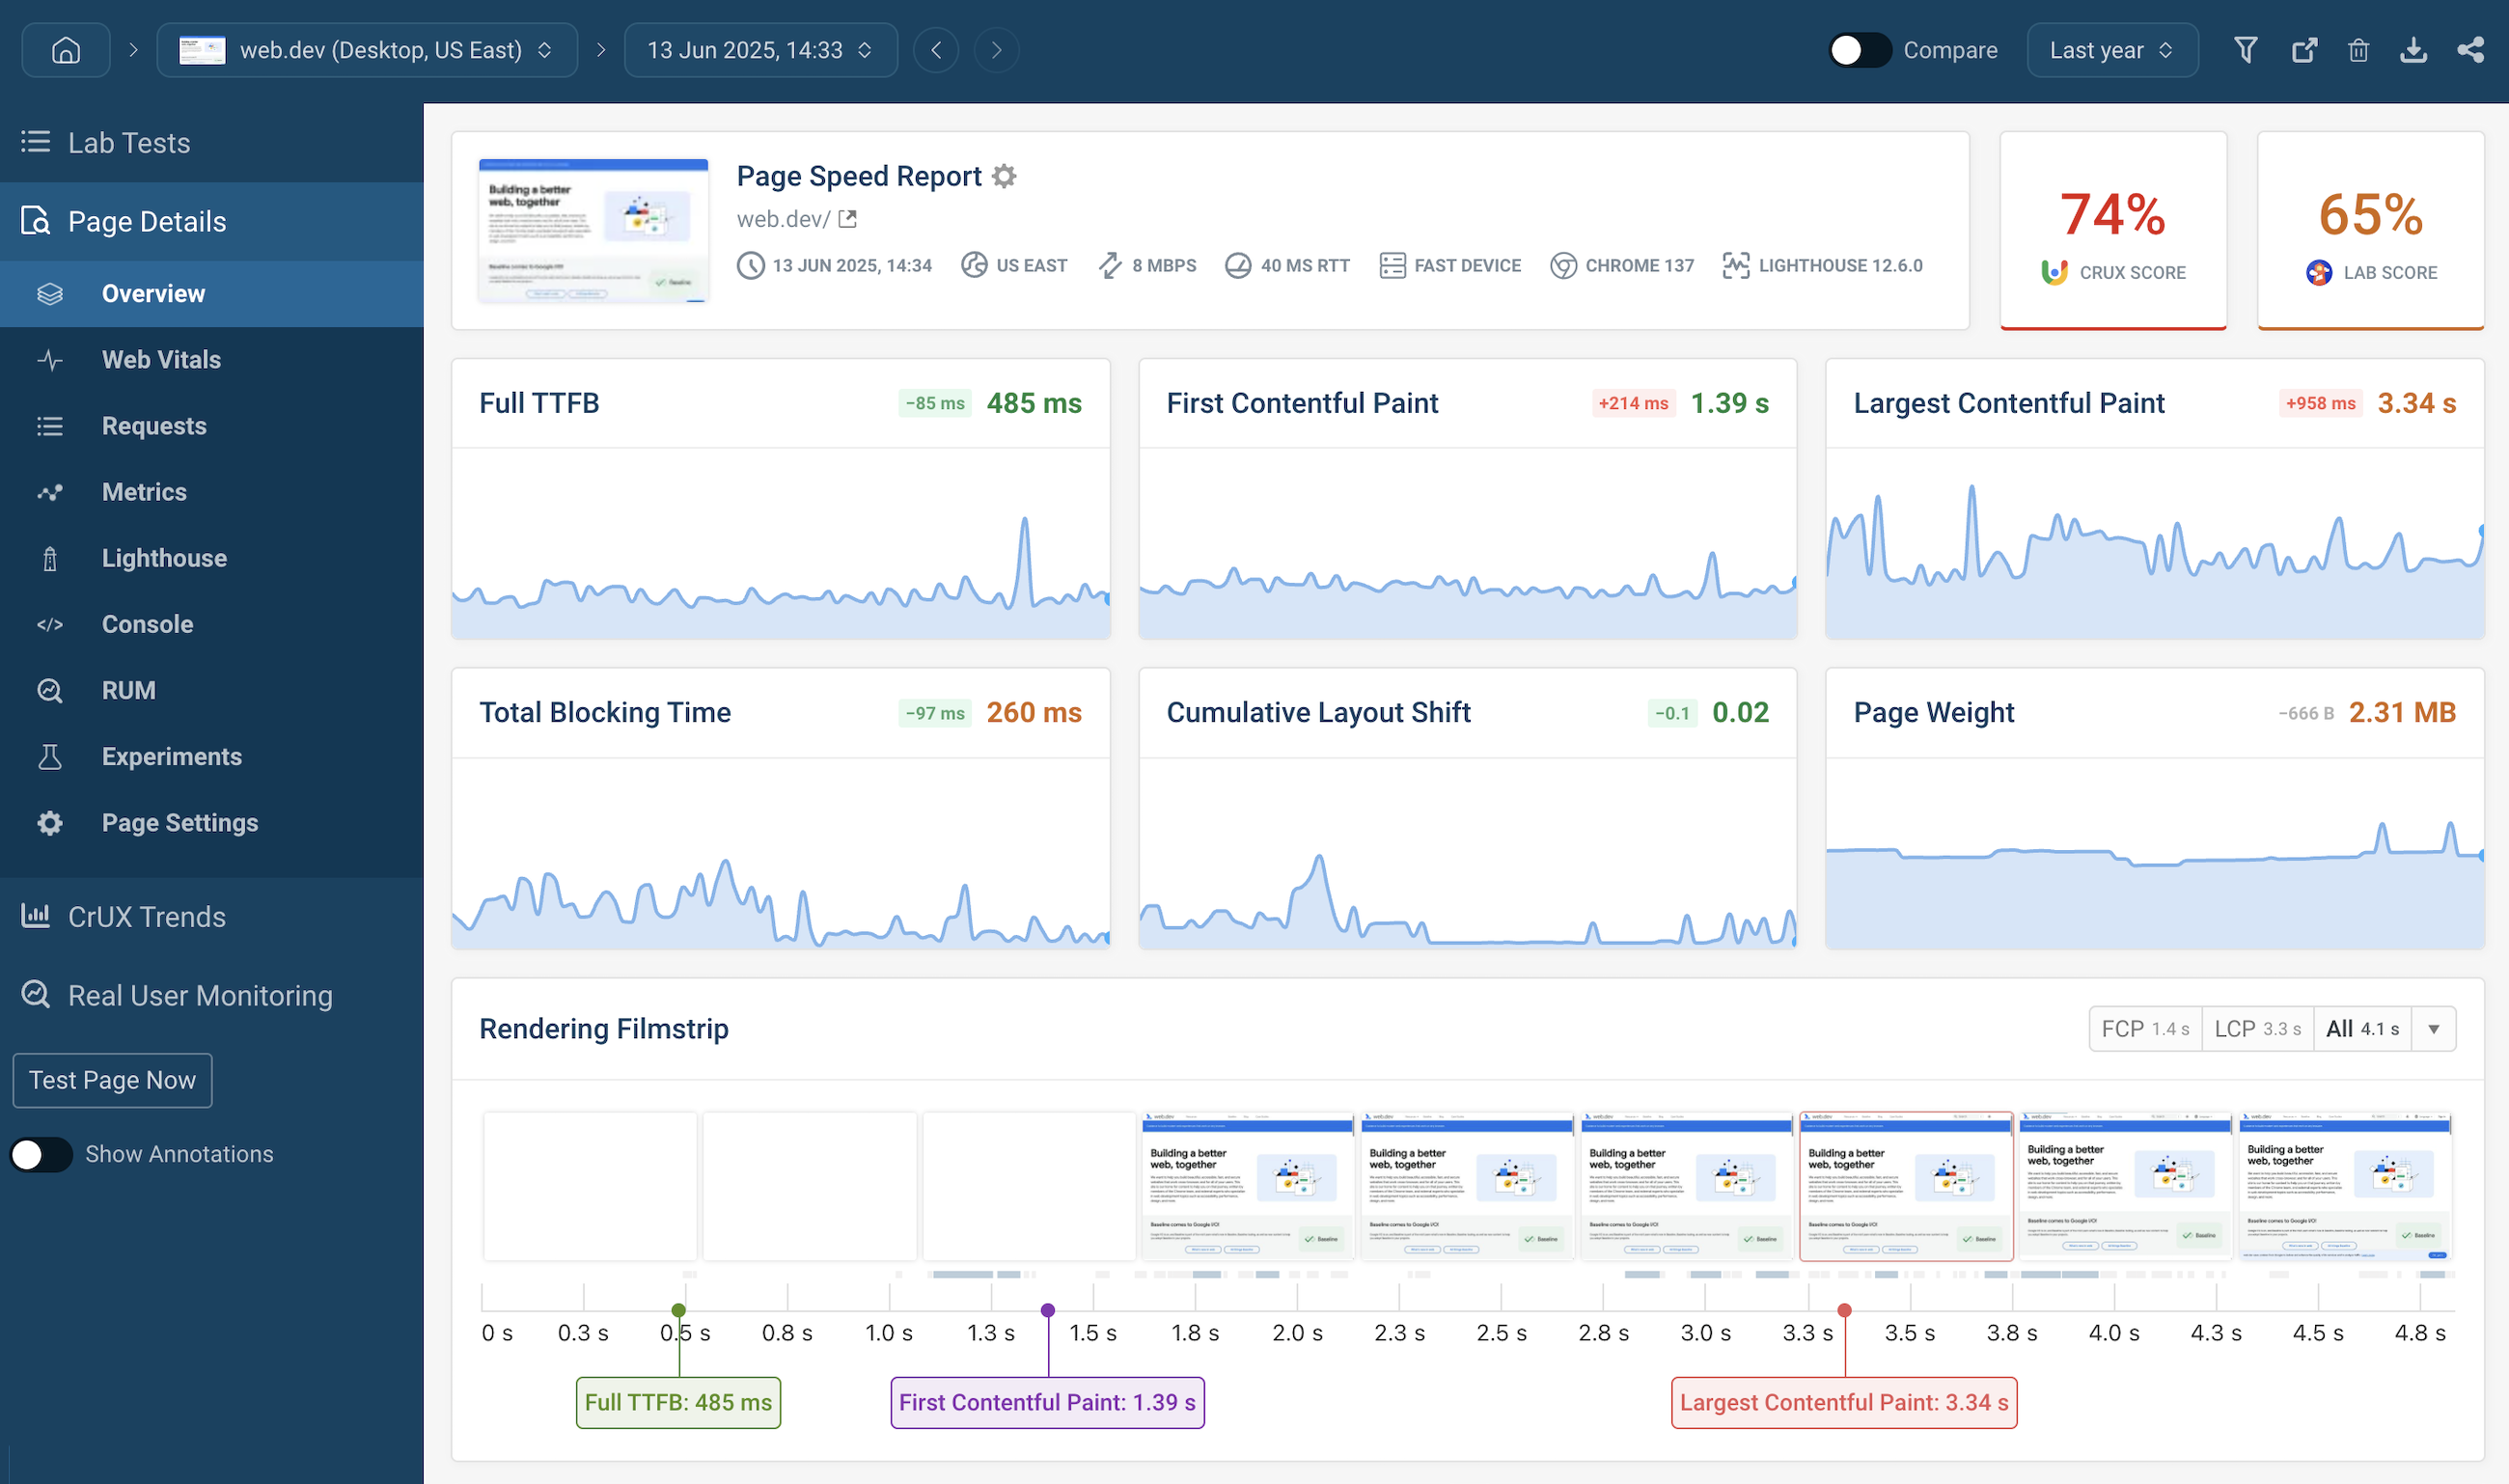
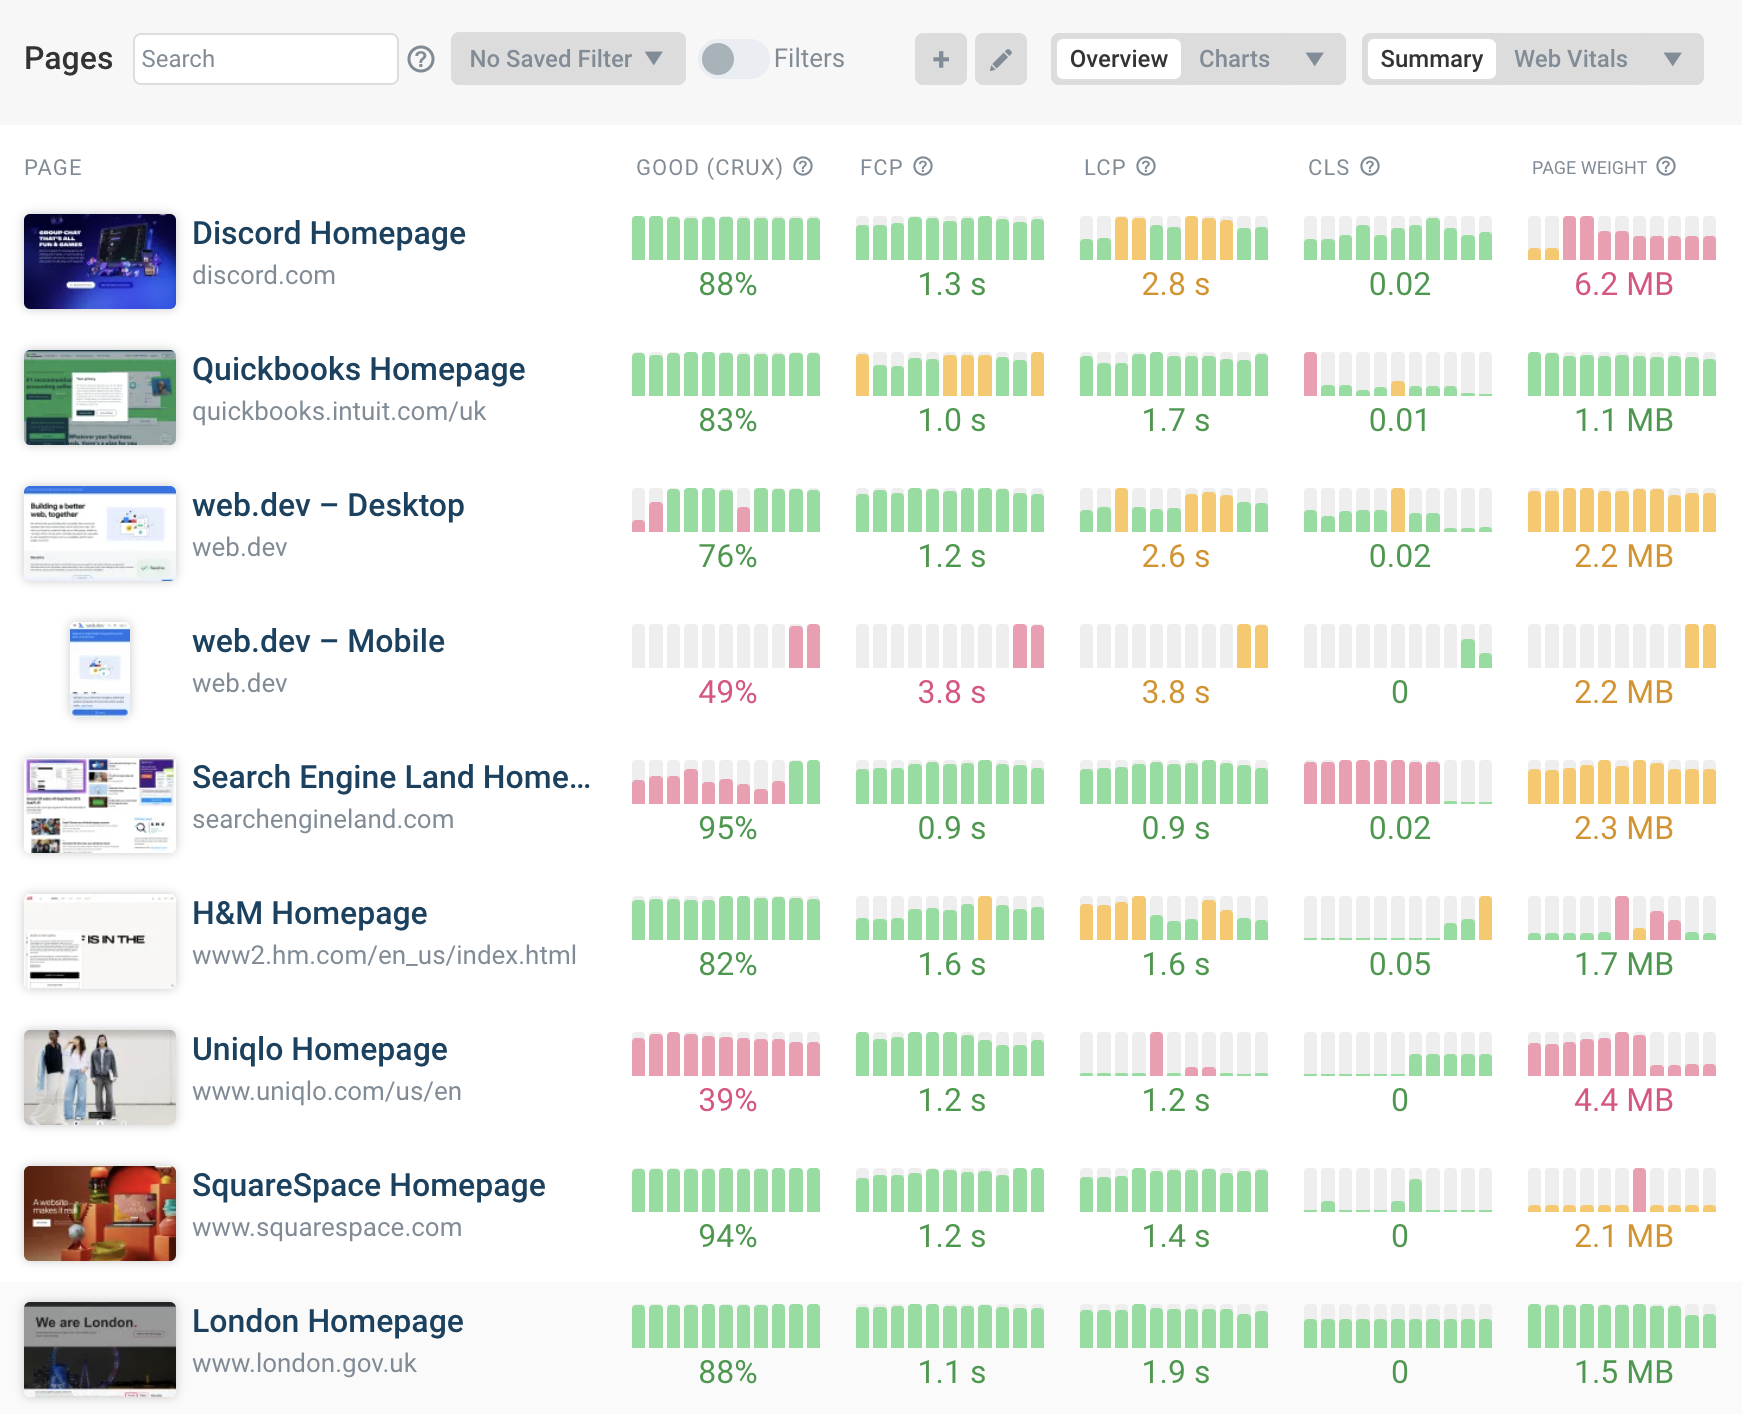
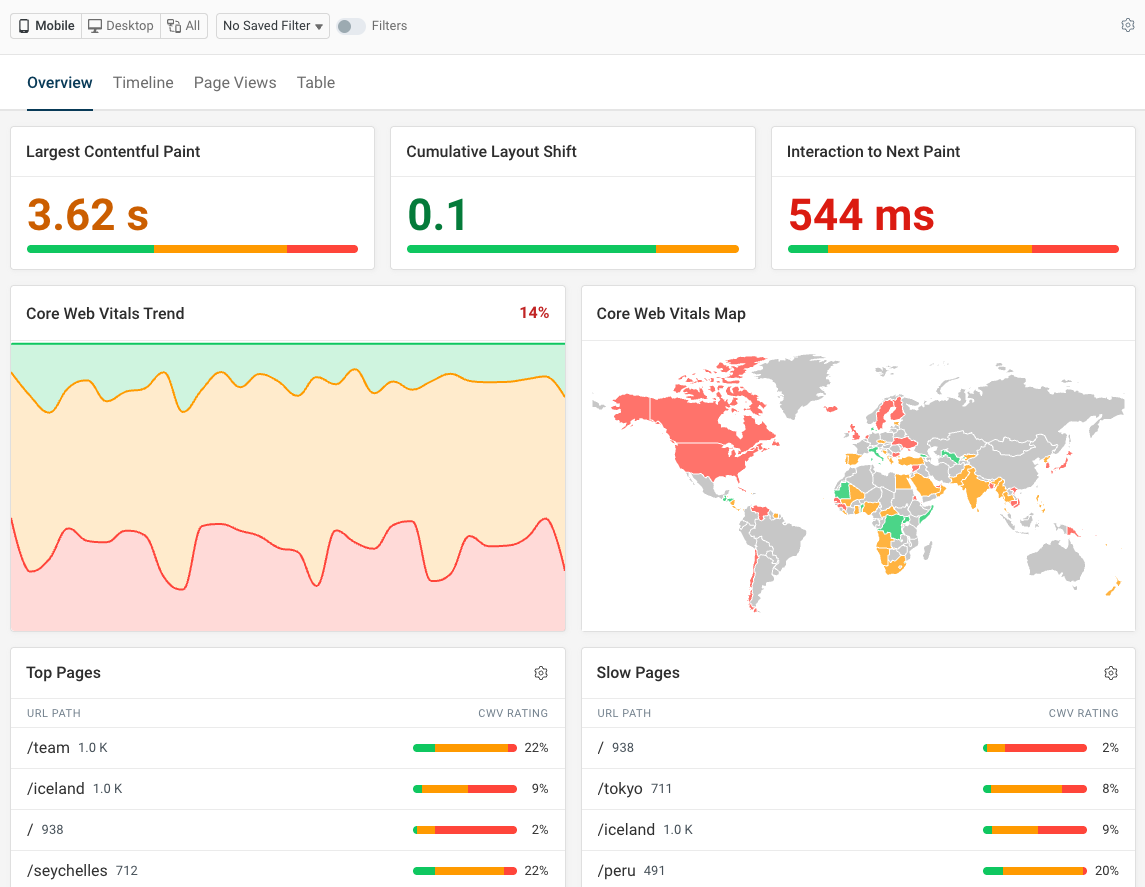
Track page speed on your website
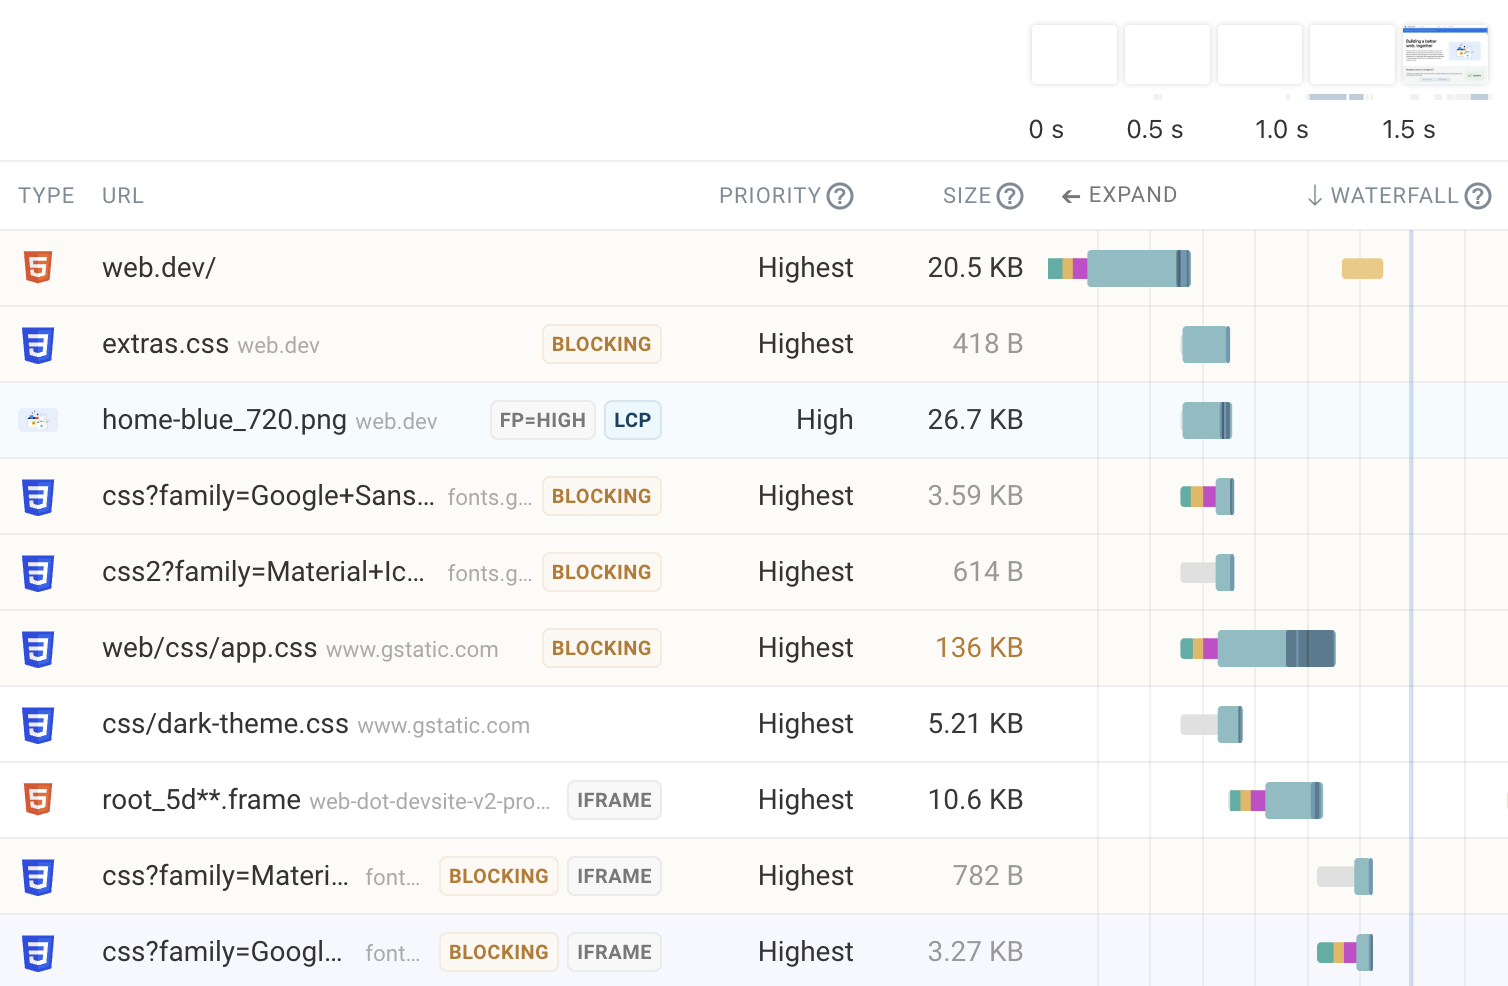
Dive deep into the data
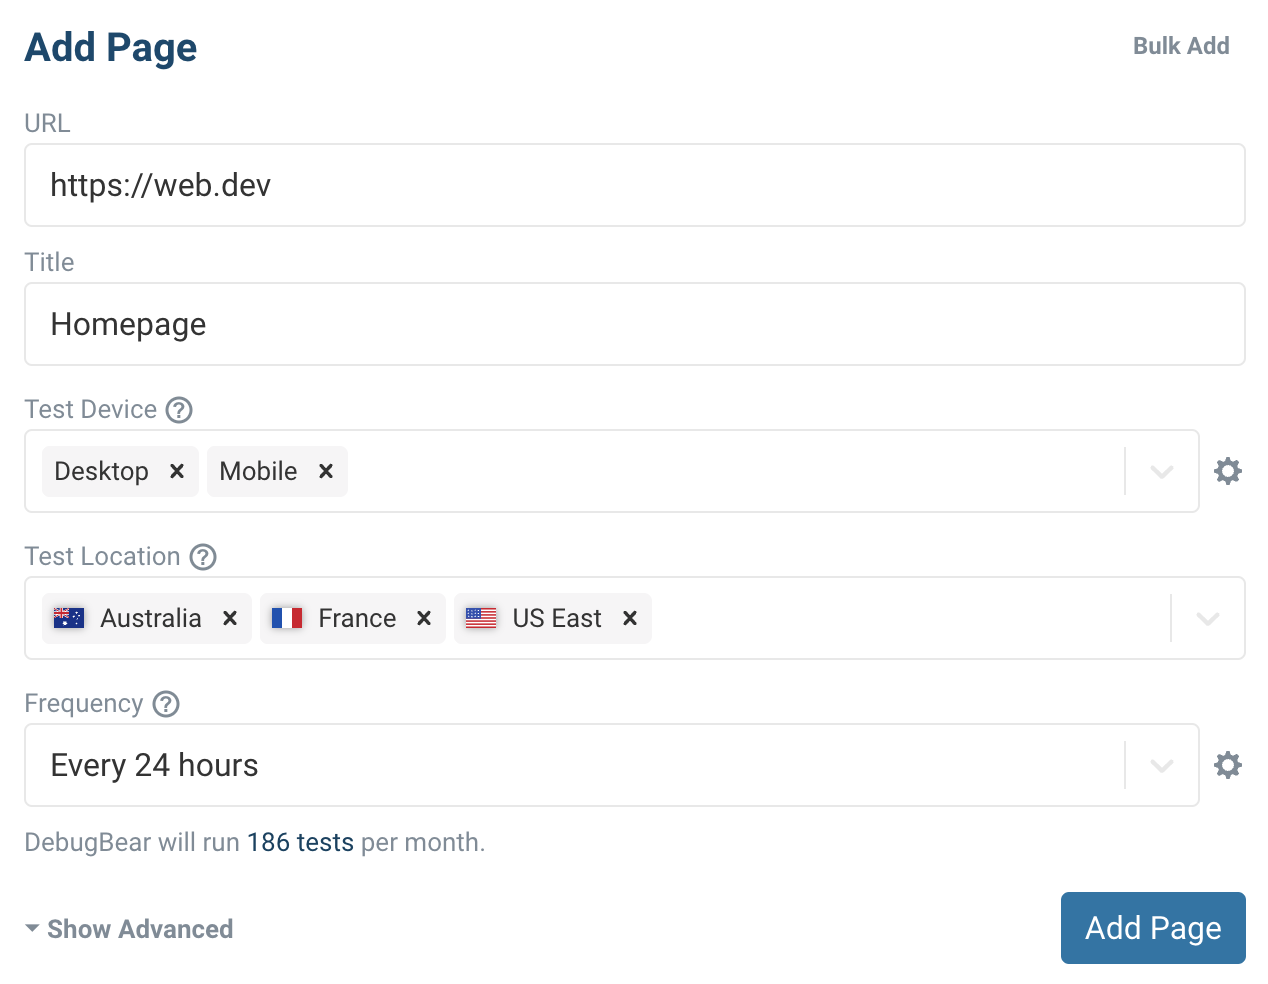
Customize your tests
Real user monitoring
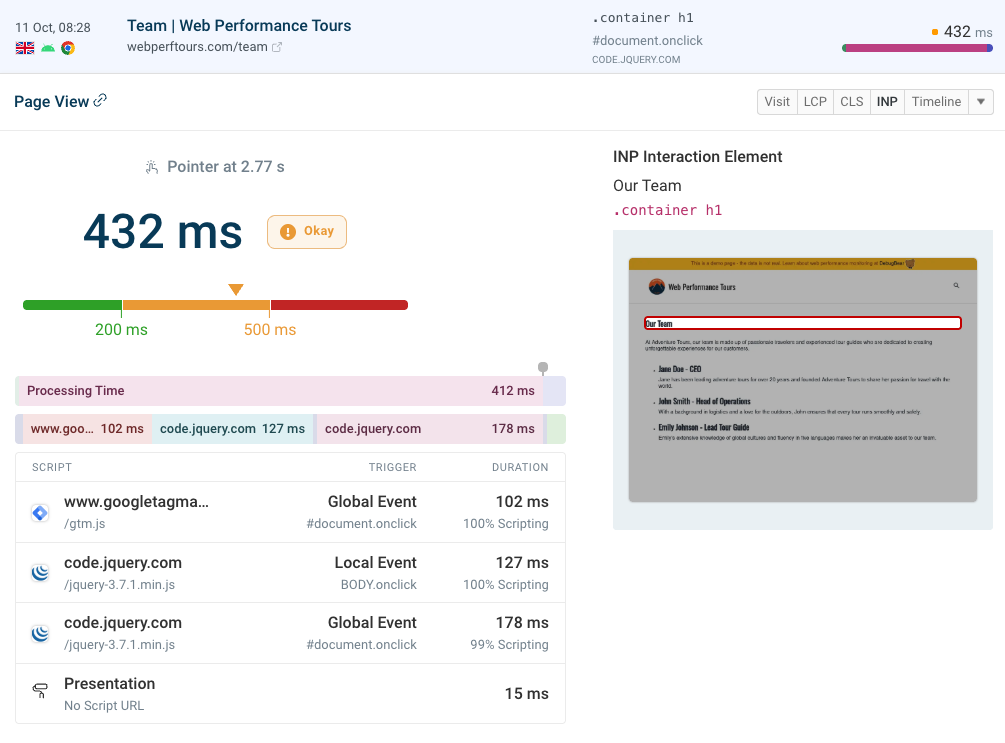
Fix Interaction to Next Paint
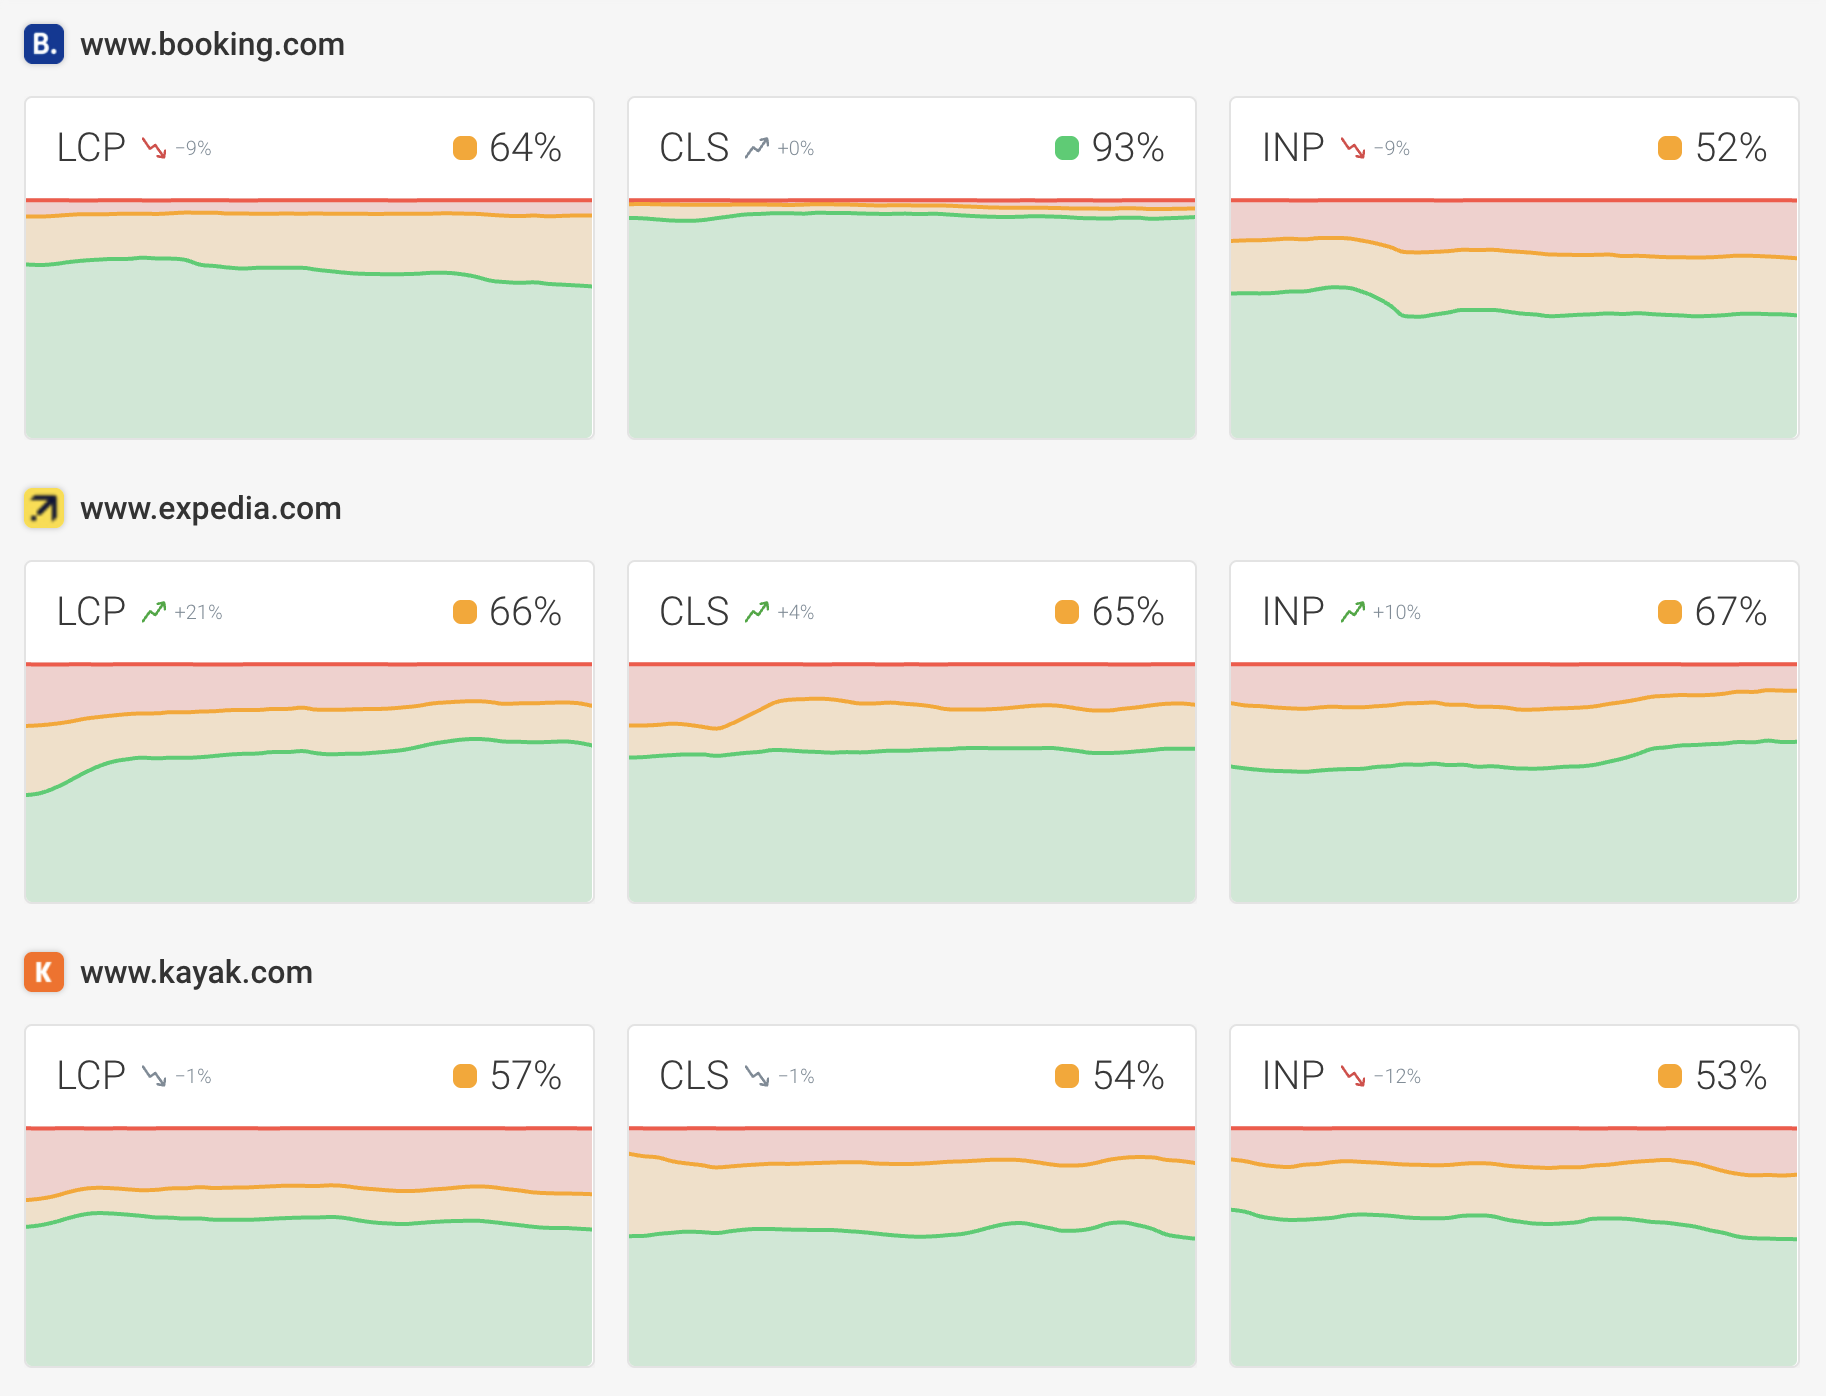
CrUX-based competitor benchmarks
You are using an old browser that is not supported anymore. You can continue using the site, but some things might not work as expected.