Website Filmstrips and Video Recordings
The filmstrip timeline shows a step-by-step view of the rendering progress of your page. These screenshots tell you how a user would experience loading your website.
Interpreting filmstrips
Let's look at this filmstrip from the Wall Street Journal as an example.
- At first the outline of the page appears
- A black square for a video appears
- The placeholder image for the video appears
- An ad is rendered at the top of the page
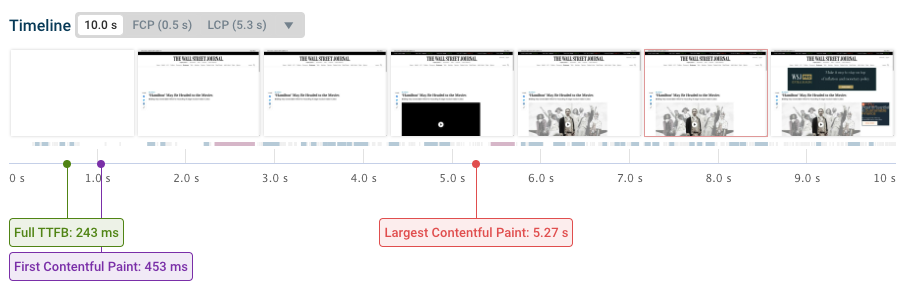
We can see that the initial paint happens relatively soon. This is also reflected in the First Contentful Paint metric, which is 0.5s for this website.
The video placeholder loads after 5.3 seconds and marks the Largest Contentful Paint.
Identifying performance opportunities based on the filmstrip
Once we understand how the page rendering progress impacts our users we can look for ways to optimize the page load experience.
For example, we can investigate why the video placeholder image takes so long to load – maybe the image can be compressed, or we can increase its priority compared to other page resources.
CPU Activity
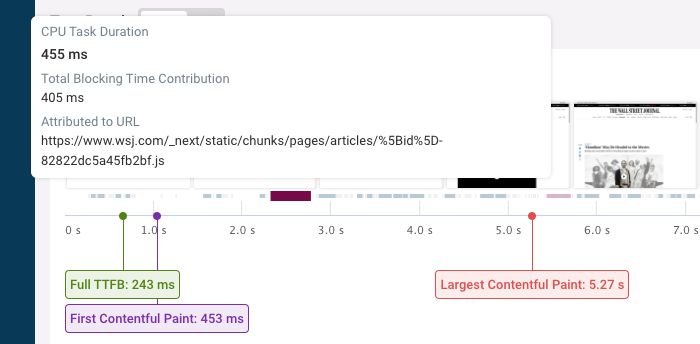
DebugBear also shows CPU tasks below the rendering filmstrip.
Tasks shorter than 50 milliseconds are shown in gray, tasks under 250 milliseconds in blue, and tasks over 250 milliseconds in red.
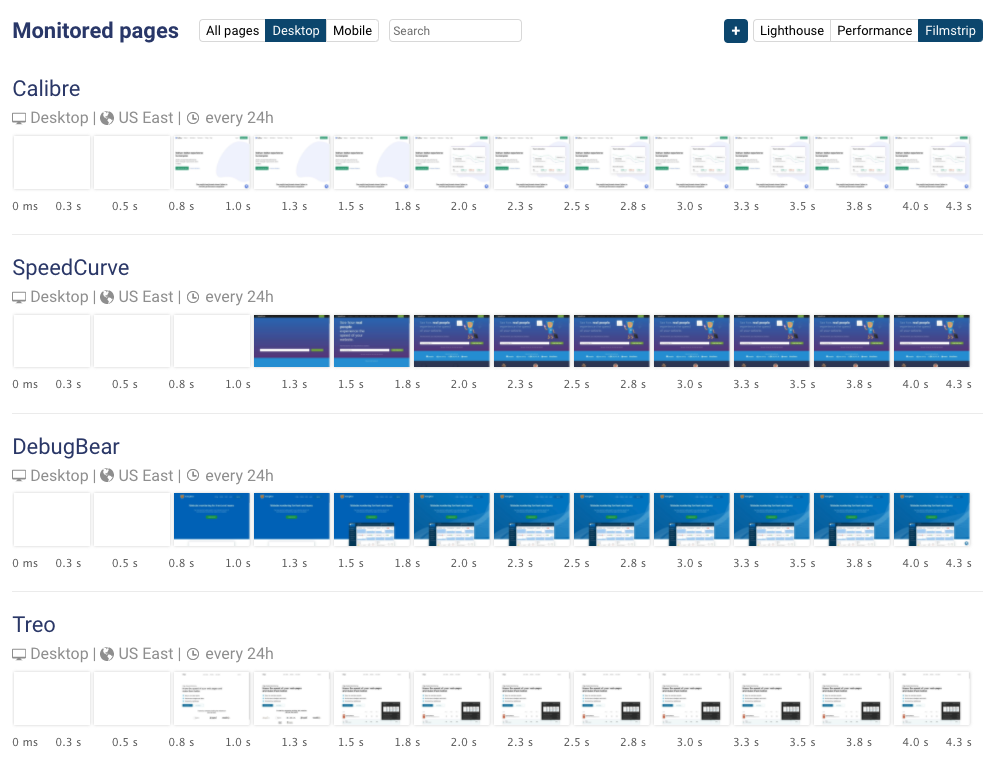
Comparing website filmstrips
DebugBear lets you compare the filmstrips of different websites side by side. Just select the Filmstrip option in the top left of your project overview page.
This comparison can help you benchmark your page load performance against your competitors.
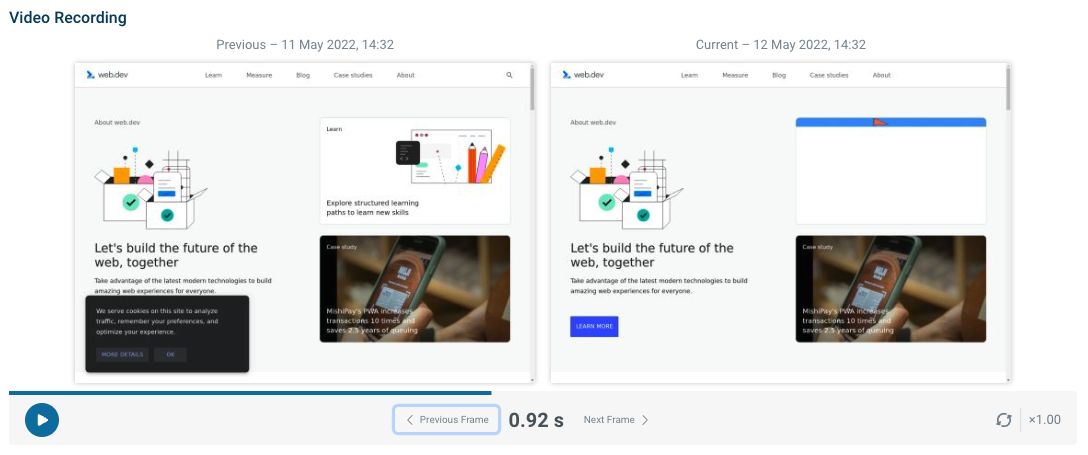
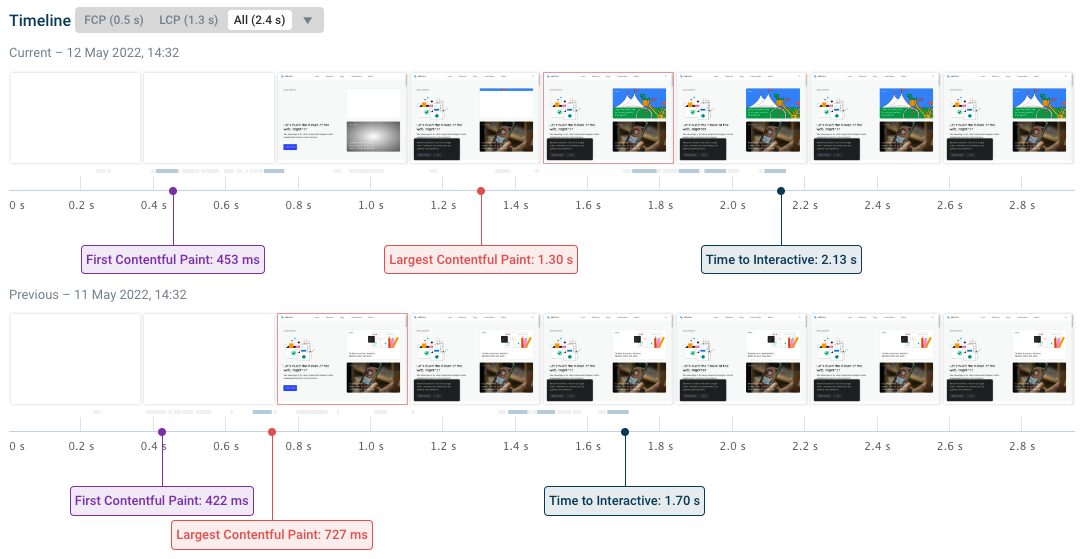
You can also compare the filmstrips of two test results to see what changed between them. You can do this in the page Overview tab.
In this example the LCP image changed to a larger one, causing a regression in the Largest Contentful Paint metric.
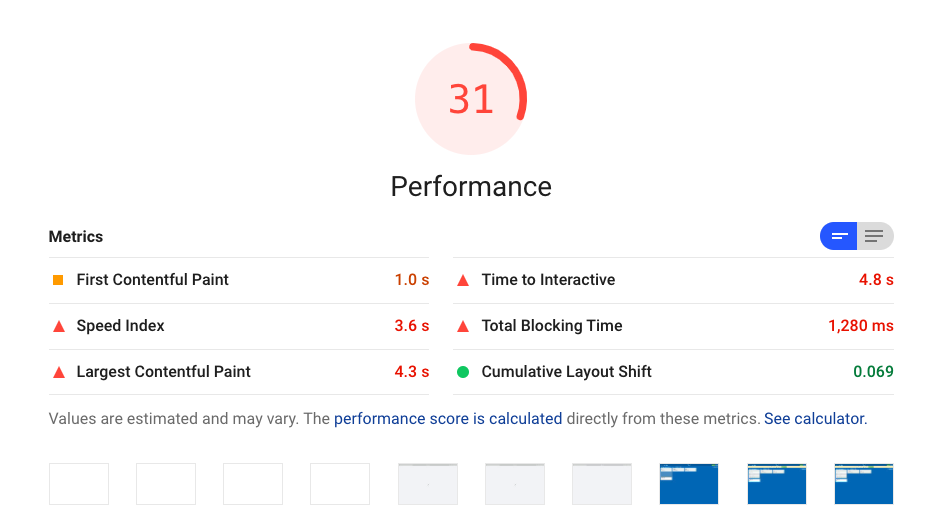
Filmstrips in Lighthouse
Lighthouse reports include a filmstrip at the top of the Performance section. There are a few options to generate a report:
- on web.dev (click the View Report button after running the test)
- in the Chrome DevTools Performance tab
- using DebugBear
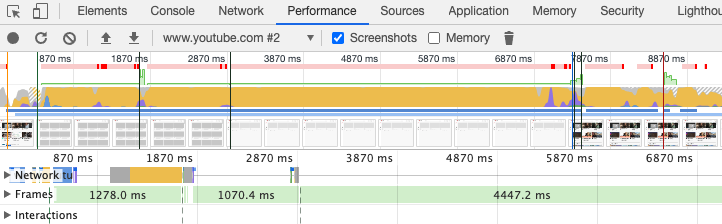
Filmstrips in Chrome DevTools
You can enable filmstrips for DevTools profiles by checking the Screenshots option before loading the page.
Video recordings
Test results also include a video recording showing how a user would have experienced the page rendering.
Comparing video recordings
Like with the filmstrip, you can view two video recordings side by side, for example to investigate a performance regression or to compare your site to your competitors.