
Website Performance Monitoring
Track the performance of your website, delight your customers, and rank higher in Google.
Catch regressions before they impact your business.
”We've updated around 15,000 pages and saw some nice gains from it. "Good URLs" and their impressions
have increased 3x since implementation.“


”DebugBear has been an eye opener for us and has really shown what's causing the Core Web Vitals issues on our website.


We help startups, agencies, and enterprises keep their website fast

Monitor web performance
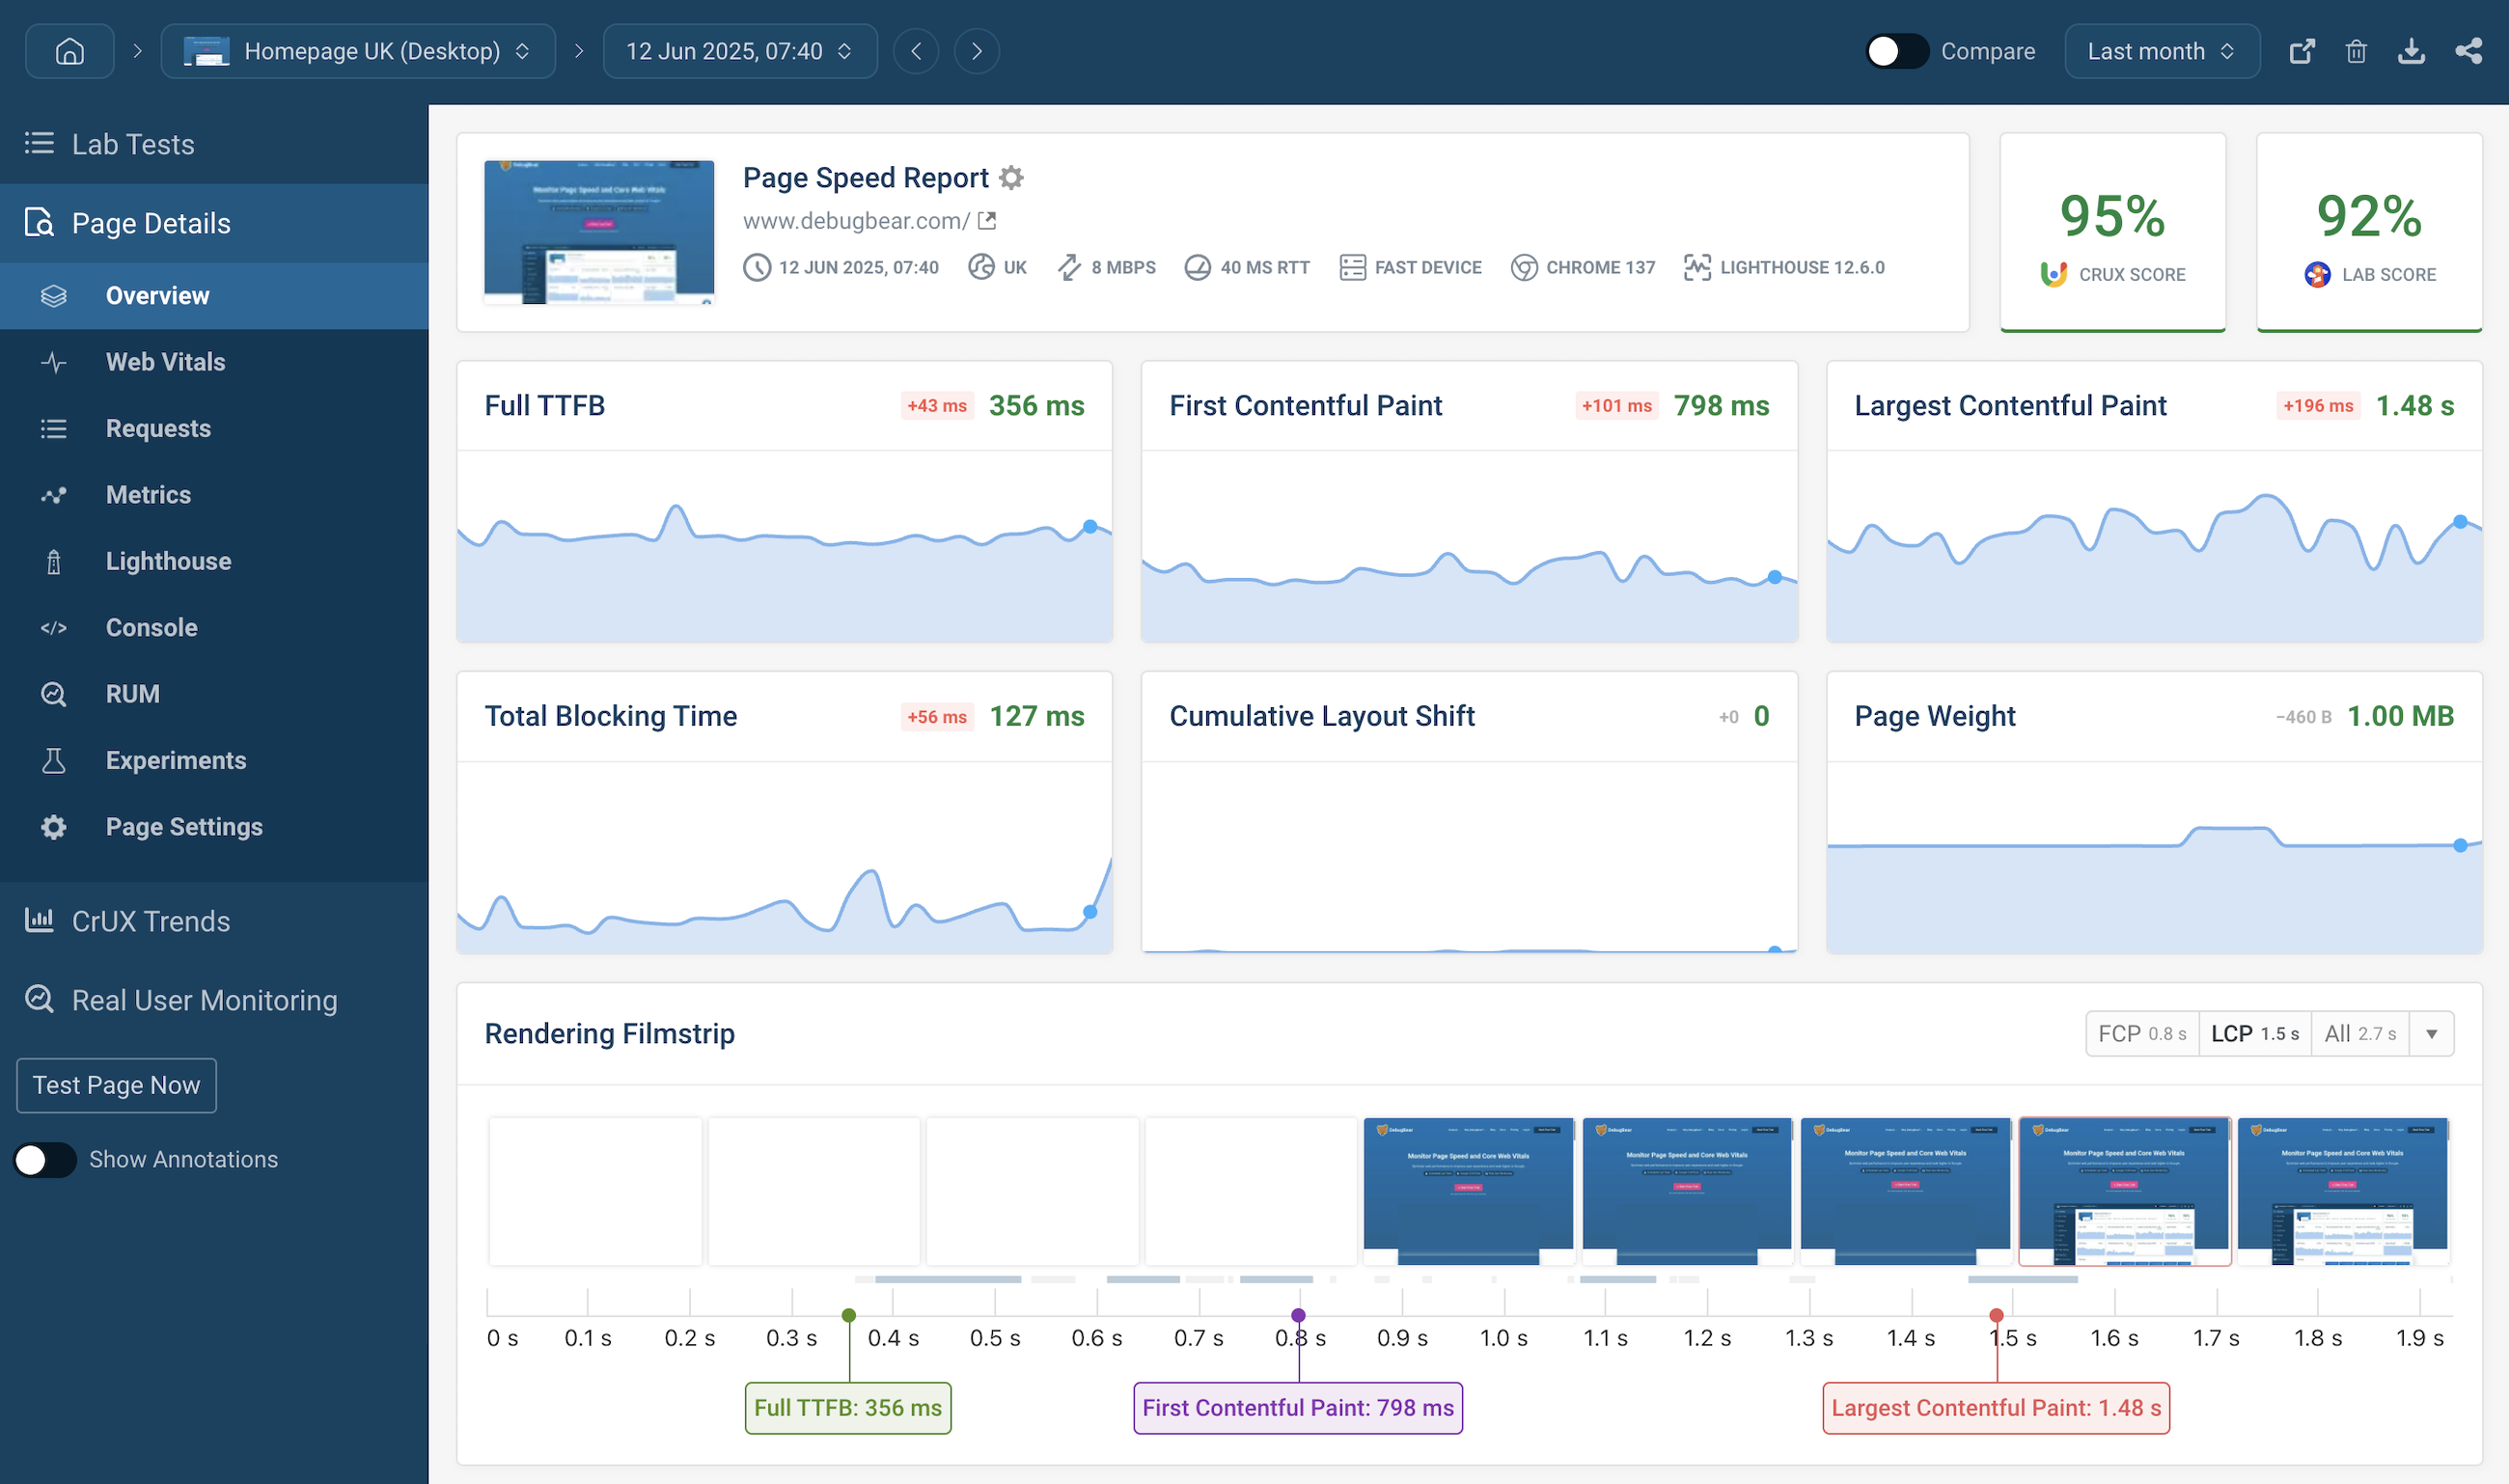
Comprehensive website performance monitoring
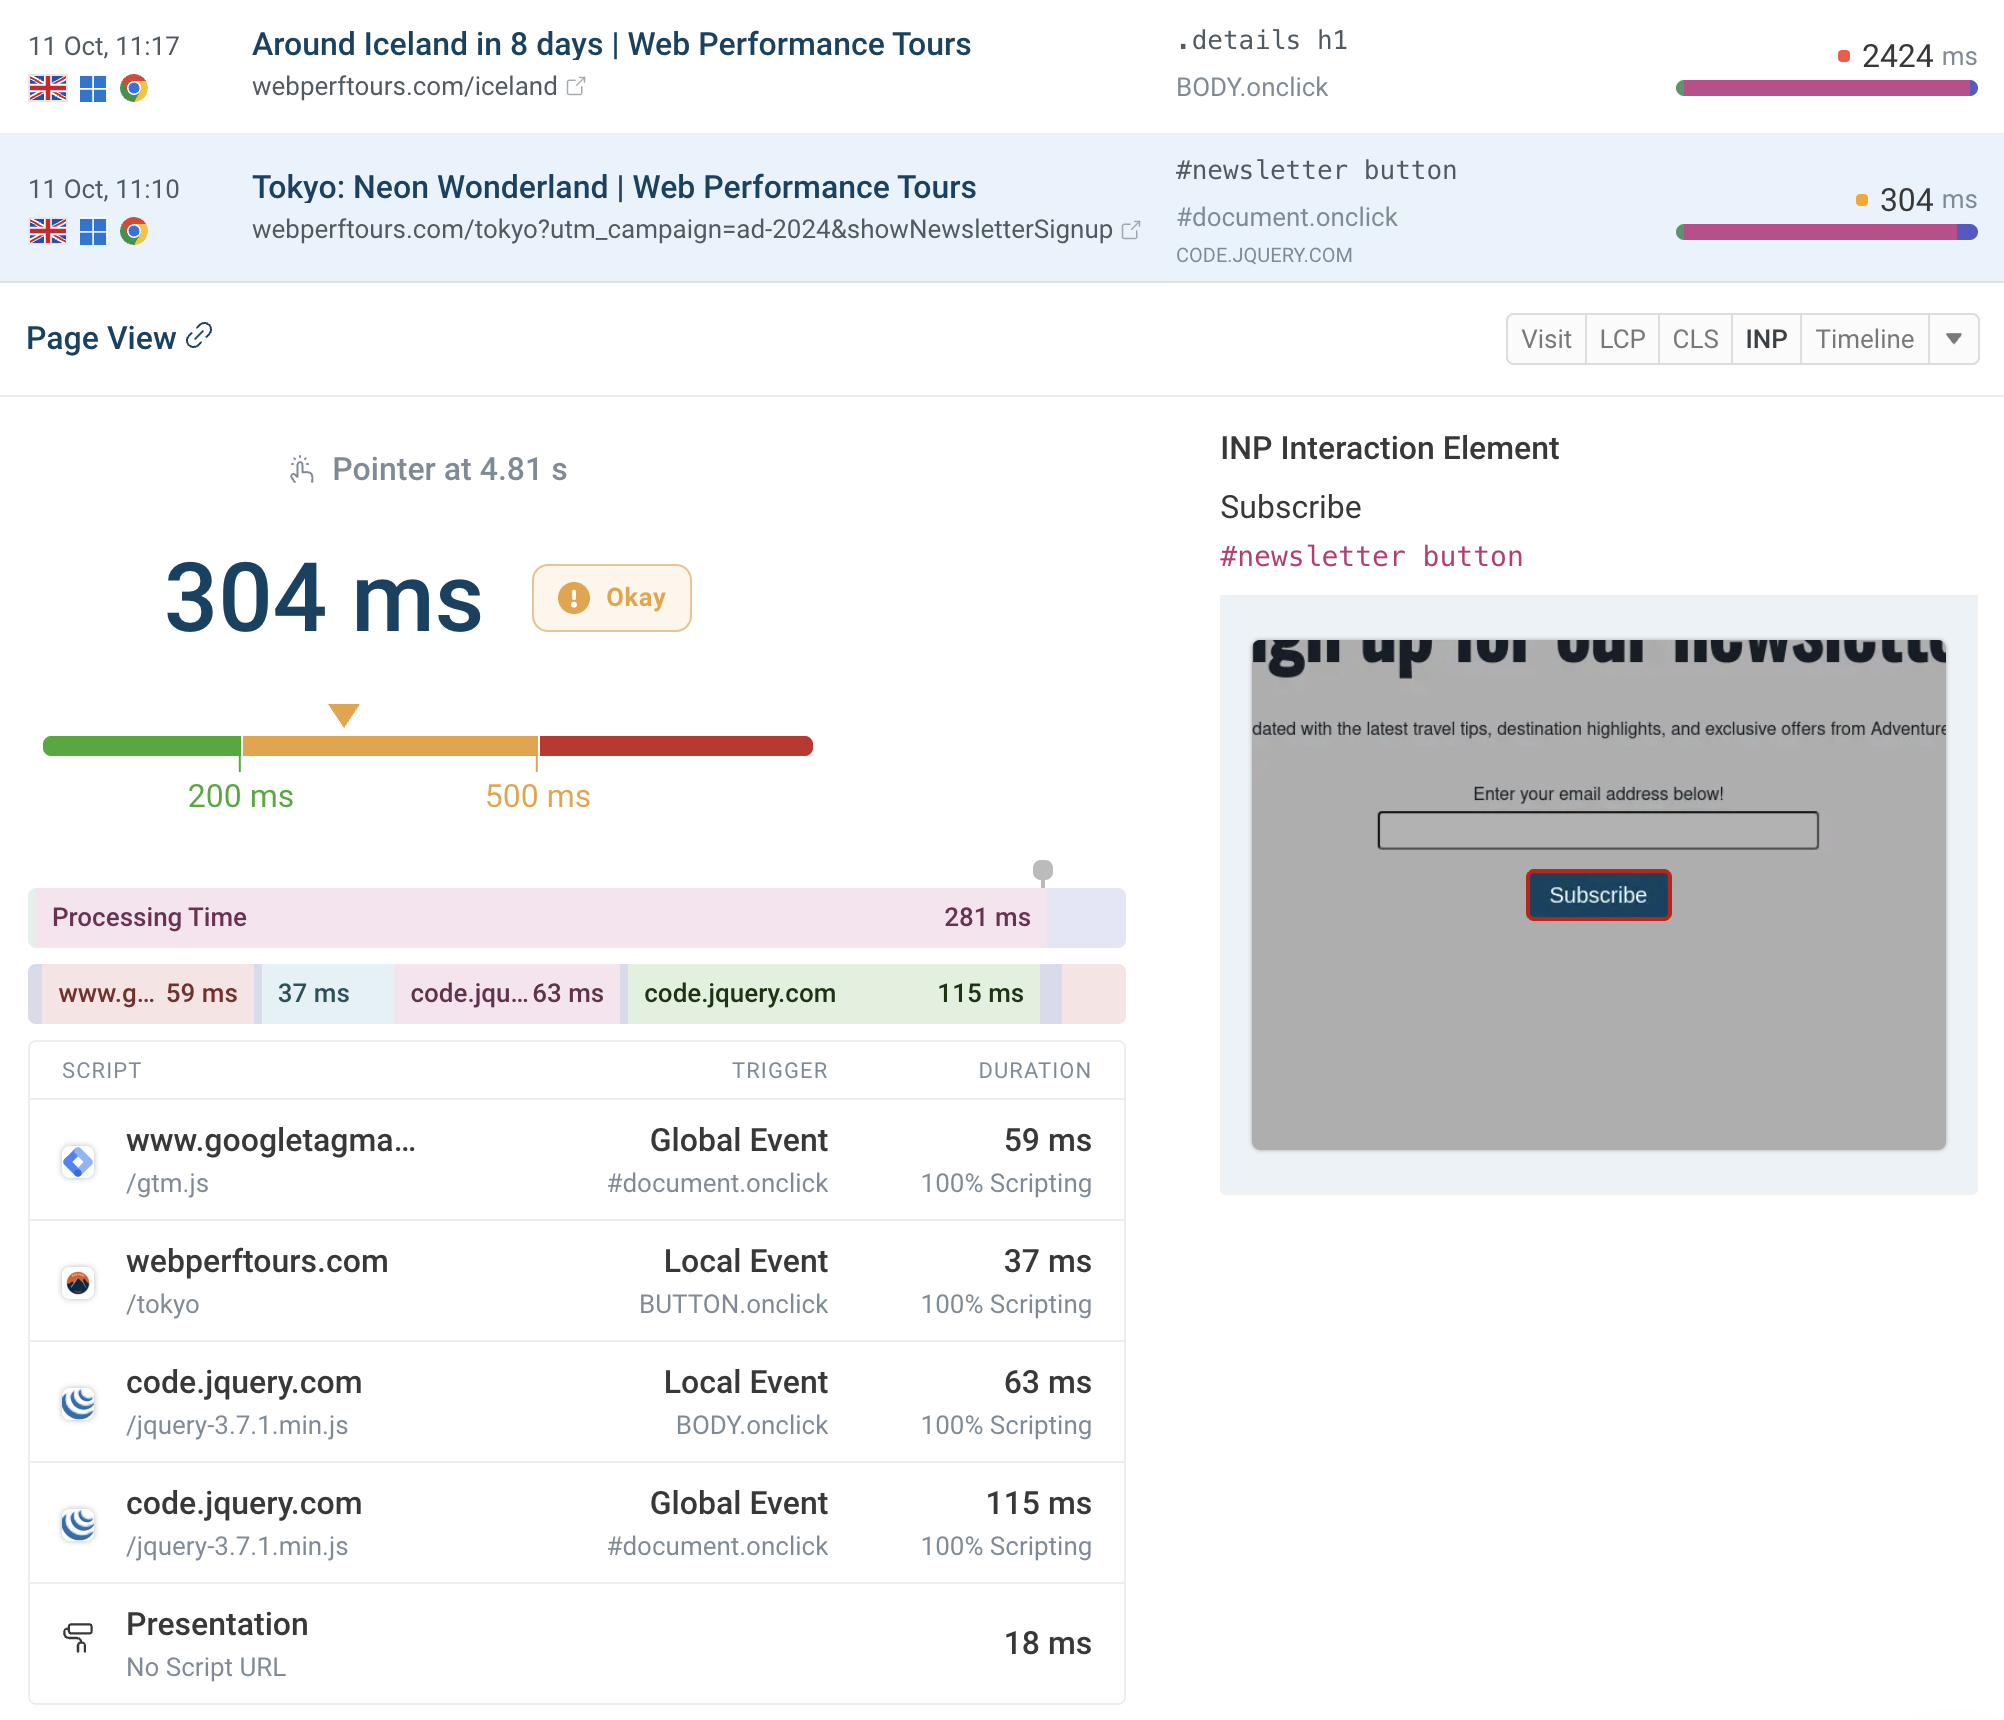
Synthetic web performance insights
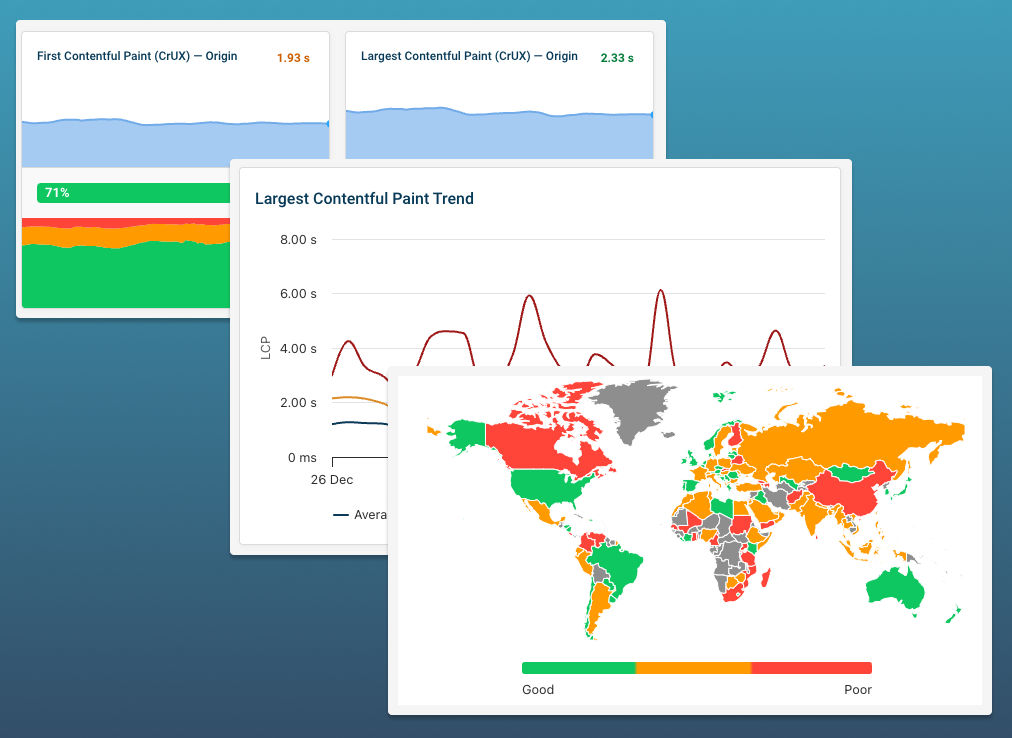
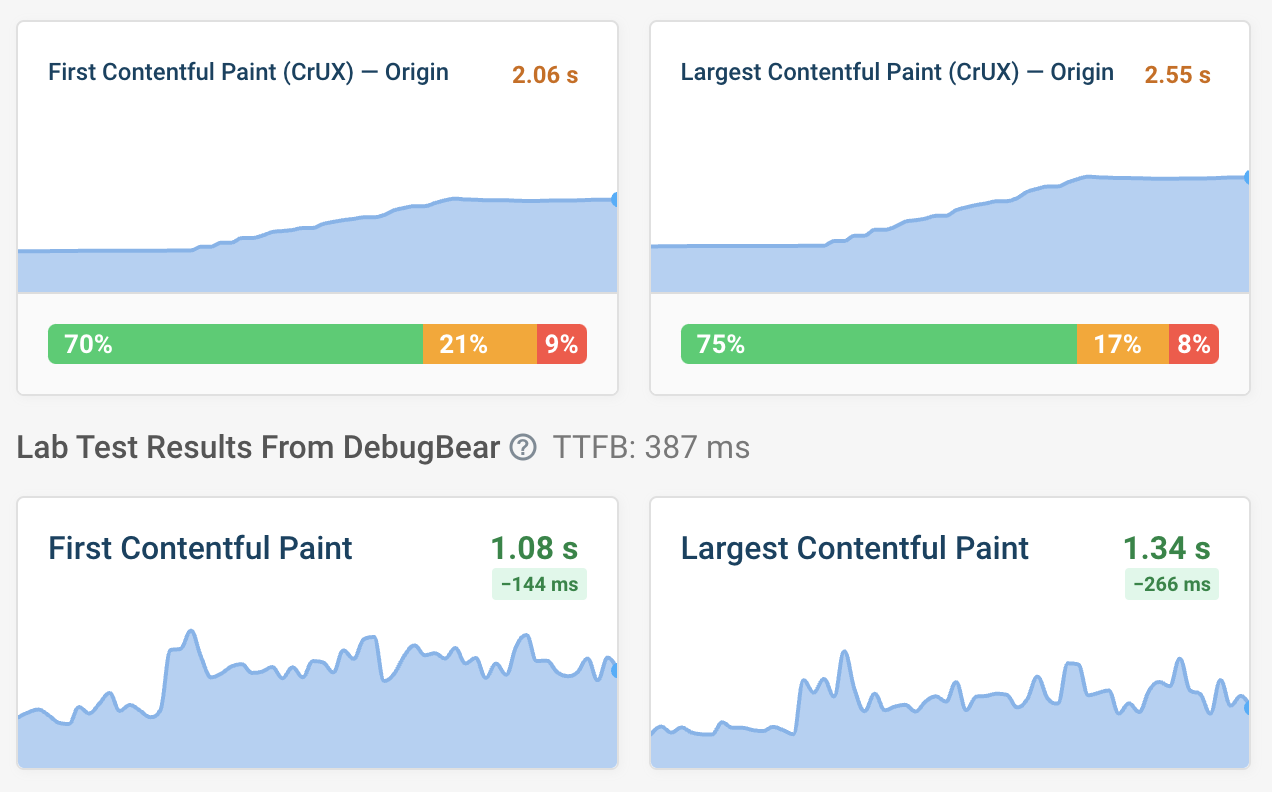
Real user web performance tracking
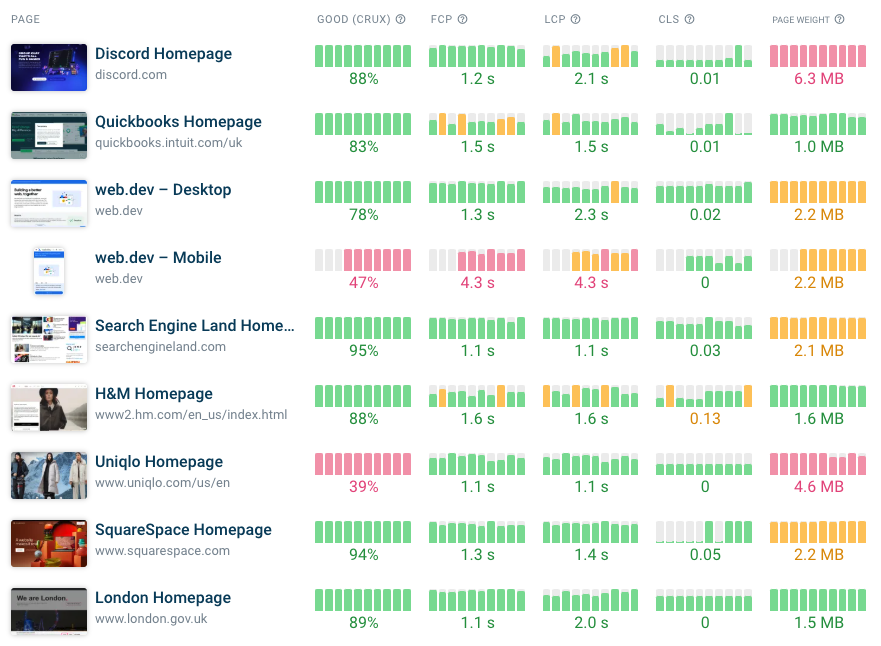
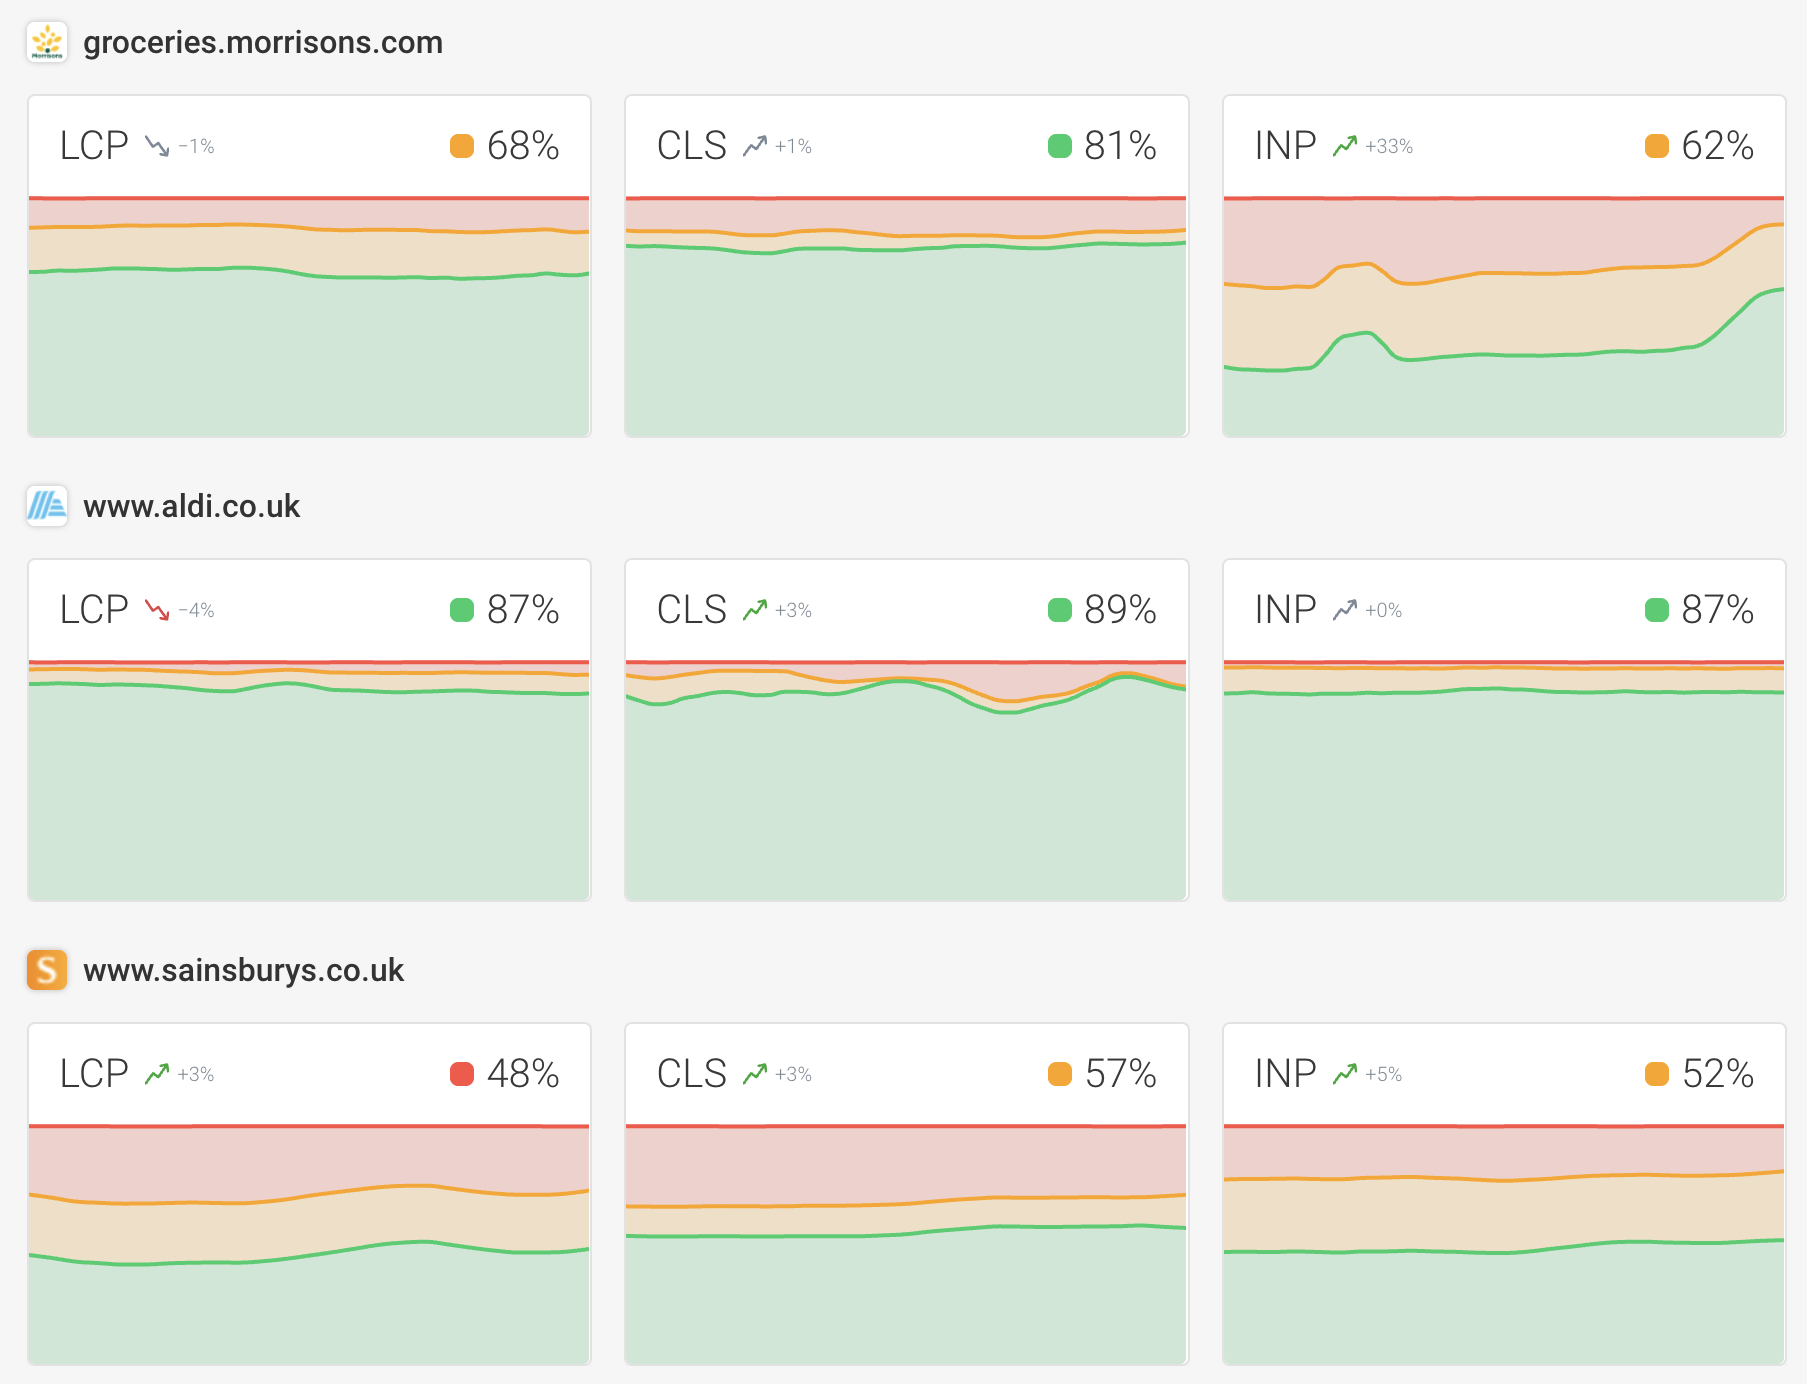
CrUX monitoring and benchmarking
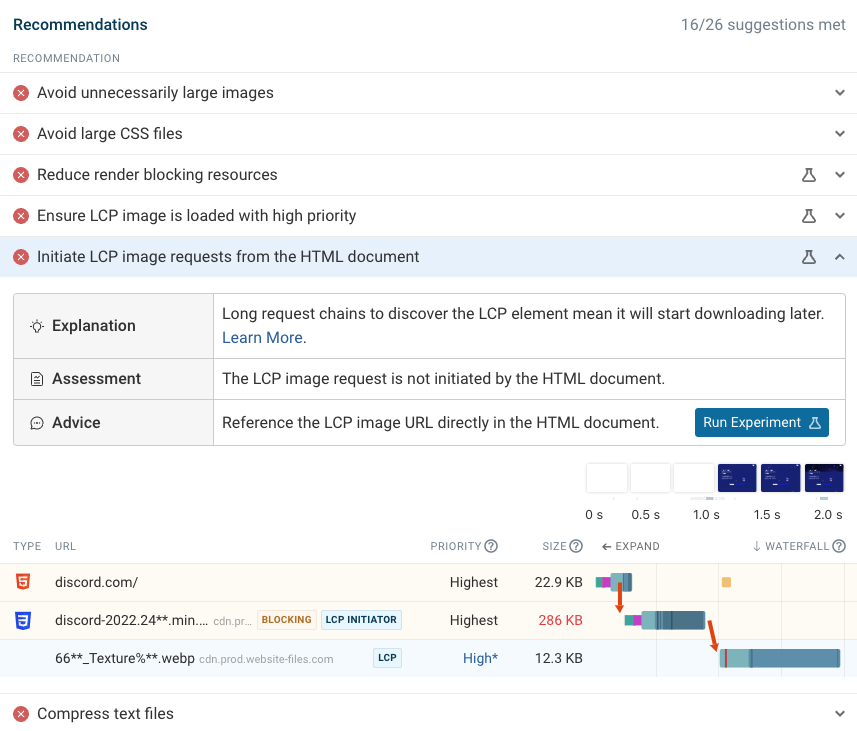
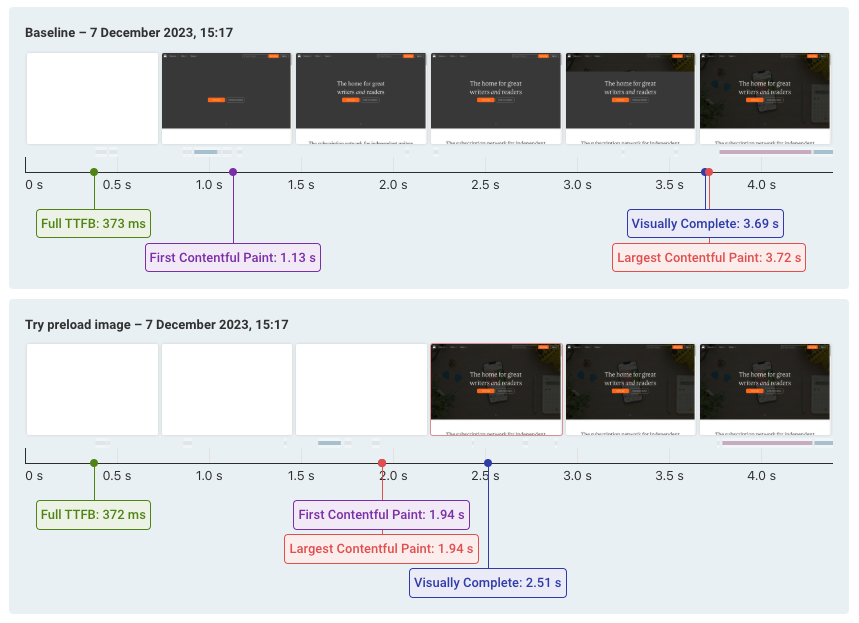
Web performance experiments
Why does website performance matter?
Make monitoring website performance a priority
You are using an old browser that is not supported anymore. You can continue using the site, but some things might not work as expected.