Lighthouse tests usually perform a non-interactive cold load. However, real users interact with the page, and load pages again with some resources already cached. User flow support in Lighthouse lets you test sites beyond the initial page load.
Scripting a user flow
Before auditing a user journey with Lighthouse you either need to record a user flow with Chrome DevTools or script one yourself.
In this tutorial we'll take the exported Puppeteer script from the previous post on the DevTools Recorder tab. It goes to the GitHub homepage, searches for "react" and then clicks the first search result.
You can find the full exported script here.
Install dependencies
The script needs Puppeteer to control a Chrome instance, and we'll use Lighthouse to audit the user flow.
Run the following commands in the folder that contains your user flow recording:
npm init -y # create node module context and track local dependencies
npm install puppeteer lighthouse
node github-search.js
This will run through the user flow – in the next steps we'll add Lighthouse auditing to it.
Starting a Lighthouse user flow audit
We'll need to make a few changes at the top of the user flow script.
const puppeteer = require('puppeteer');

(async () => {
  const browser = await puppeteer.launch();
  const page = await browser.newPage();
Replace the code above with this code:
const puppeteer = require('puppeteer');
const { startFlow } = require('lighthouse/lighthouse-core/fraggle-rock/api.js');
const fs = require("fs");

(async () => {
  const browser = await puppeteer.launch({ headless: false });
  const page = await browser.newPage();

  const flow = await startFlow(page, {
    name: 'Go to homepage',
    configContext: {
      settingsOverrides: {
        screenEmulation: {
          mobile: false,
          width: 1350,
          height: 940,
          deviceScaleFactor: 1,
          disabled: false,
        },
        formFactor: "desktop",
      },
    },
  });
This imports the modules we need and also makes sure Chrome opens a browser window rather than running in headless mode.
Then we start a new Lighthouse flow. Since we recorded the user journey on desktop we need to run the flow on desktop as well.
Also update the setViewport call to use a matching screen size:
await targetPage.setViewport({ width: 940, height: 1350 });
Before the browser.close() call at the end of the file we need to generate a report and save it as HTML.
const report = flow.generateReport();
fs.writeFileSync("report.html", report);
await browser.close();
Finally, find the list of steps in the user flow. To begin with, comment out all steps other than the first one shown below.
{
  const targetPage = page;
  const promises = [];
  promises.push(targetPage.waitForNavigation());
  await targetPage.goto("https://github.com/");
  await Promise.all(promises);
}
To capture a full Lighthouse report for the initial page, add a flow.navigate call.
{
  await flow.navigate("https://github.com/");

  const targetPage = page;
  const promises = [];
  promises.push(targetPage.waitForNavigation());
  await targetPage.goto("https://github.com/");
  await Promise.all(promises);
}
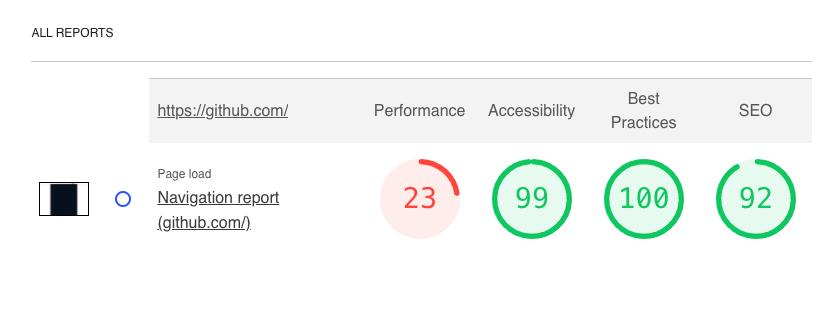
After running node github-search.js && open report.html we can see the results of a standard non-interactive Lighthouse test.
User interaction
Next, restore the following two flows steps and add:
- Call
startTimespanat the top - Call
endTimespanandsnapshotat the bottom
{
  await flow.startTimespan({ stepName: "Enter search term" });
  const targetPage = page;
  const element = await waitForSelectors(
    [
      ["aria/Search GitHub"],
      [
        "body > div.position-relative.js-header-wrapper > header > div > div.HeaderMenu.HeaderMenu--logged-out.position-fixed.top-0.right-0.bottom-0.height-fit.position-lg-relative.d-lg-flex.flex-justify-between.flex-items-center.flex-auto > div.d-lg-flex.flex-items-center.px-3.px-lg-0.text-center.text-lg-left > div.d-lg-flex.min-width-0.mb-3.mb-lg-0 > div > div > form > label > input.form-control.input-sm.header-search-input.jump-to-field.js-jump-to-field.js-site-search-focus.js-navigation-enable.jump-to-field-active.jump-to-dropdown-visible",
      ],
    ],
    targetPage
  );
  await element.click({ offset: { x: 74.5, y: 24 } });
}
{
  const targetPage = page;
  const element = await waitForSelectors(
    [
      ["aria/Search GitHub"],
      [
        "body > div.position-relative.js-header-wrapper > header > div > div.HeaderMenu.HeaderMenu--logged-out.position-fixed.top-0.right-0.bottom-0.height-fit.position-lg-relative.d-lg-flex.flex-justify-between.flex-items-center.flex-auto > div.d-lg-flex.flex-items-center.px-3.px-lg-0.text-center.text-lg-left > div.d-lg-flex.min-width-0.mb-3.mb-lg-0 > div > div > form > label > input.form-control.input-sm.header-search-input.jump-to-field.js-jump-to-field.js-site-search-focus.js-navigation-enable.jump-to-field-active.jump-to-dropdown-visible",
      ],
    ],
    targetPage
  );
  const type = await element.evaluate((el) => el.type);
  if (
    [
      "textarea",
      "select-one",
      "text",
      "url",
      "tel",
      "search",
      "password",
      "number",
      "email",
    ].includes(type)
  ) {
    await element.type("react");
  } else {
    await element.focus();
    await element.evaluate((el, value) => {
      el.value = value;
      el.dispatchEvent(new Event("input", { bubbles: true }));
      el.dispatchEvent(new Event("change", { bubbles: true }));
    }, "react");
  }

  await flow.endTimespan();
  await flow.snapshot({ stepName: "Search term entered" });
}
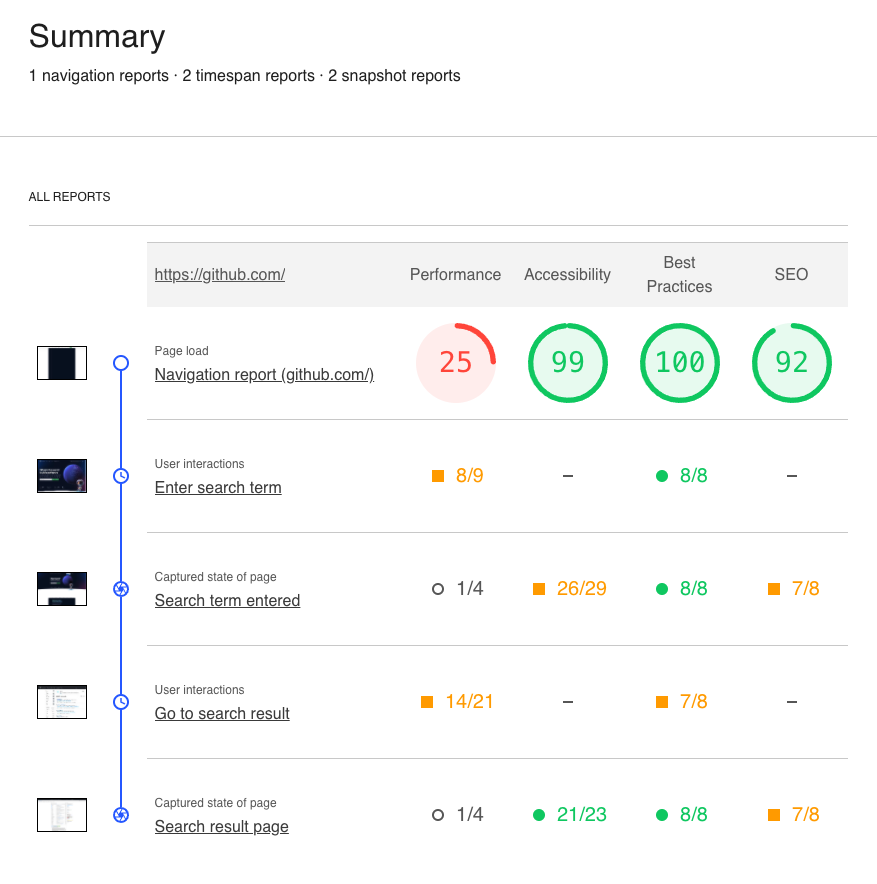
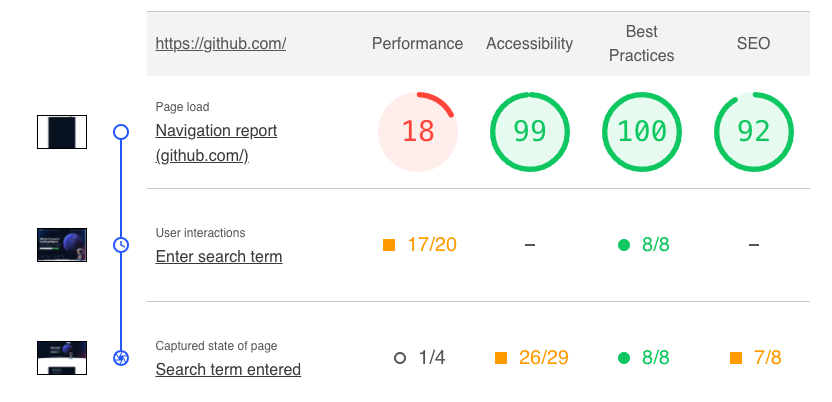
The Lighthouse report now contains a timespan entry and a snapshot entry.
Before looking at these results in more detail, let's apply the same change to the last two steps:
{
  await flow.startTimespan({ stepName: "Go to search result" });

  const targetPage = page;
  const promises = [];
  promises.push(targetPage.waitForNavigation());
  const element = await waitForSelectors(
    [
      ["aria/react"],
      [
        "#jump-to-suggestion-search-global > a > div.jump-to-suggestion-name.js-jump-to-suggestion-name.flex-auto.overflow-hidden.text-left.no-wrap.css-truncate.css-truncate-target",
      ],
    ],
    targetPage
  );
  await element.click({ offset: { x: 41.5, y: 4 } });
  await Promise.all(promises);
}
{
  const targetPage = page;
  const promises = [];
  promises.push(targetPage.waitForNavigation());
  const element = await waitForSelectors(
    [
      ["aria/facebook/react"],
      [
        "#js-pjax-container > div > div.col-12.col-md-9.float-left.px-2.pt-3.pt-md-0.codesearch-results > div > ul > li:nth-child(1) > div.mt-n1.flex-auto > div.d-flex > div > a",
      ],
    ],
    targetPage
  );
  await element.click({ offset: { x: 62.5, y: 12.21875 } });
  await Promise.all(promises);

  await flow.endTimespan();
  await flow.snapshot({ stepName: "Search result page" });
}
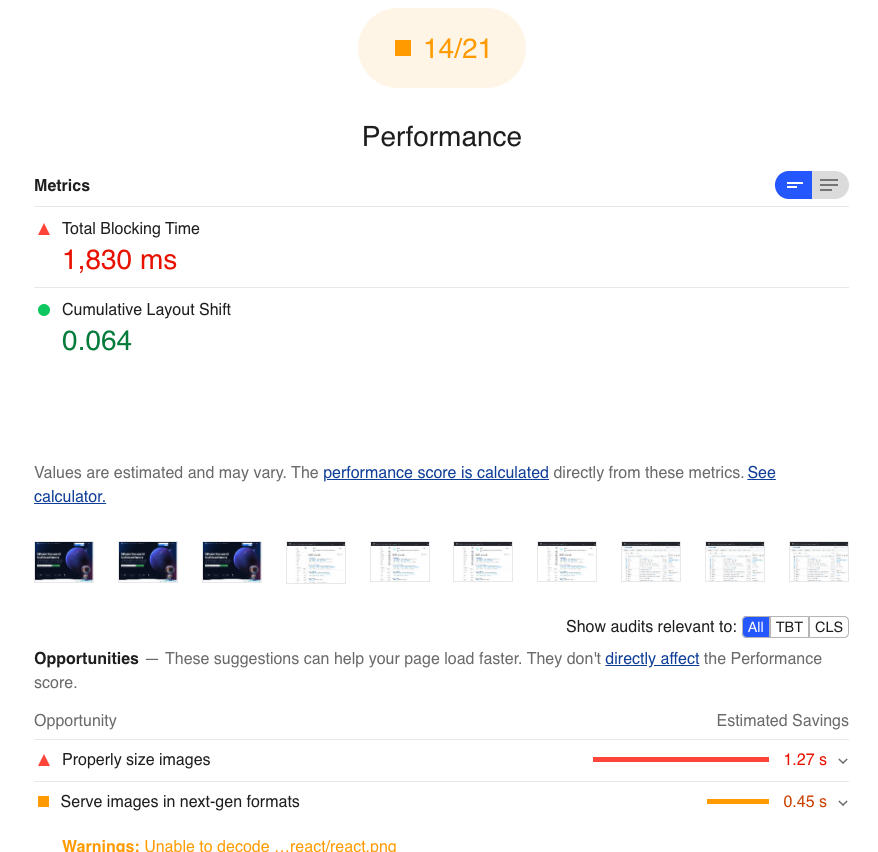
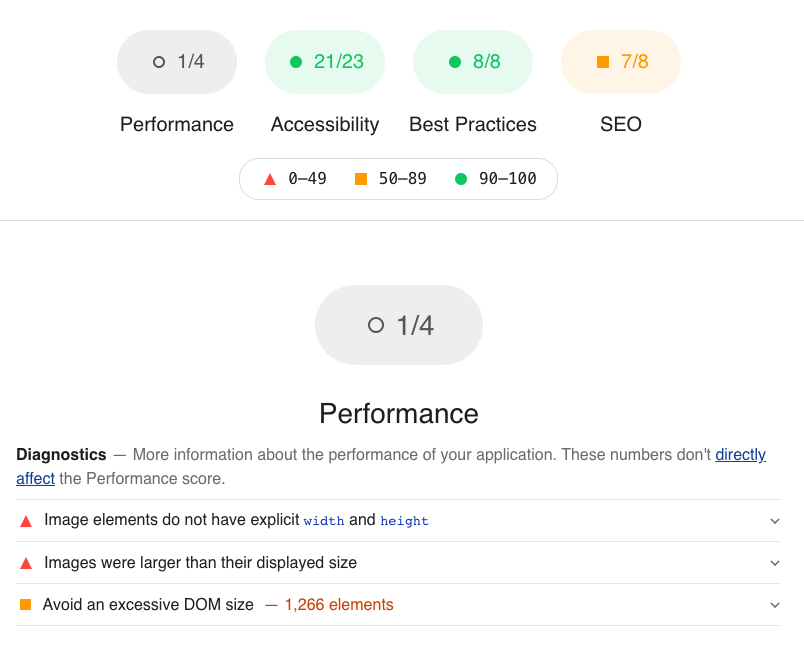
The timespan view now shows a filmstrip of the navigation, as well as layout shifts and blocking time collected along the way. Timespan recordings allow us to see whether user interaction after the initial load causes performance issues.
The snapshot view doesn't show much performance data, but provides the Accessibilty and SEO audits for the page. Capturing a snapshot after simulating user interaction makes it possible to discover problems in the modified post-interaction DOM.
Click here to view the final Lighthouse user flow script.
Conclusion
User flow support in Lighthouse is still in development, and you'll likely run into some issues. For example, when trying to collect a timespan during the initial load this broke some of the later Puppeteer interaction for me.
Being able to test user journeys with Lighthouse will help create more realistic tests that uncover layout shift and accessibility issues that are currently hidden.