The developer tools that ship with Chrome or other browsers are very helpful when developing and testing your websites. However, when you encounter mobile-specific issues that you can’t replicate on your desktop or laptop, these developer tools become less helpful. That's where remote debugging comes in.
Remote debugging allows you to run your website natively on a mobile device while still using your main computer for testing and debugging. This way you can find and fix bugs that only occur on real mobile devices. Remote debugging is also useful for seeing how your site performs on mobile data networks and on devices that might not be as powerful as your development machine.
This article explains how to integrate remote debugging into your development workflow to investigate mobile issues on your site.
What is remote debugging?
Remote debugging allows you to debug your website code running on a mobile device while still using the developer tools you are familiar with on your desktop.
Testing your code on an actual mobile device rather than an emulator is especially important if you're developing complex touch interactions or performance-intensive web applications. This might help you uncover performance concerns that you have to address or debug an interaction that doesn't quite work the same as it does on desktop.
In addition, as mobile devices often run on cellular data networks, using a real device not connected to Wi-Fi will let you see how your site performs in poor network conditions.
If you require the user to download a large amount of data to display your page, you can see how much slower it is on an actual phone compared to a laptop.
How to set up remote debugging in Chrome
To get started using remote debugging you'll need two things:
- A mobile device running Android that you can connect to via USB. This article focuses on Android because Chrome on iOS is currently based on WKWebView, which is very similar to Safari. Note that this might change in the future.
- A laptop or desktop machine on which you'll do the actual debugging.
If you've never connected these two devices before, there are a few additional steps you'll need to take:
- Make sure that developer options are enabled on the mobile device. The steps for enabling this vary based on your phone
- On your Android device, make sure the USB debugging option is enabled. You'll find this under Developer options once developer mode is enabled.
Once you have both of these enabled, open Chrome on your connected computer, open a new tab, and navigate to chrome://inspect/#devices via your URL bar. After doing this you should see your phone listed along with all the tabs you currently have open on that device.
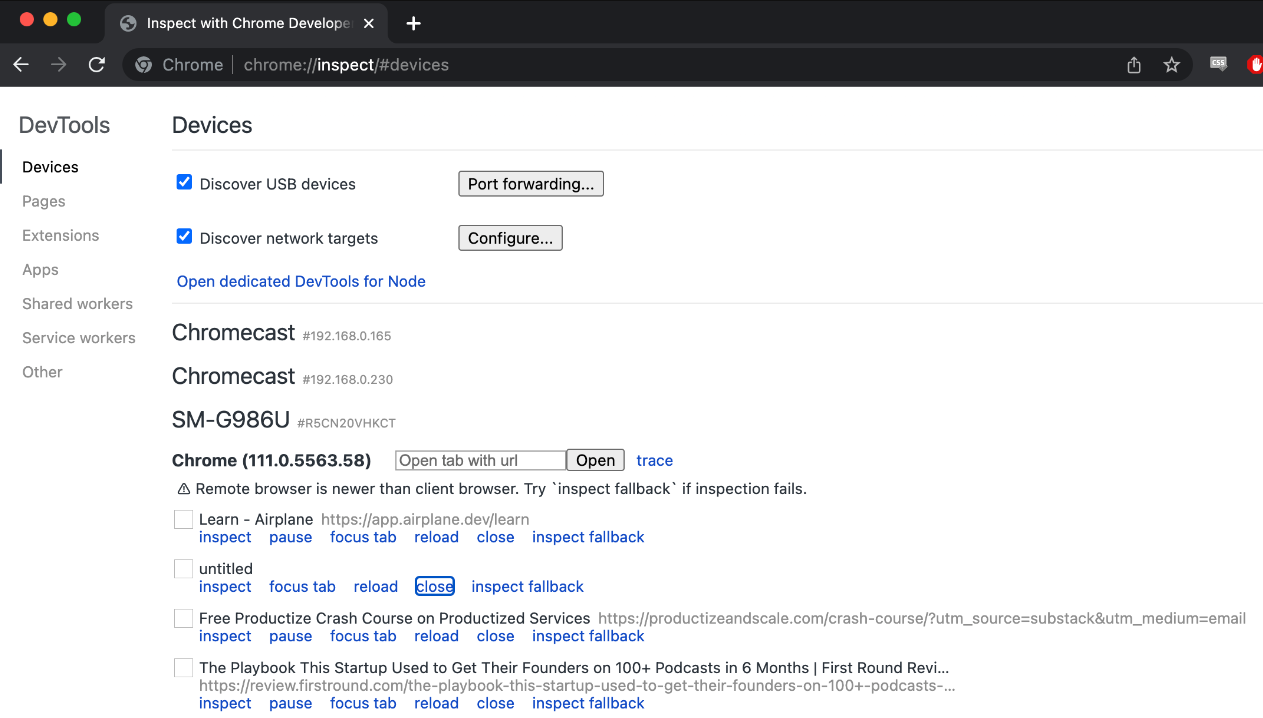
If you click inspect on one of these tabs, Developer Tools will open in the remote debugging view. This displays the website as it appears on your device, along with all the usual developer tools.
If you interact with the page in the developer tools in any way (such as scrolling, clicking, or modifying elements in the DOM), the page on your mobile device should register the exact same interaction.
How to debug a site with remote debugging
Now that you have configured remote debugging, you can use your mobile device to chase down some bugs.
You may notice that the interface looks similar to using Chrome's "responsive" view. However, debugging a site using remote debugging is different because the code runs on the actual device rather than being emulated. This allows you to catch more mobile-specific issues that you might not be able to replicate in an emulated mobile environment.
The following sections highlight some examples of issues you might encounter when debugging a mobile website.
Debugging issues caused by slow network requests
Depending on how your website is built, you might notice a significant performance difference on mobile devices. If your assets take longer to load on a mobile connection, they may not be available by the time your code tries to use them. If your users are on a very slow connection, things like API requests might start timing out entirely.
Debugging performance directly on the device is a valuable tool for optimizing your site's mobile experience. Using your phone’s actual internet connection gives you a more accurate picture of what a user on a mobile device will experience as your site loads. Emulating a mobile device on a more powerful developer machine may not provide an experience similar to that on a real mobile device.
When you're trying to debug your site on a cellular network, make sure the Wi-Fi on your phone is turned off. You won't get any of the benefits of testing mobile network connectivity directly if you're still connected to Wi-Fi.
Once you have confirmed that your Wi-Fi is off, head over to the Network tab of Chrome DevTools. When you reload the page, you'll see the page reload on your device. You'll also start to see network requests being made.
After the page fully loads, the metrics at the bottom of the Network tab will populate with load time statistics that you can compare with the desktop version of your site. In addition, it's useful to check which resources loaded the slowest and if any were significantly slower than on a desktop:
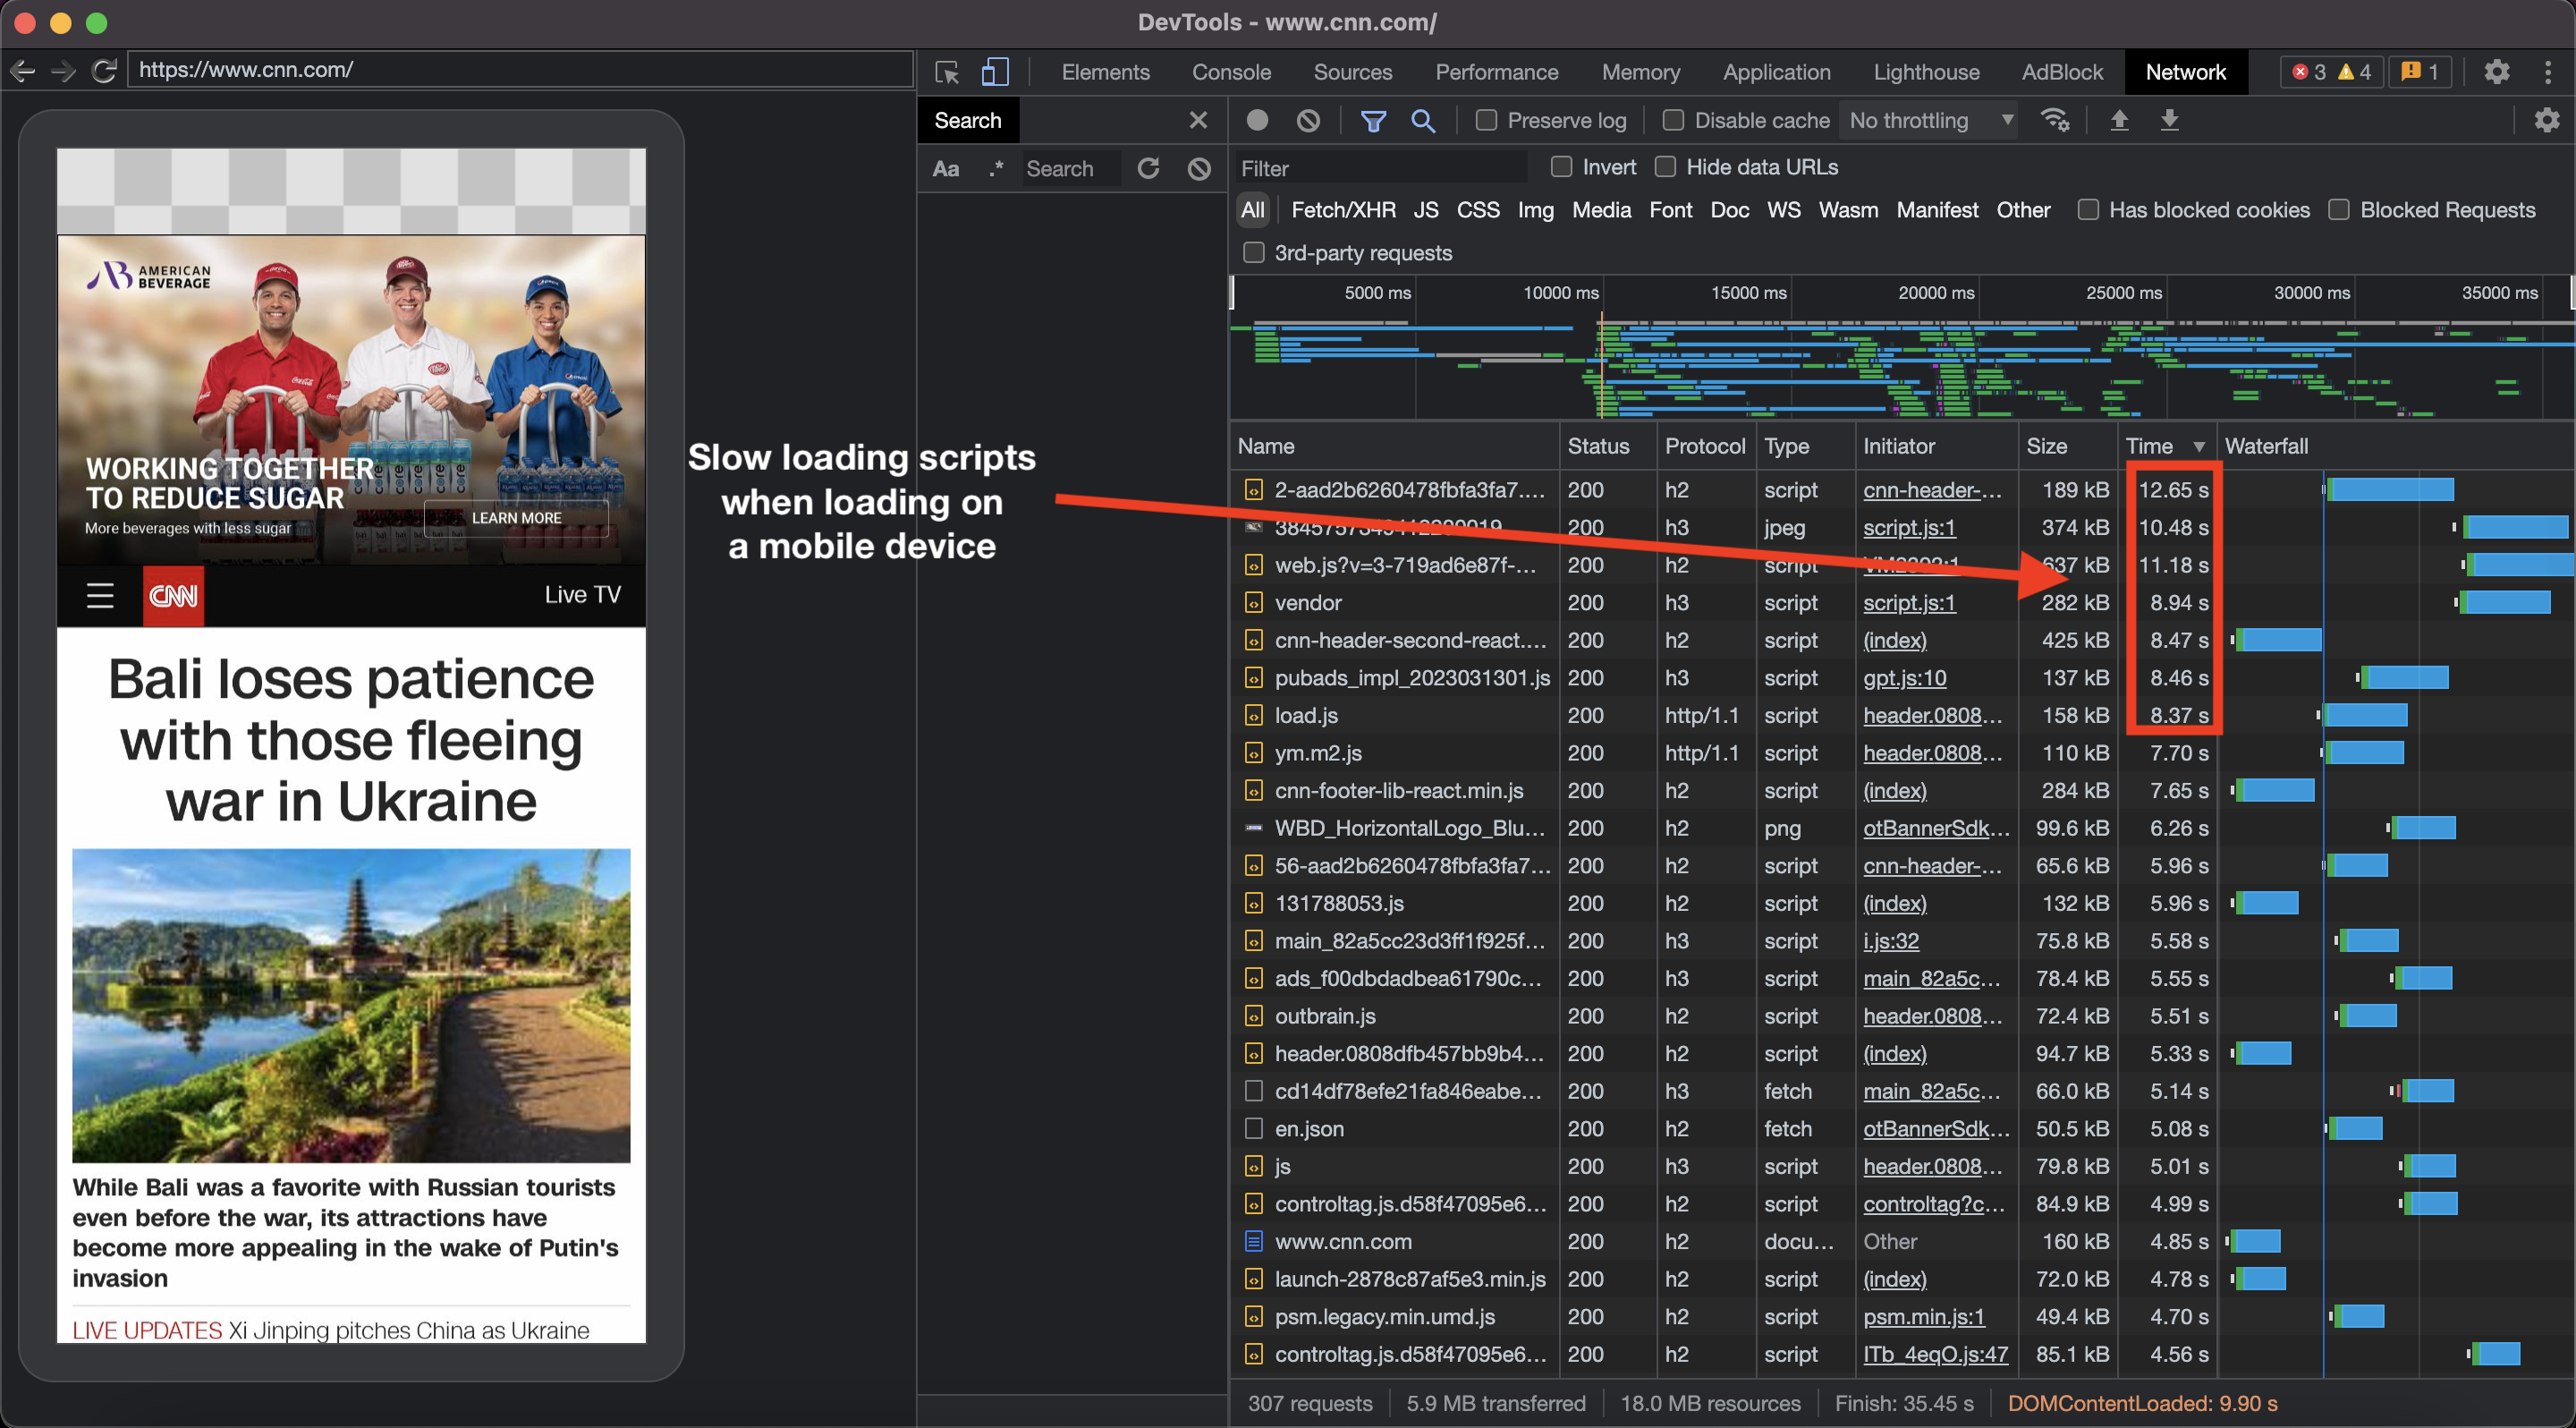
You can use this information to start improving the performance of your site on mobile. It's also helpful for debugging any issues related to the asset loading order or assets loading slowly and breaking other parts of your site.
Debugging device-specific styling issues
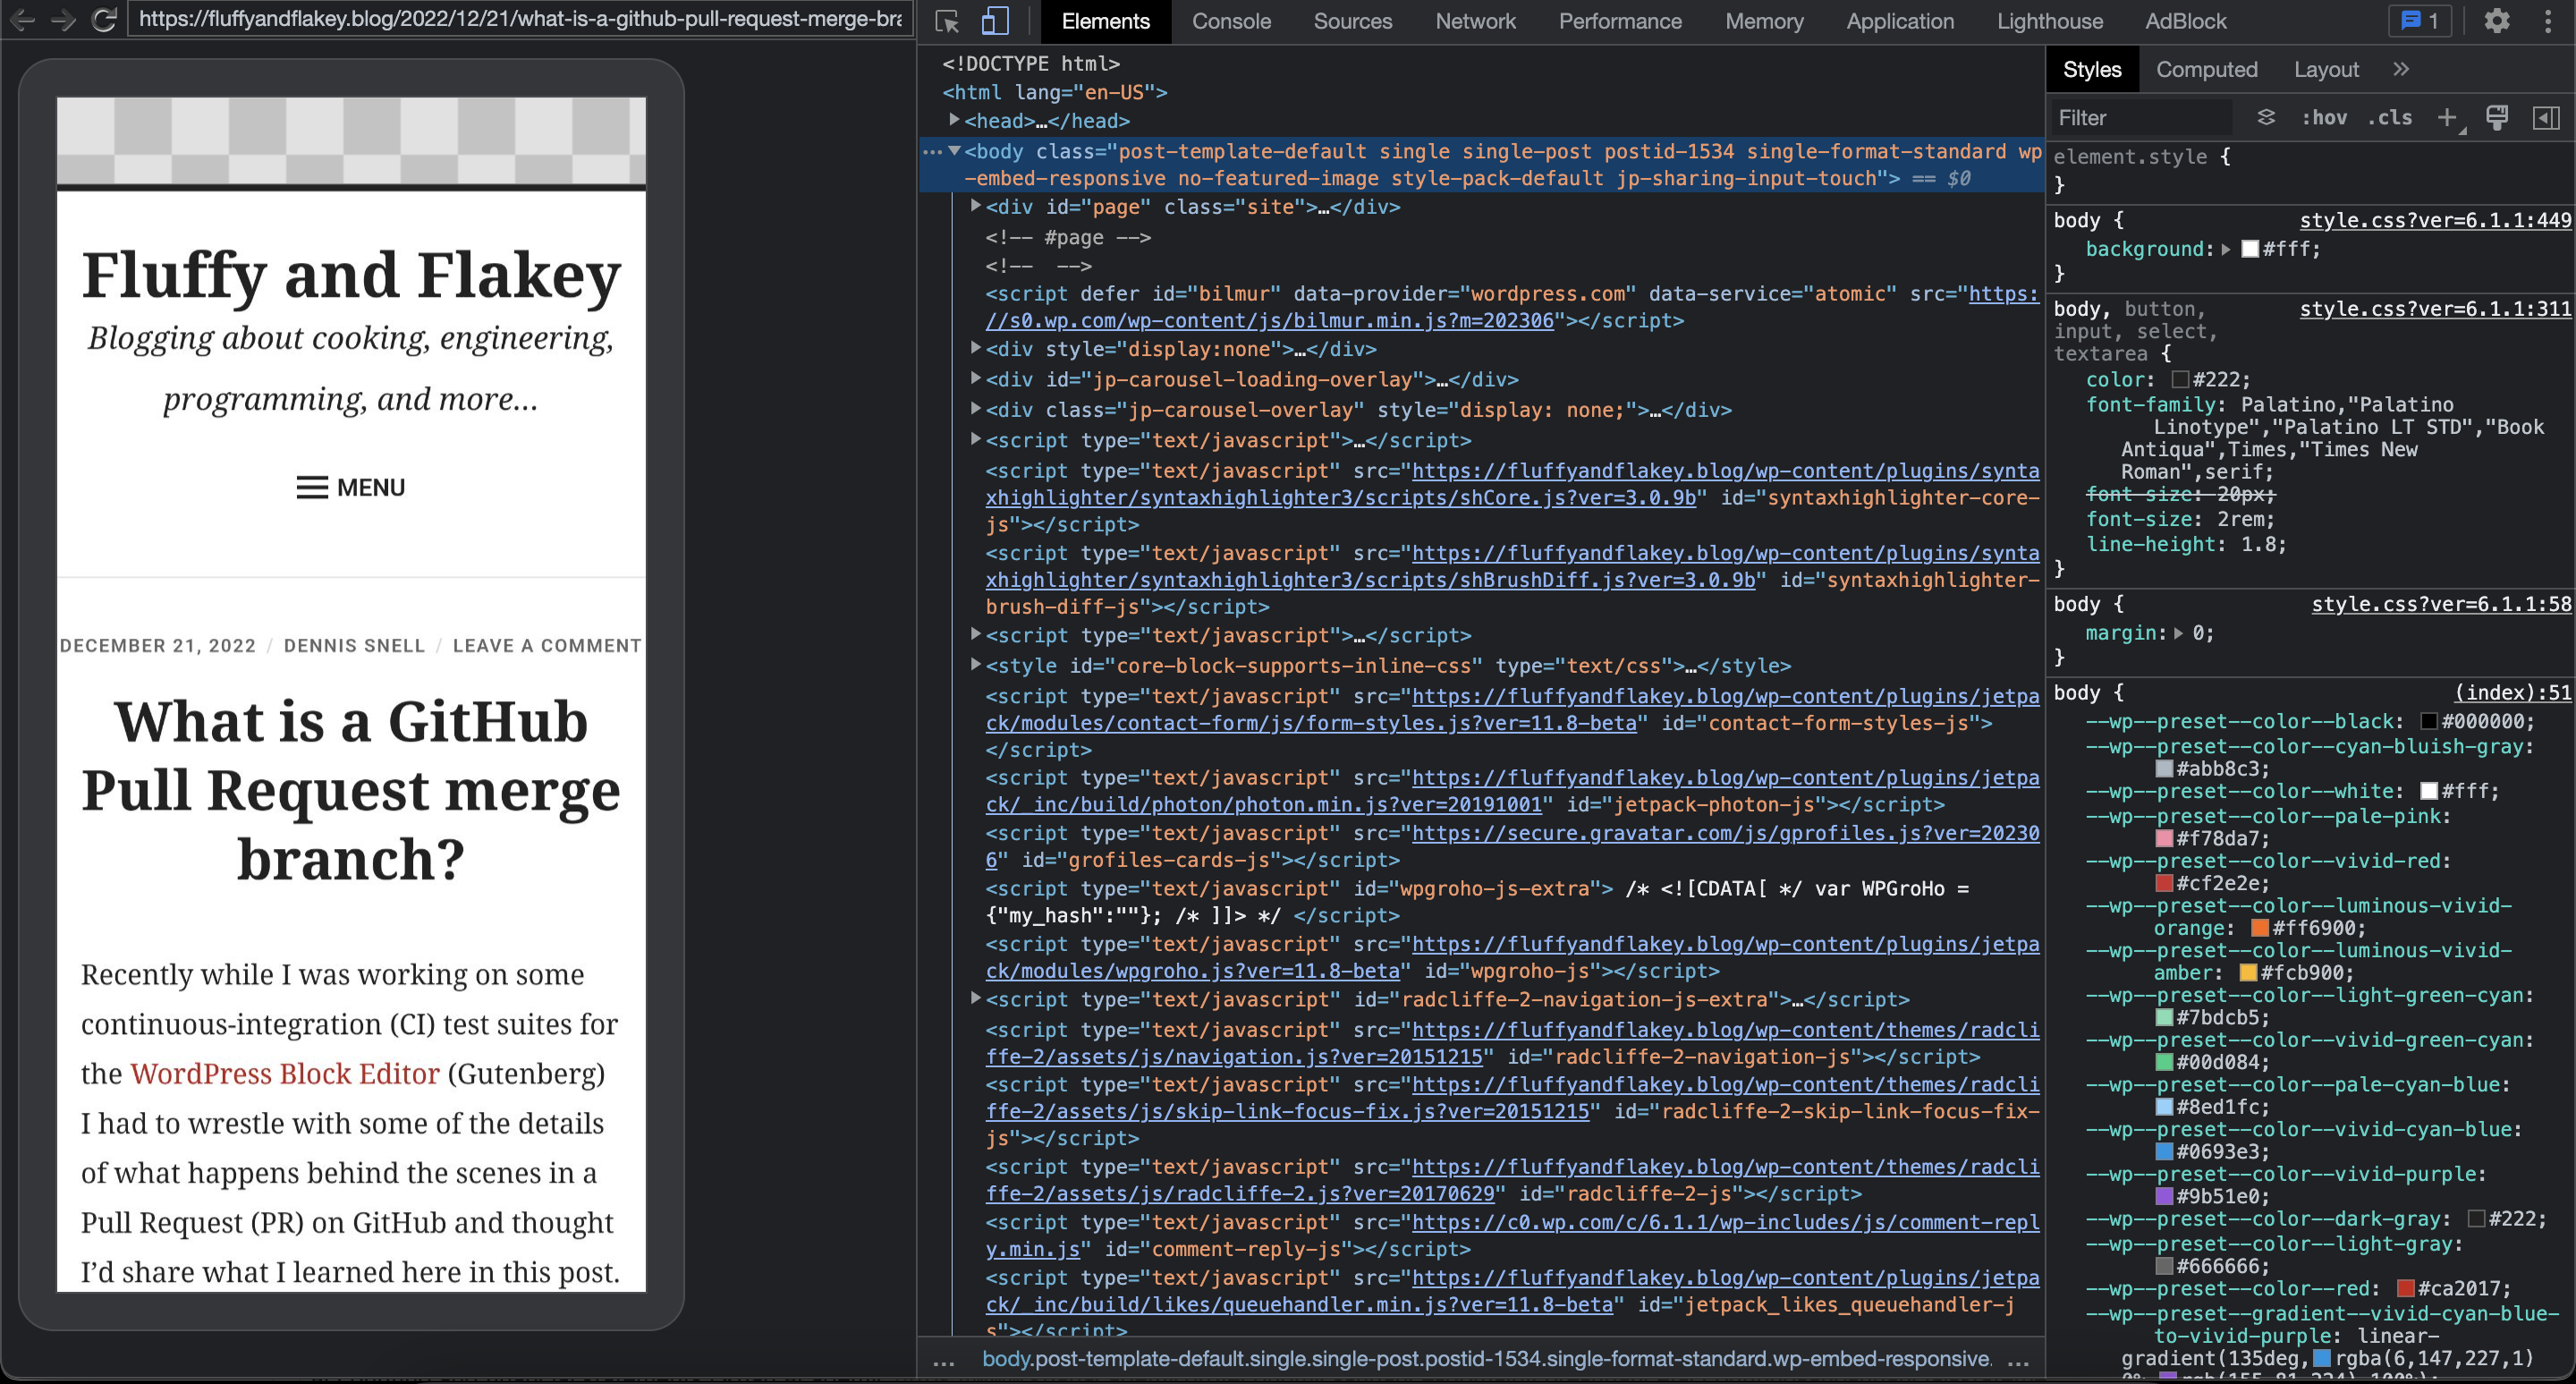
Some styling bugs, for whatever reason, only exist on an actual mobile device. For example, your page might be horizontally scrolling when it's not supposed to. Using the Elements tab of Chrome DevTools, you'll be able to inspect the DOM and find which elements are causing you problems. As with the desktop version of DevTools, you can remove elements, modify the DOM directly, and move things around to get to the root of your issue:
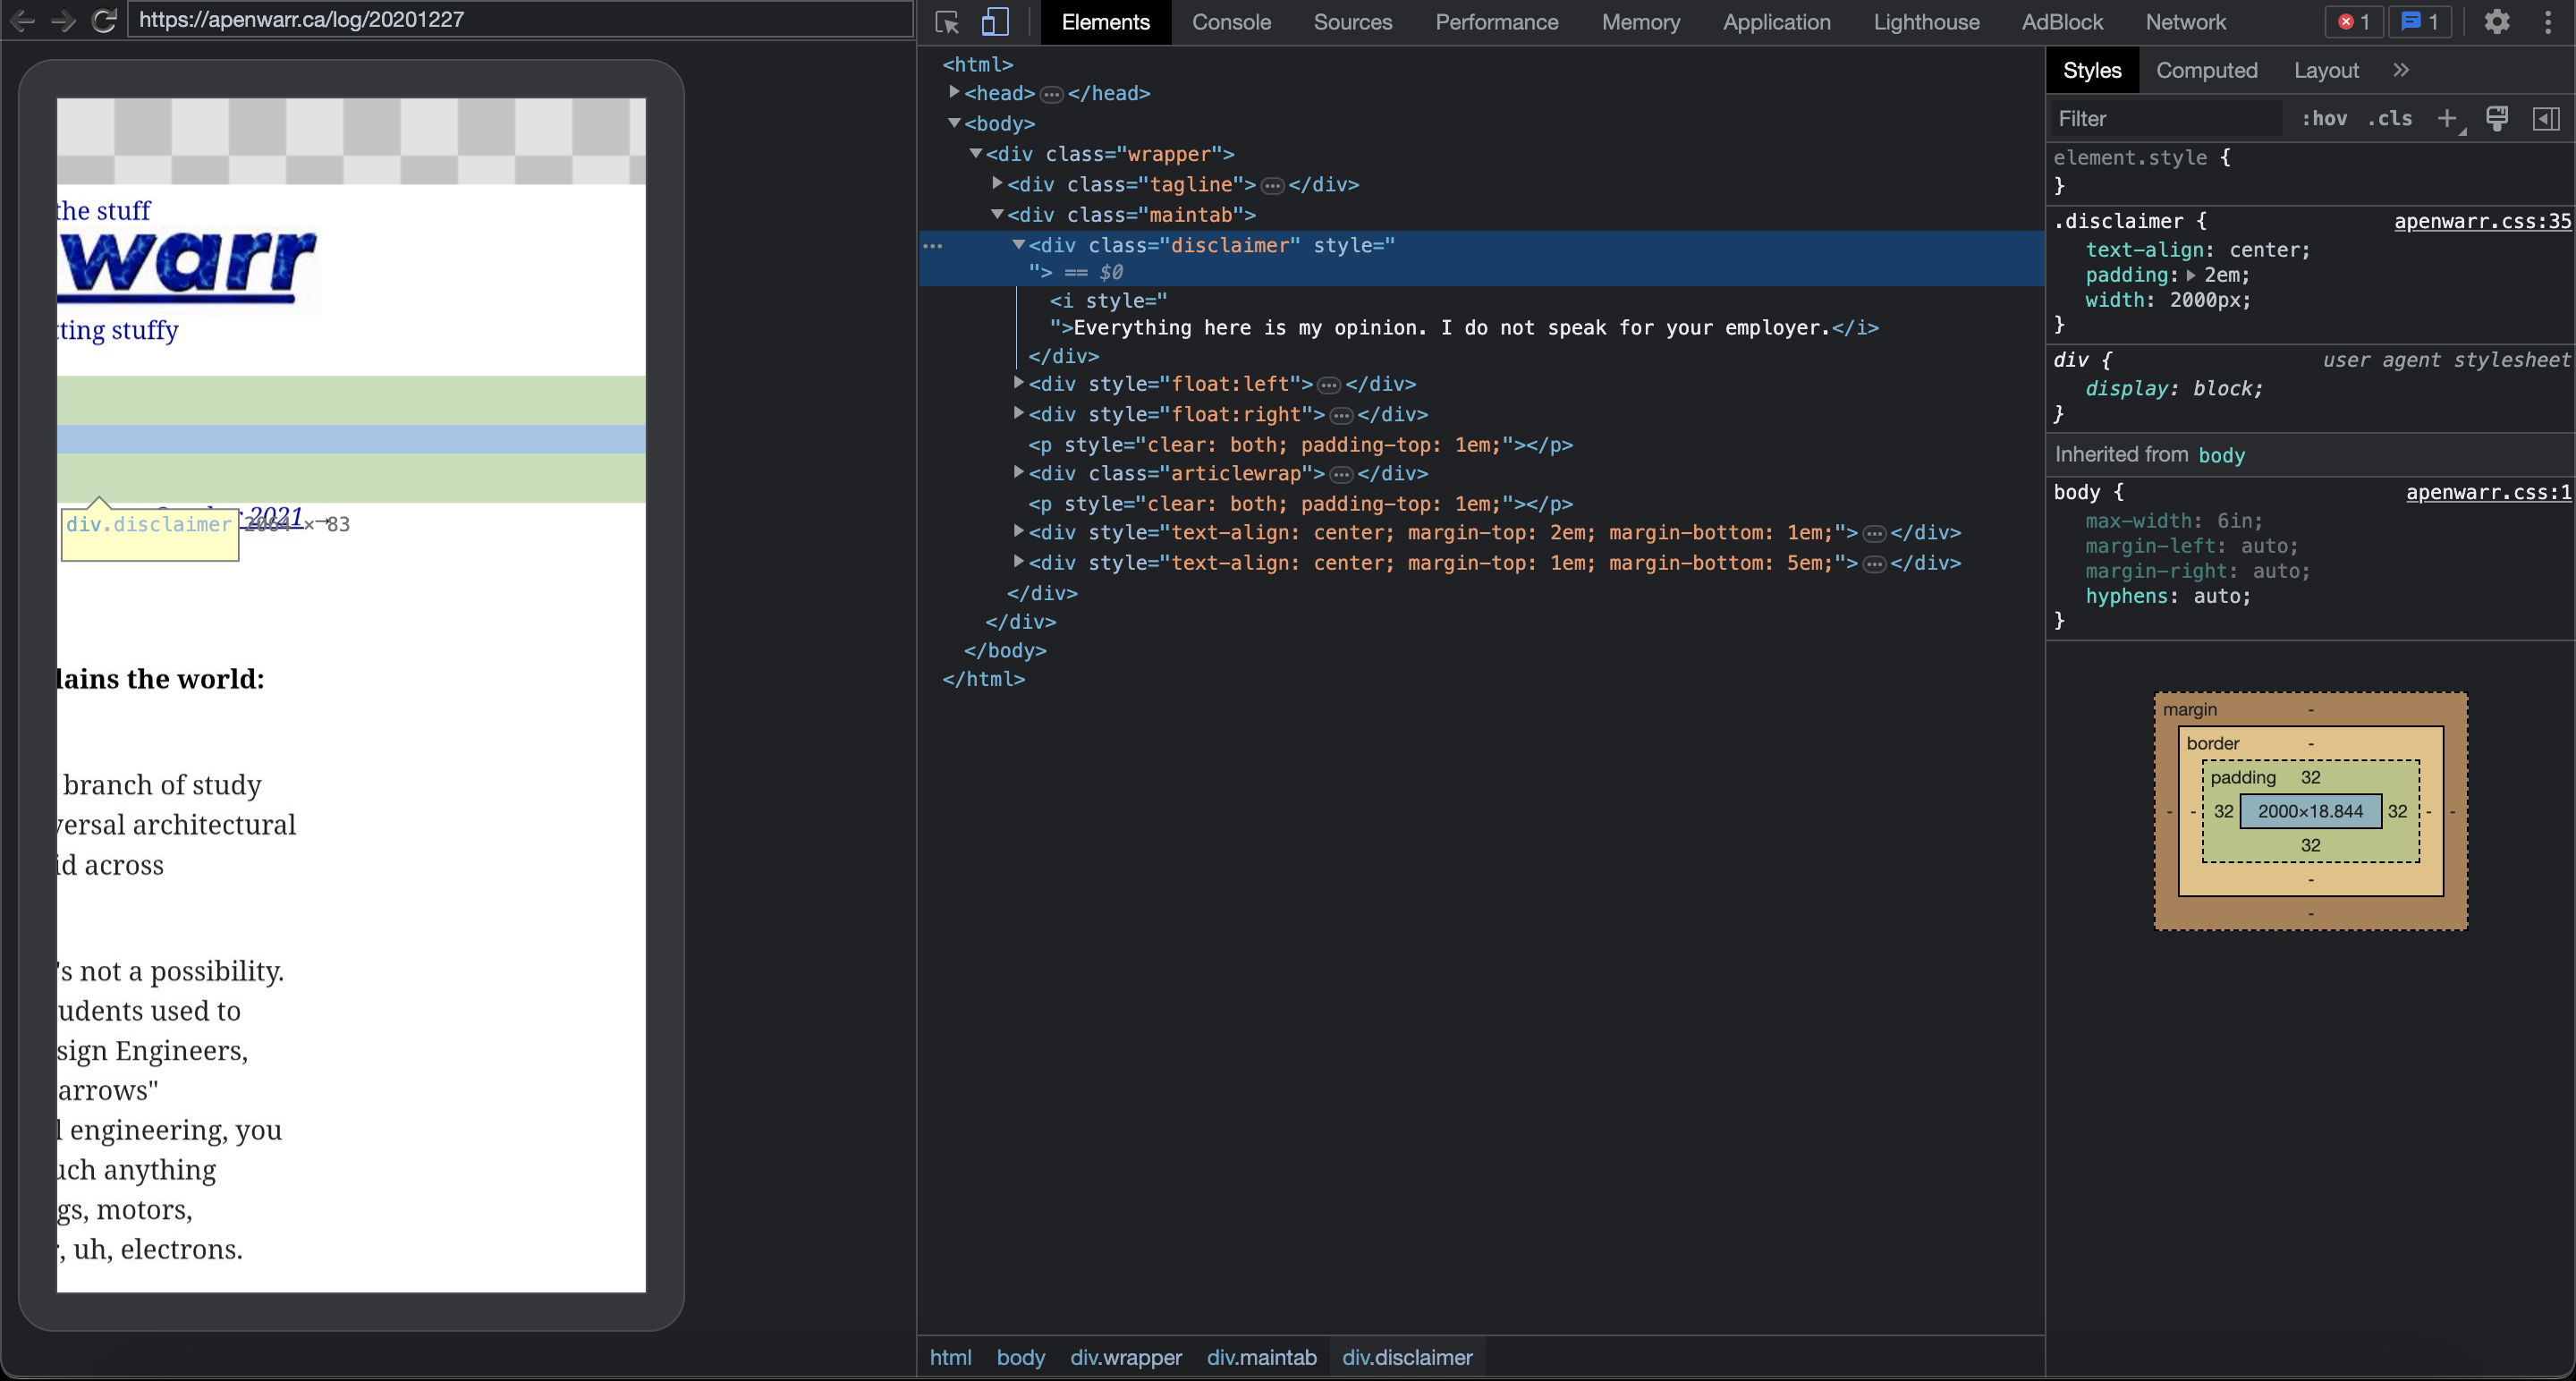
With remote debugging any interactions performed in DevTools are instantly mirrored on the device you are debugging. For example, scrolling in the DevTools viewport simultaneously scrolls the device viewport. Typing on your computer keyboard inputs text on the actual device (much faster than typing on the device itself).
As you can see in that screenshot, the page can be scrolled horizontally on a mobile device due to the width of a specific element. Remote debugging allows you to isolate that element and confirm the fix before going into your codebase to make that change permanent.
Using breakpoints to step through your code's execution
If you're running into JavaScript errors on your mobile device and need to determine the underlying cause, breakpoints can be useful for understanding what's going on with your code. Chrome DevTools has a breakpoints feature that allows you to pause your code's execution when an error is encountered. This lets you inspect the state of your site at that point in time.
This feature also allows you to check if all your dependencies are loaded or if a necessary element exists on the page at that point. You can also see the data your code needs to run.
If everything looks okay, you can step through to the next error and perform the same checks again. You repeat this process until you've found the source of your problem.
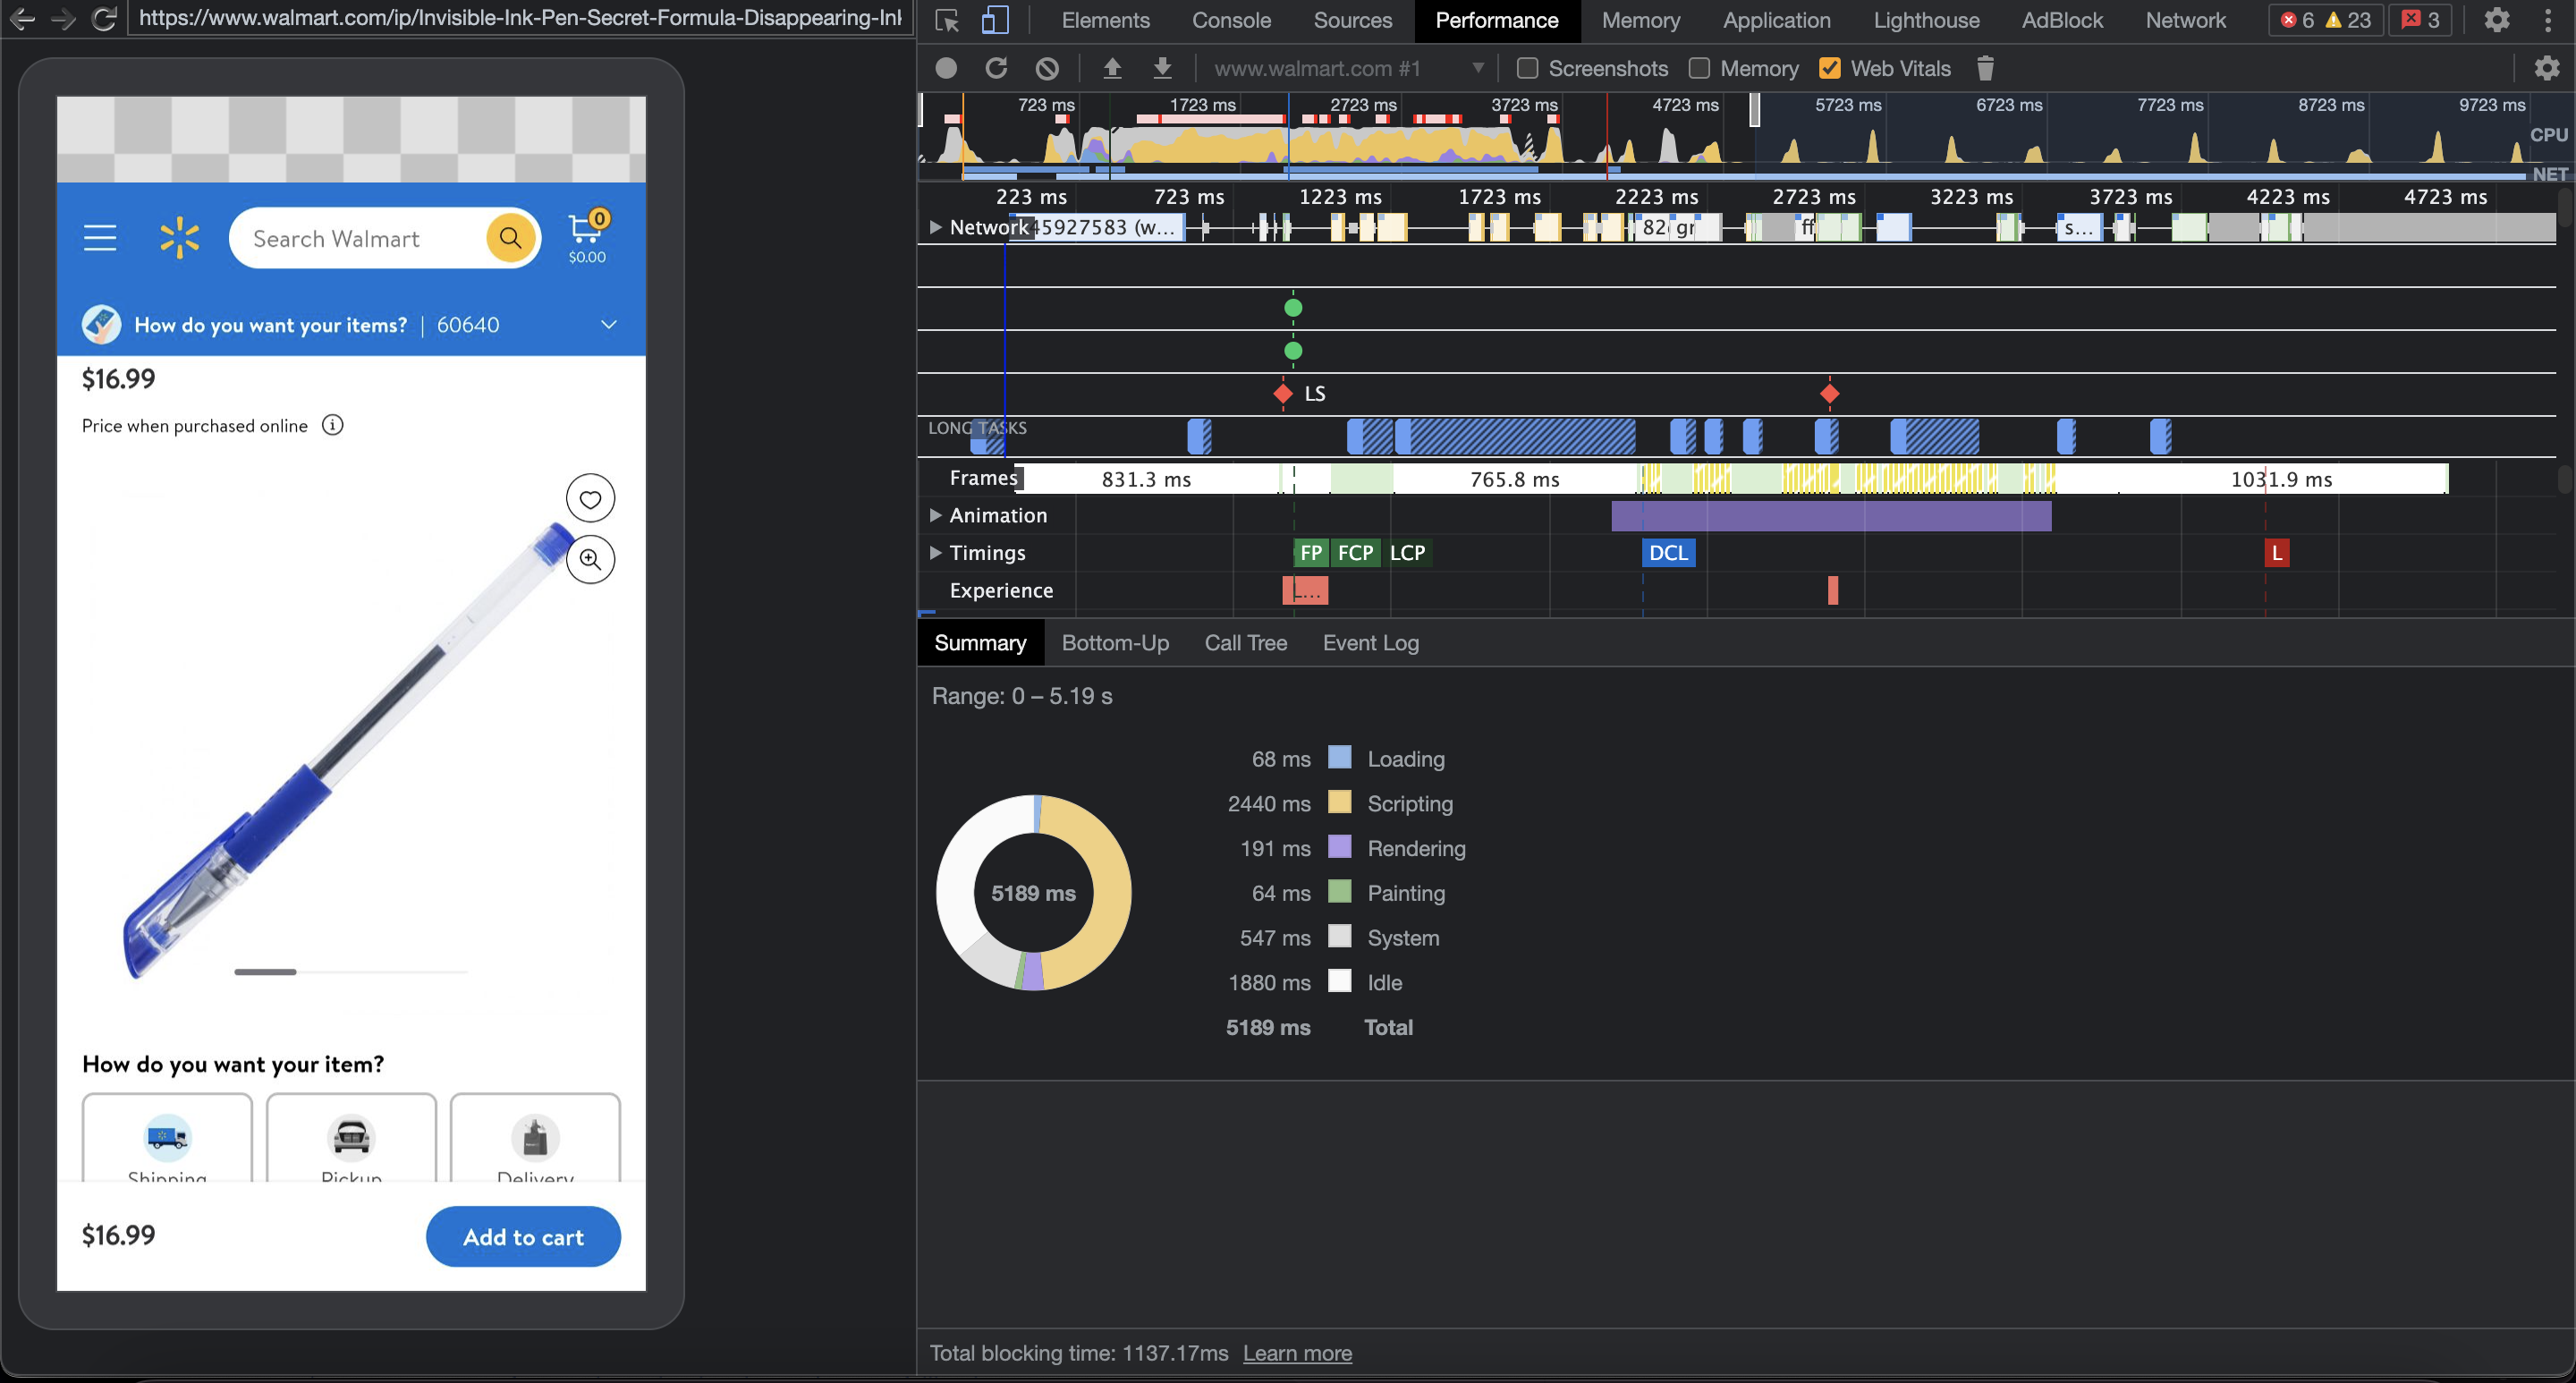
Getting an in-depth look at a mobile page's speed with the Performance Tab
If you need more detailed information on the specific components contributing to the load time of a webpage, the Performance tab within DevTools can be a valuable resource. Within this tab, you can view a breakdown of how much time is spent loading assets, executing JavaScript code, rendering the output of the page, and how much time is spent idling.
As with the other tabs in DevTools, running these diagnostics on an actual device via remote debugging can provide a better picture of what users on that device will experience.