Network request waterfalls show what resources are loaded when opening a website. This helps developers and website owners understand why different content elements show up at different times and how it can be optimized.
Recently I made a wall calendar with 12 request waterfalls for a conference, highlighting different web performance issues. This article goes through these waterfalls one by one and explains what they show. You can also test your own website to see what you can optimize.
Interested in a paper calendar? Request one here.
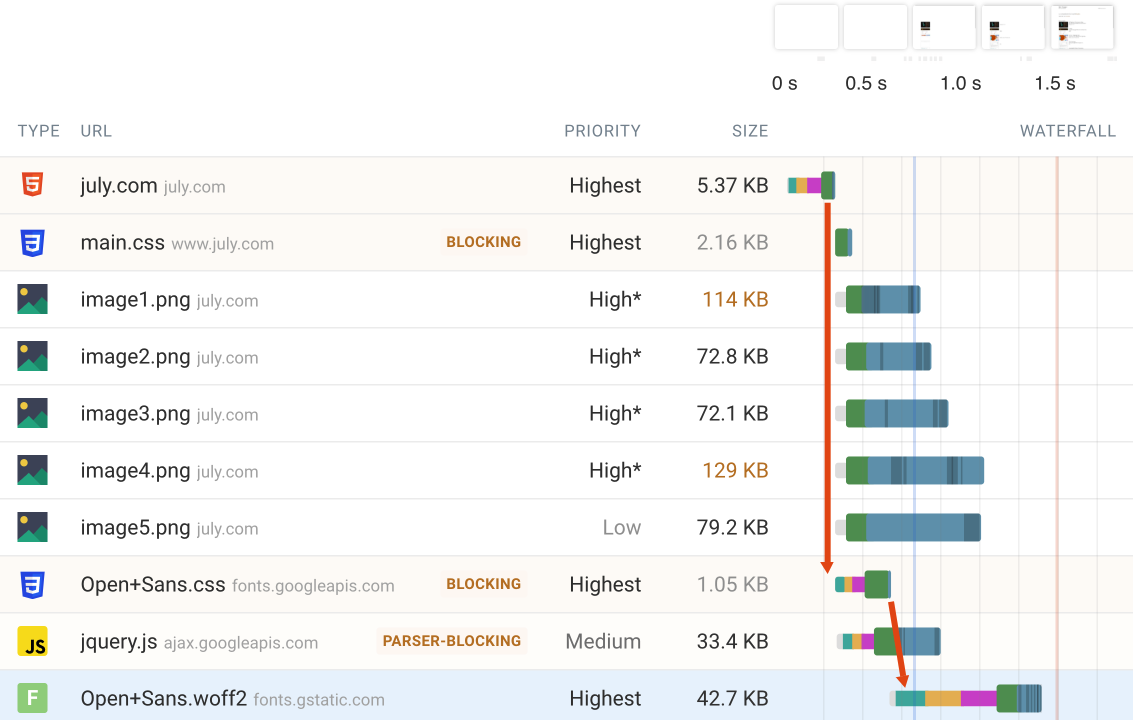
Number 1: Prioritizing the LCP image
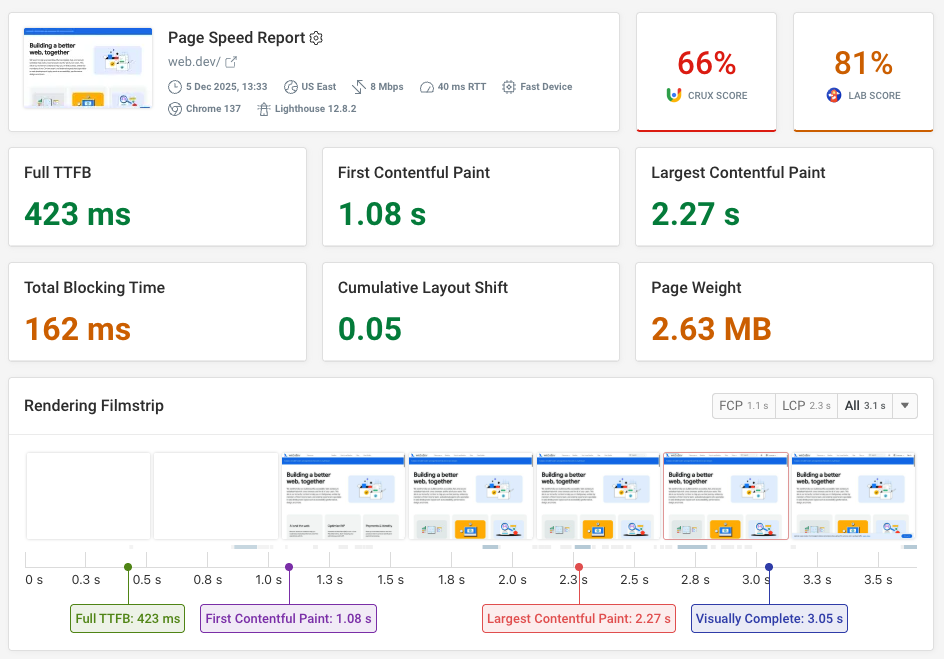
Here's the first request waterfall. If you're not familiar with this type of visualization, here's what you can see in a page speed waterfall:
- There's a list of resource URLs on the left, showing what files are downloaded
- On the right the bar indicates when the start and end time of the request
- The request bar itself can be broken down into network connection steps, requesting the resource (green), and downloading the file (blue)
- The filmstrip view lets you correlate the time when a request is made with the time that content appears on the page
- The horizontal blue line indicates the First Contentful Paint milestone and the red line indicates the Largest Contentful Paint
Now, what's happening on this page and what could be done to render the page more quickly and optimize the Largest Contentful Paint?
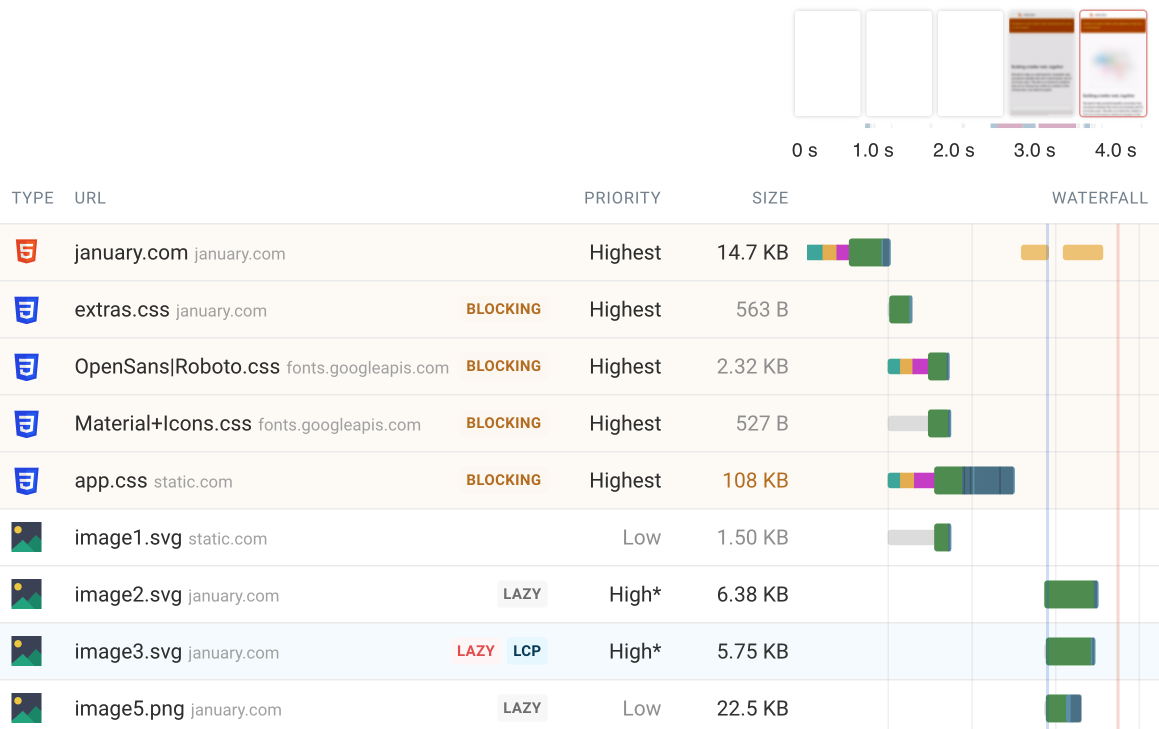
Websites always start loading with the HTML document. Then once that's loaded you can see the browser making other requests for resources referenced in the HTML code.
Some of these resources will be render-blocking, which means visitors can see no content until after these resources have been loaded. In this example this applies to the CSS stylesheets and we can see that the page remains blank until they have been loaded. (And then there's a small gap until the First Contentful Paint due to a CPU rendering task shown in orange.)
Improving the First Contentful Paint
We have two main options to improve the First Contentful Paint (FCP) here.
First, we could load all render-blocking resources from the same domain name. Right now, after establishing a connection to january.com, new connections to fonts.googleapis.com and static.com are required to load the CSS files. Each connection takes time to establish.
Second, we could look at optimizing the size of the 100 kilobyte CSS file. In this case the CSS contains embedded base64 images that could be loaded separately when needed.
Improving the Largest Contentful Paint
Improving the FCP will also improve the Largest Contentful Paint (LCP). But there's something else going on with the LCP image.
The LCP image element uses native HTML image lazy loading. That means the browser will only start loading the image when it appears in the viewport. To know if an image is in the viewport the browser first needs to render the page. We can see that the LCP image only starts loading after the initial paint.
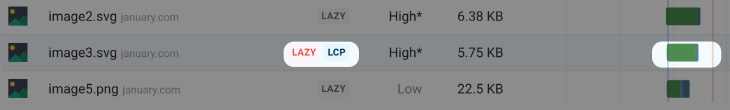
To load the LCP image earlier we can remove the loading="lazy" attribute. To increase the request priority even further we can use the fetchpriority="high" attribute on the image tag. Doing this makes sense for the main image on the page.
Run A Free Page Speed Test
Test Your Website:
- Automated Recommendations
- Detailed Request Waterfall
- Web Vitals Assessment
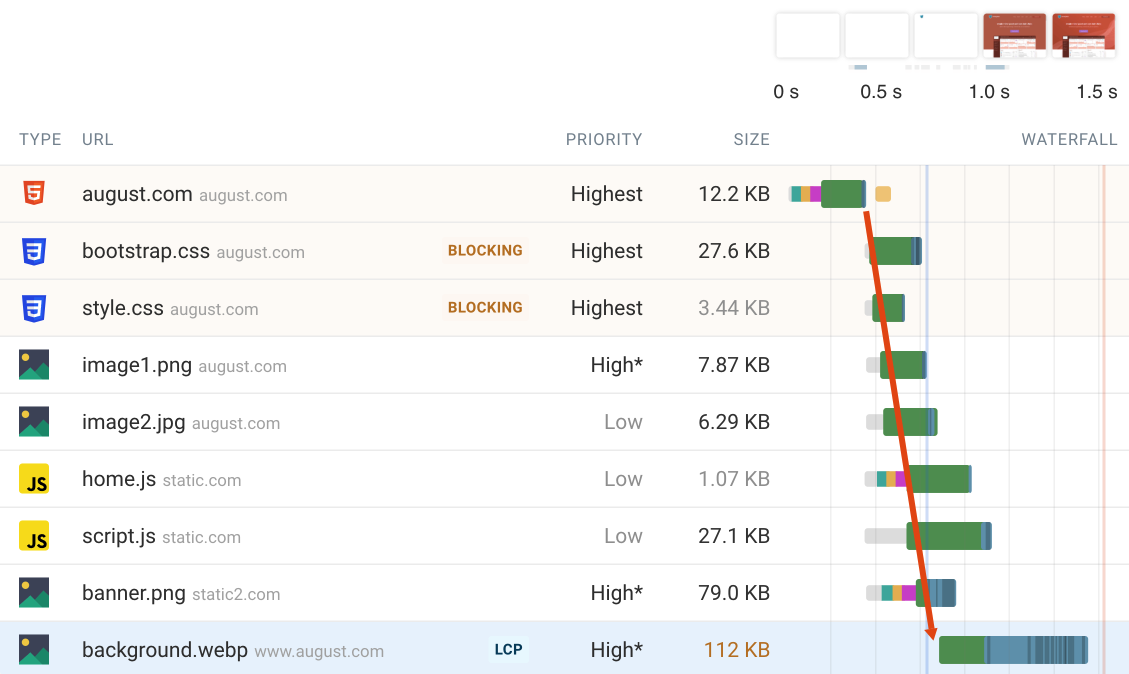
Number 2: Showing page content earlier
Take a look at the render-blocking resources in this waterfall. What can be optimized?
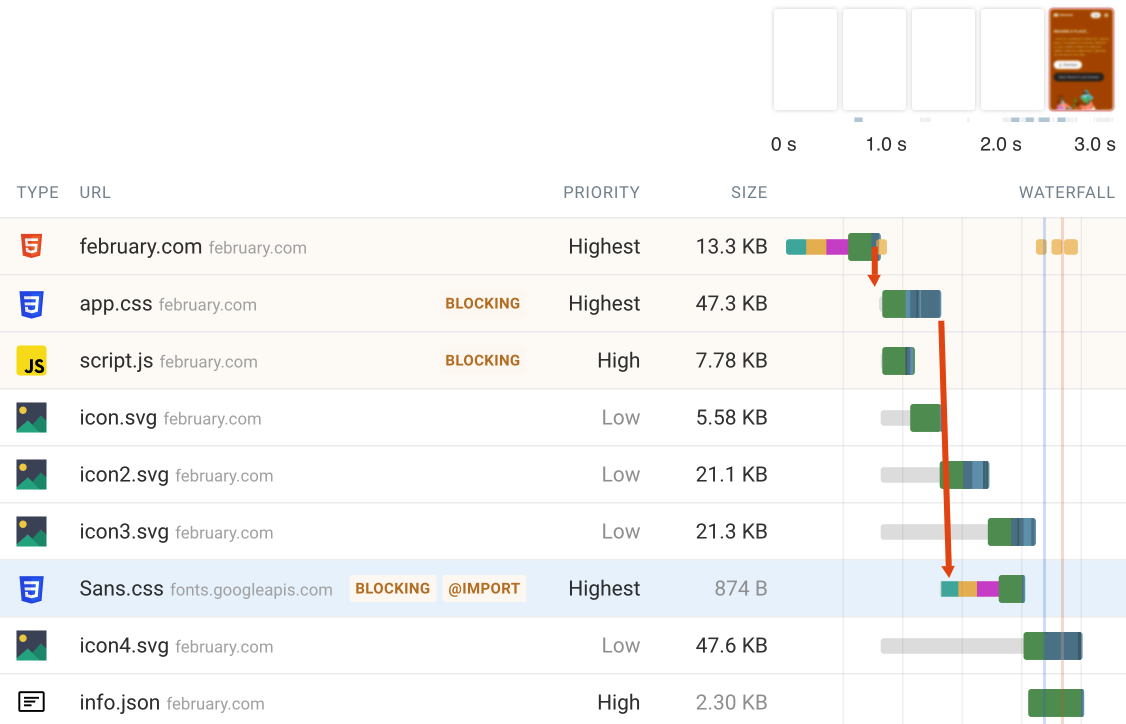
This site uses CSS @import to reference a stylesheet from within another stylesheet. This results in a sequential chain of requests.
In this case the second CSS file is also loaded from a different domain, which means it requires three round trips on the network just to create a new server connection.
The stylesheet could either be embedded directly in the first one or preloaded so that the browser can start loading it as soon as the HTML has loaded.
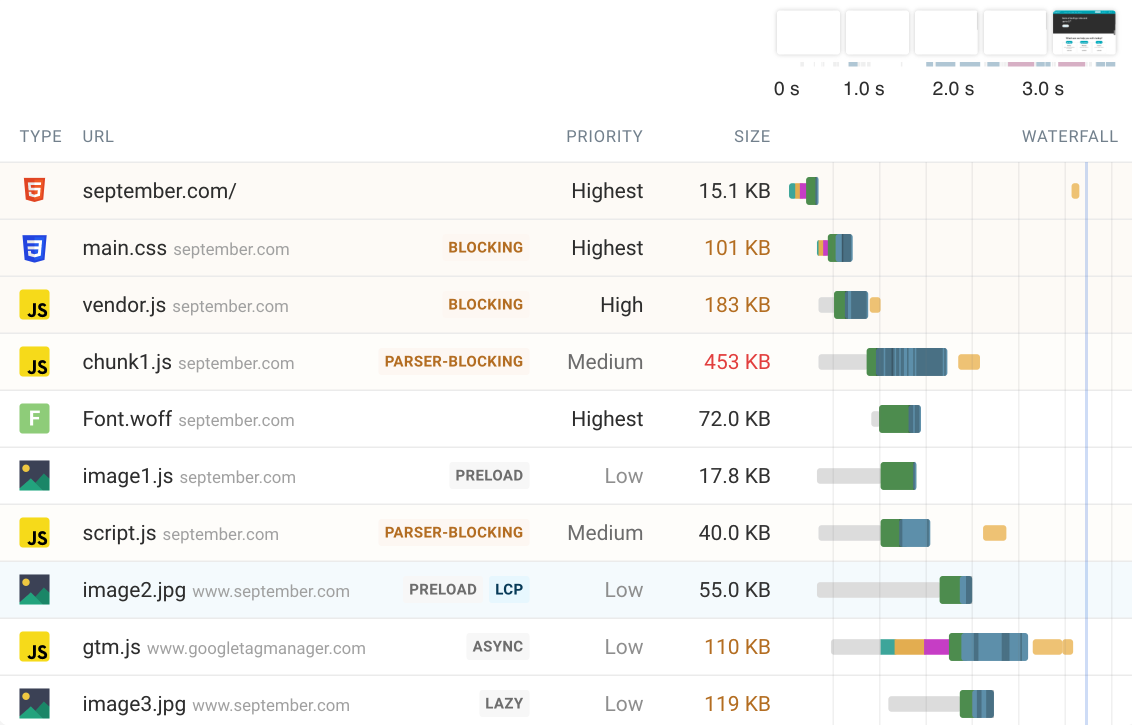
Number 3: Request chains
Why does this page take so long to render?
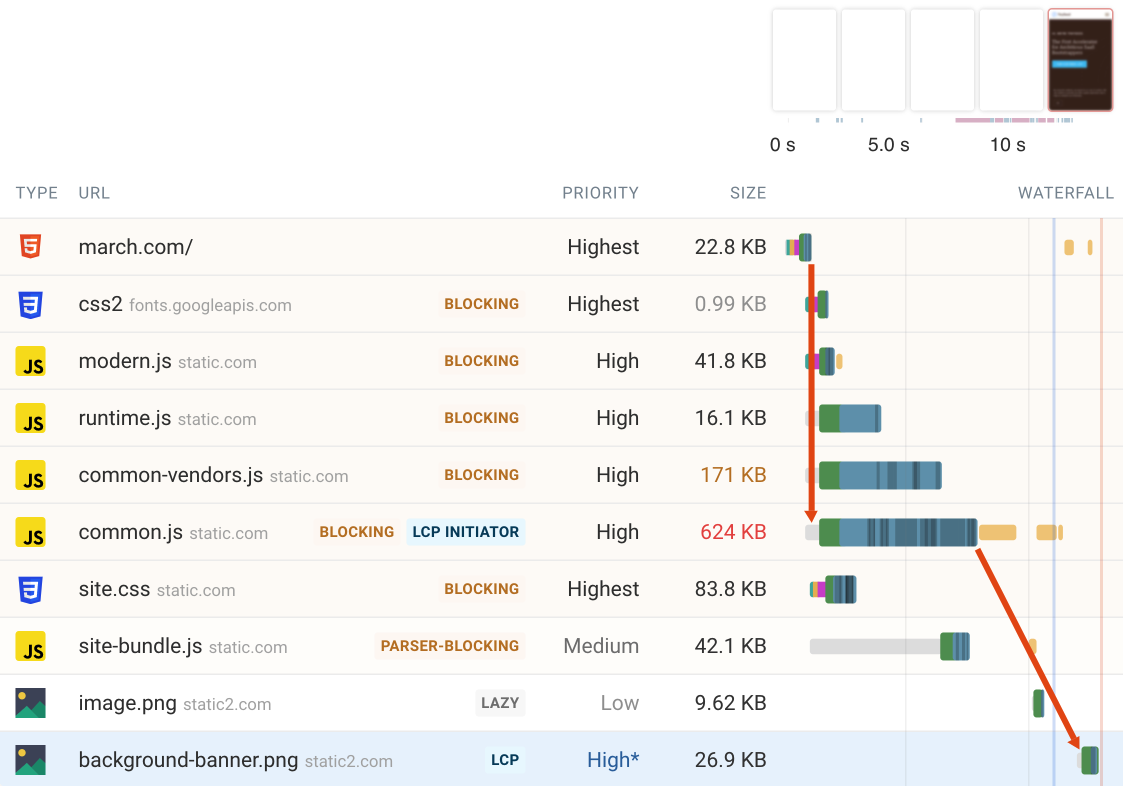
A 600+ kilobyte JavaScript file needs to be downloaded before any page content starts to appear. This file also acts as the LCP initiator, which means the LCP image is only discovered when the script creates the relevant content element.
Ideally the JavaScript file should not be render-blocking, for example by using server-side rendering so that the initial page HTML contains all the necessary page content. The JavaScript code can then be loaded later to make the content interactive.
Alternatively, you could look at reducing the JavaScript bundle size and execution time.
Number 4: Server connections
Normally once a server connection has been set up it is reused for future requests to the same server.
However, here we can see many server connections being created to the same server. What might be causing this?
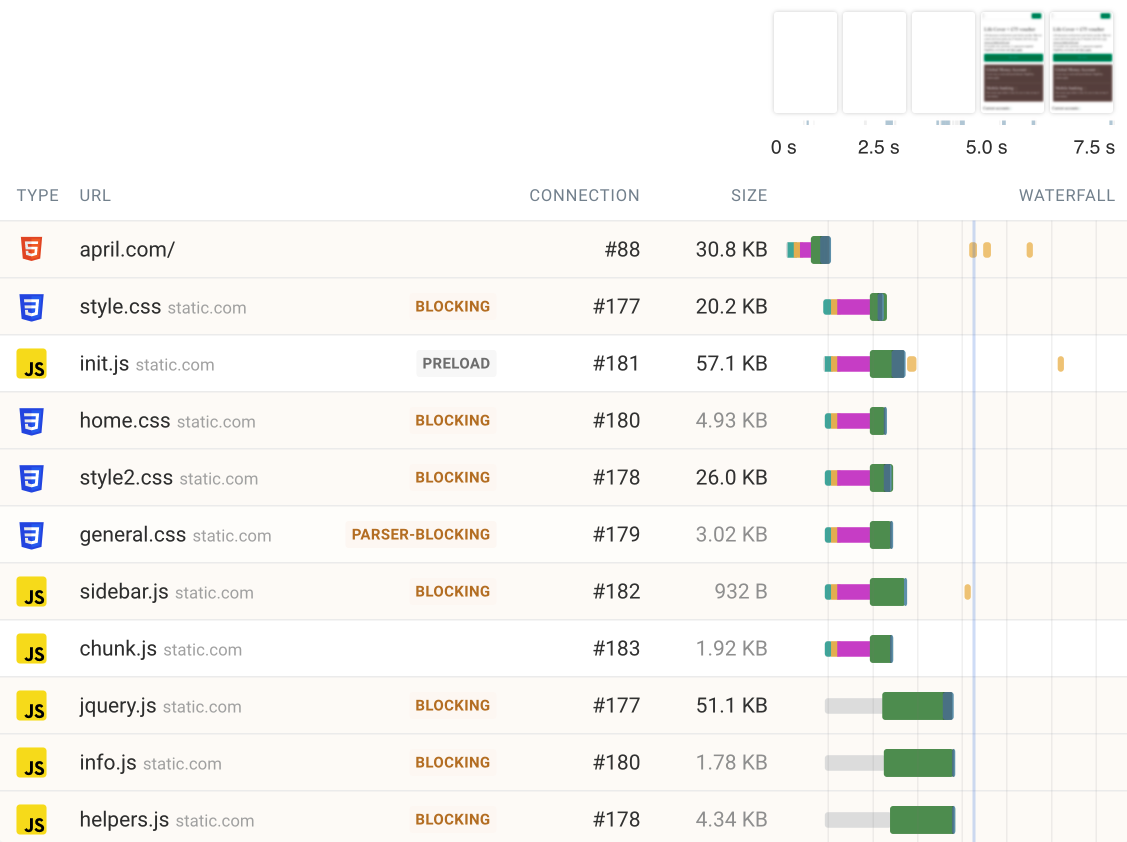
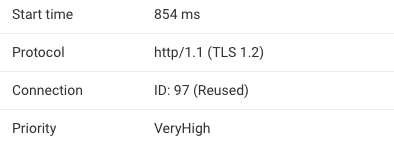
This website uses the older HTTP/1.1 protocol. In a full test result we can confirm this by expanding the request details.
HTTP/1.1 can only handle one request at a time. To deal with that, browsers create up to 6 connections to the same server.
When that six-connection limit is reached the browser waits for other requests to finish first to be able to re-use those connections.
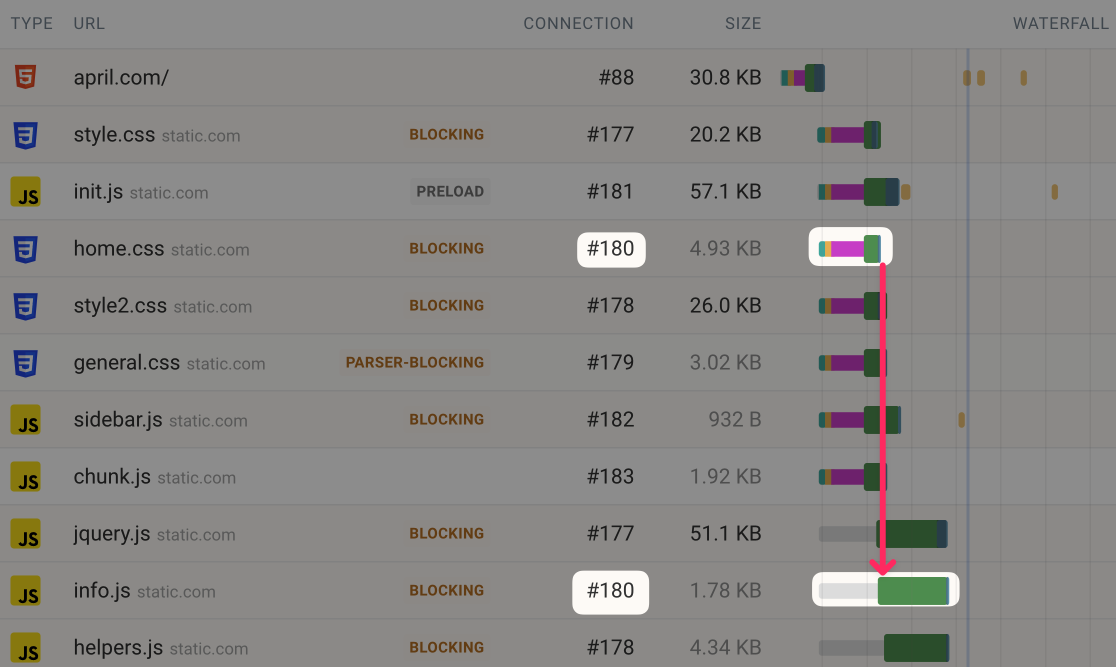
Making these render-blocking requests sequentially slows down rendering. Upgrading the server to HTTP/2 would allow parallel requests on the same connection and solve this issue.
Number 5: Slow main page content
What kind of website is it and why does it take a while to render?
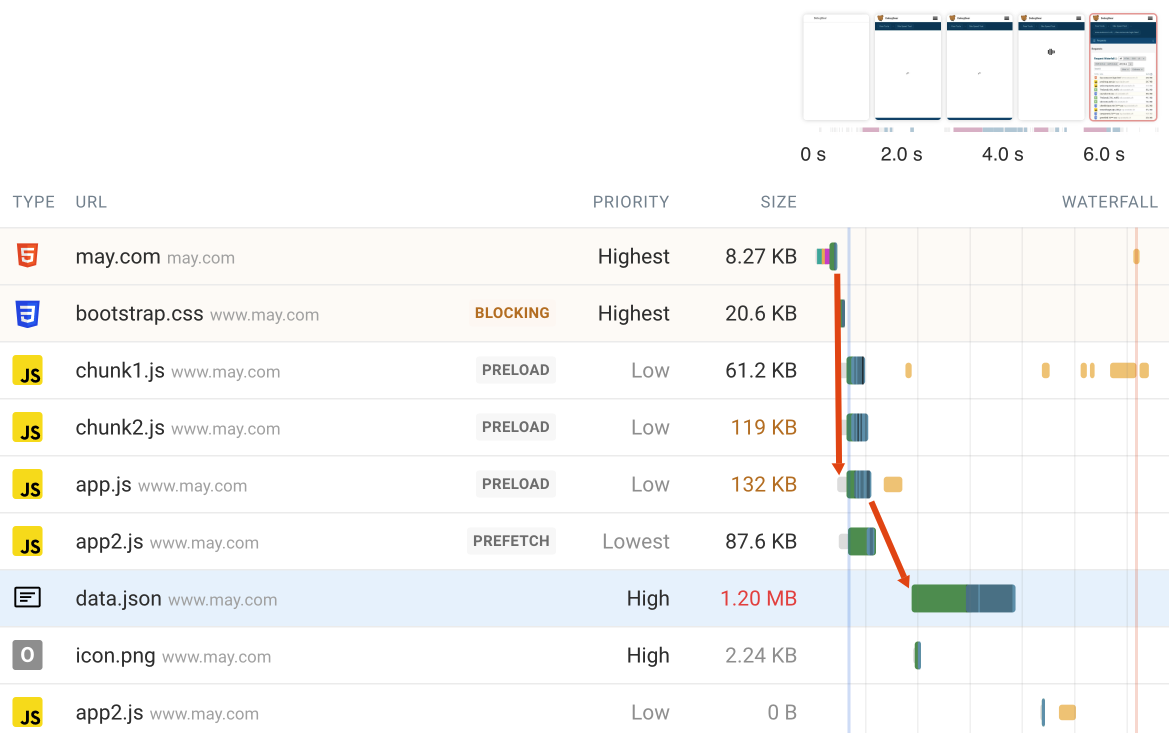
Here we can see that there aren't many render-blocking resources and the page header appears quickly. However, then little else appears except for a spinner.
In this case we're looking at a single-page React application without server-side rendering. That means a lot of time is spent downloading and running JavaScript code.
We can also see that downloading a large data file takes a long time. Compressing this file or splitting it up into separate smaller requests could help load the most important data early on and start rendering the page.
Number 6: Prioritizing different requests
What could be done to improve the Largest Contentful Paint metric on this page? The asterisk in the priority column indicates a priority change from low to high.
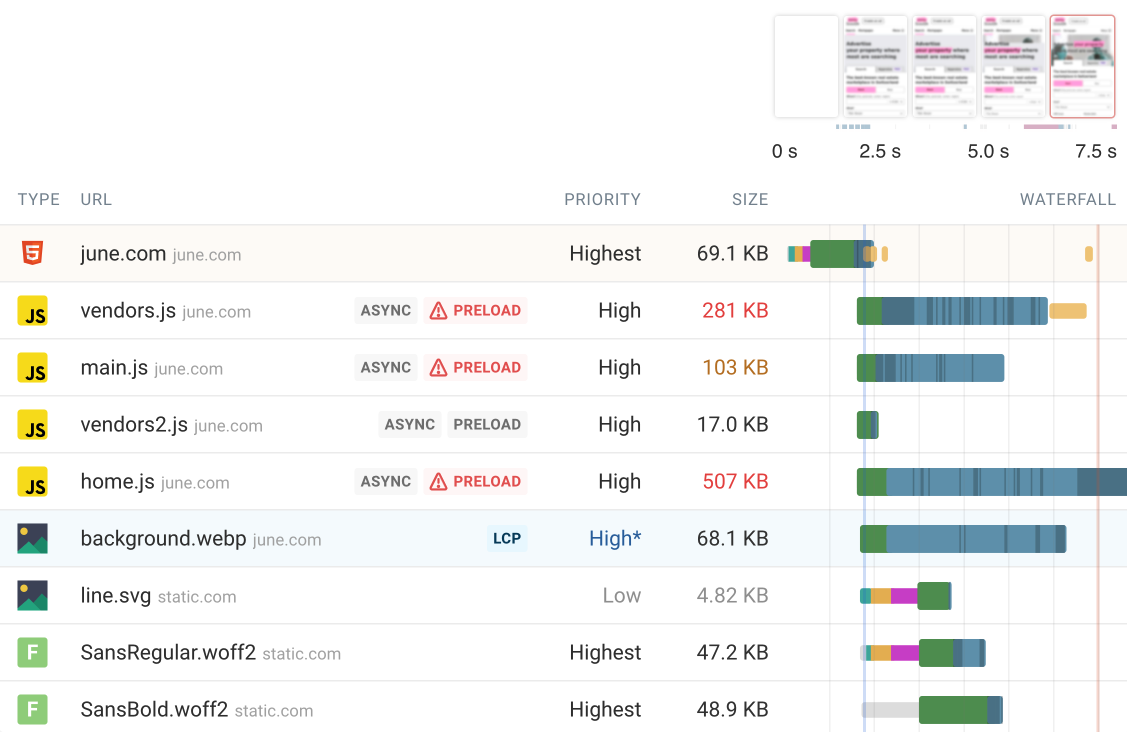
This page starts rendering really quickly, but downloading the LCP image is slow even though it is reasonably sized at 68 kilobytes.
However, this image is competing for bandwidth with two JavaScript files with a size of 281 kilobytes and 507 kilobytes. The dark blue parts of the download bar indicate when data chunks for a request are received. We can see that early after the LCP image request is made only little response data is actually received.
JavaScript files are normally render-blocking and therefore high-priority. When a preload tag is used to load them this priority carries over. However, in this case the async keyword is actually used to tell the browser that this script is not render-blocking. Preloads can often cause performance degradations when used in this way.
To load the main content quickly you want increase its priority and reduce the priority of the JavaScript code. The image priority can be increased by adding fetchpriority="high" to the img tag.
Removing the preload for the JavaScript files would reduce their priority. However, in that case it may take too long for the page to become interactive. A compromise could be adding the preload a second or two after the page starts rendering.
Number 7: Web fonts
Web fonts allow website owners to use fonts on their website that aren't installed on the user's computer. However, they can also cause performance problems.
Why does text only show up late in this waterfall?
This site is unusual in that images are appearing before the text. However, the LCP element is a paragraph on the page, so the LCP only happens late after the font has been loaded.
An immediate solution would be to use a fallback font until the web font has loaded. This can be achieved by adding the font-display: swap style and a second font in the font-family list.
The browser also doesn't discover the font file until after the Google Fonts stylesheet has been downloaded. A preload tag could be used to tell the browser the font is needed directly in the HTML.
Number 8: Background images
What could be done to load the background image more quickly here?
Because the LCP image is loaded using a CSS background-image rule the browser first has to render and style the page in order to realize that the image needs to be downloaded. Due to this we can see that the request only starts after the First Contentful Paint.
Again, a preload tag with fetchpriority="high" for the LCP image would address this issue.
Number 9: Invisible content
In this waterfall the render-blocking resources finish loading fairly quickly. But the page content becomes visible only much later. Why could this be?
This site contains an anti-flicker snippet that's commonly used by A/B testing tools. These snippets hide all body content using opacity: 0 until A/B tests or other customizations have been loaded.
Here we can see that content only shows up after gtm.js has finished loading and the A/B testing code has run.
To address this you could:
- disable the content hiding and accept some flicker when page content changes
- only apply the content hiding styles to specific page components like h1 or buttons that are often edited in A/B tests
Number 10: Resource competition
What's going wrong on this page?
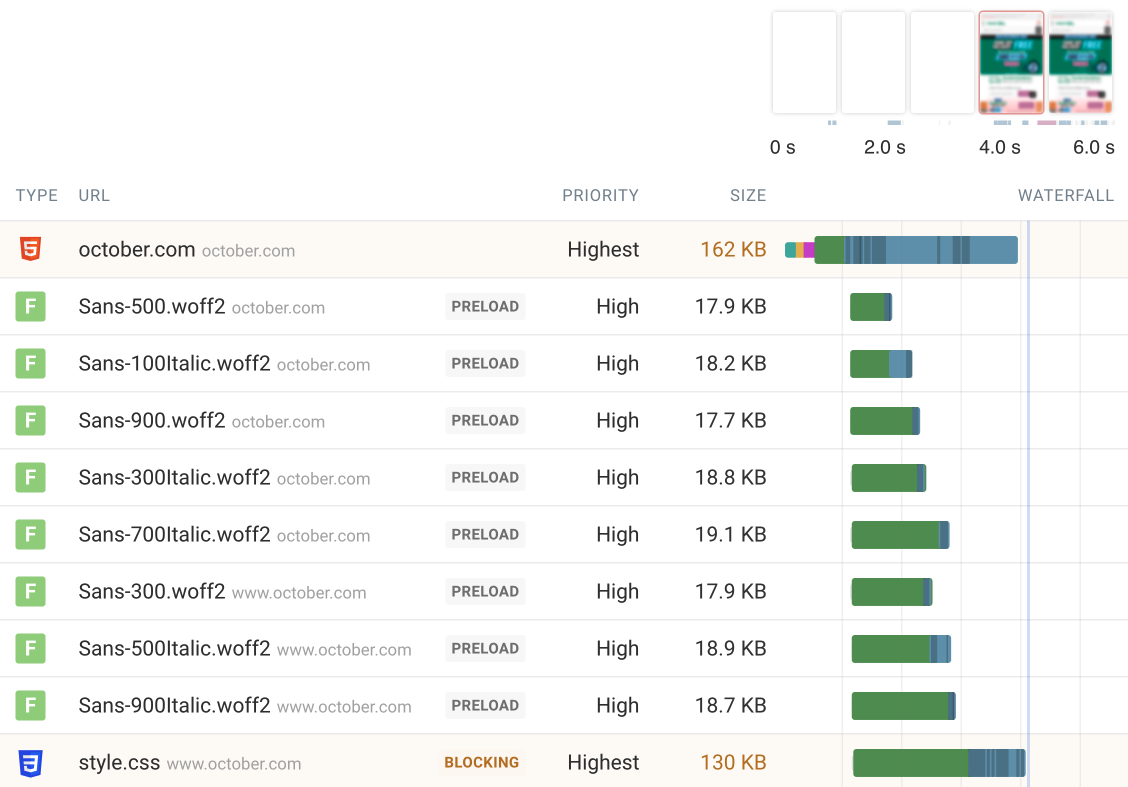
As mentioned above, preloading fonts is often a good idea. However, if you're preloading 10 or more fonts something is clearly going wrong. This will simply divert network bandwidth away from more important resources. As a result, the HTML document and render-blocking CSS only finish loading late.
Only preload the 1-3 most important fonts for your page.
Number 11: Resource sizes
What's the main thing delaying rendering here?
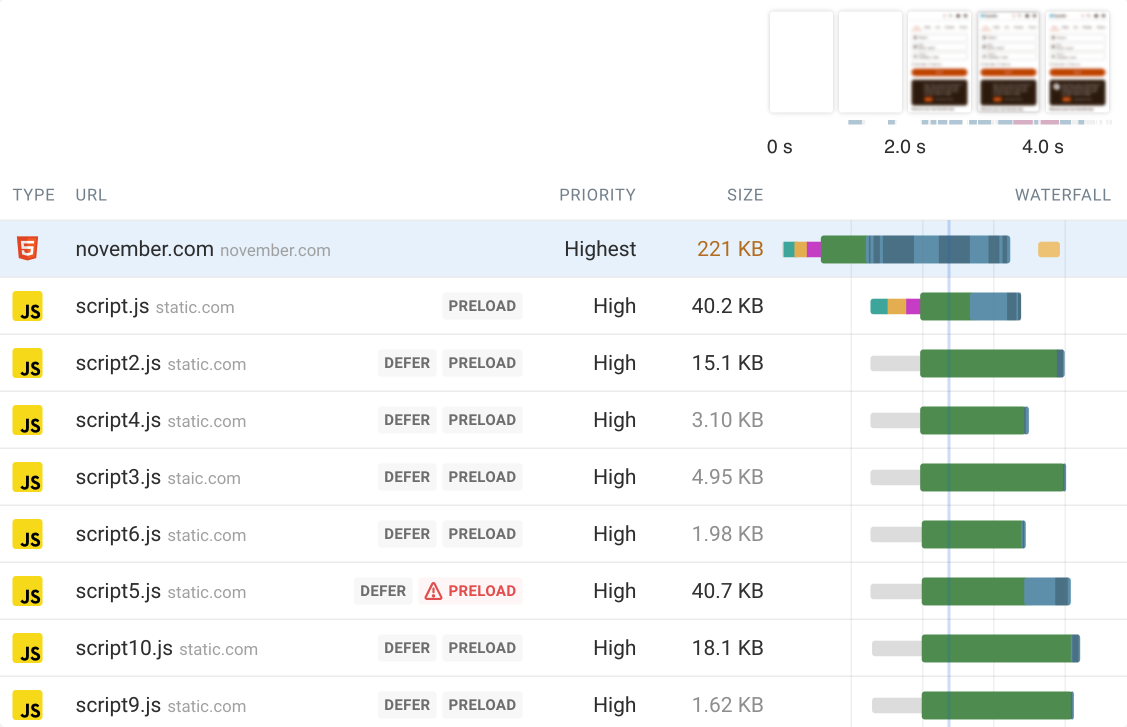
The HTML document is 221 kilobytes large after gzip compression. That means it takes a while to fully download.
You can use the HTML Size Analyzer to break down your HTML download size.
For example, you may discover that it contains embedded images or fonts.
Number 12: A fast website
What makes this website so fast?
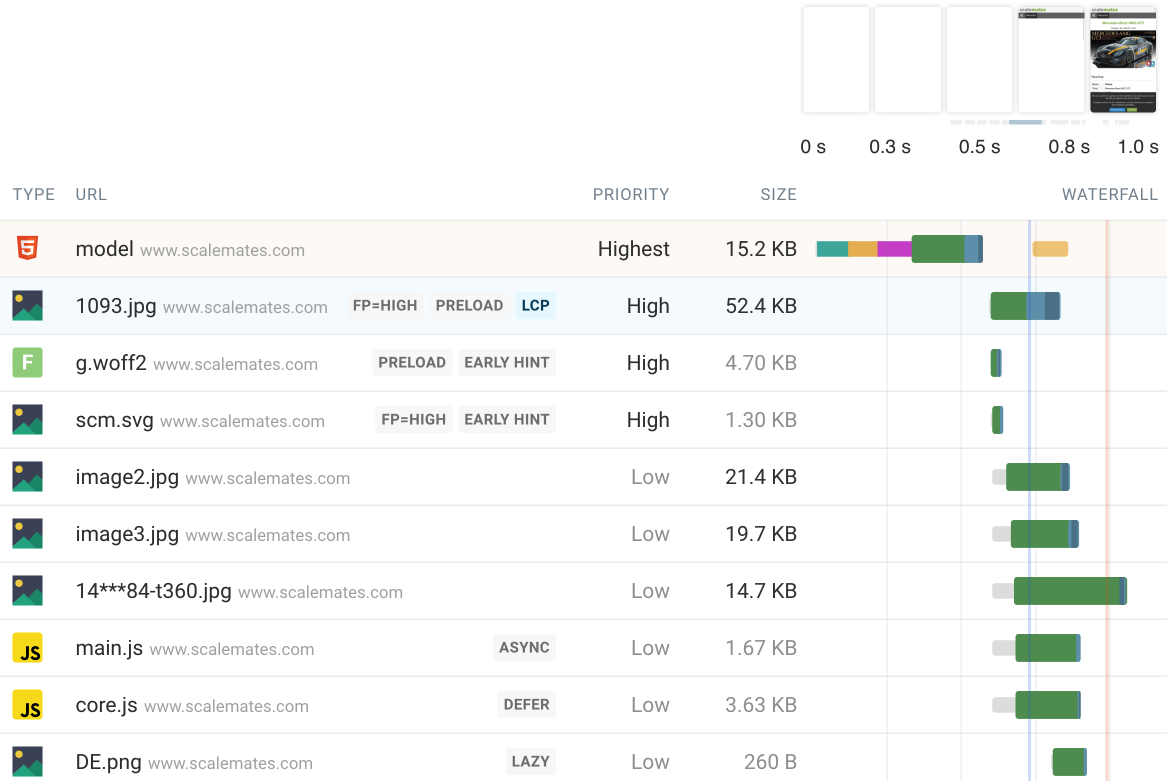
This is the scalemates website by web performance expert Tim Vereecke. We can find a bunch of optimizations that make it fast.
The HTML document is the only render-blocking request and content becomes visible quickly after the request has finished.
All resources are loaded from the same domain, which means only one server connection needs to be created.
Important resources like the LCP image are prioritized. Less important resources are loaded with low priority, for example by lazy loading some images and using the async and `defer attributes for scripts.
The site also uses 103 Early Hints to start loading fonts and key images early, even before the server starts sending the full HTML response.
Conclusion
Request waterfalls provide a lot of information about your website, but it can be hard to interpret them correctly. Hopefully this article was able to highlight some common patterns you can spot. You can try testing your own website here.
Interested in monitoring your page speed over time and optimizing your Core Web Vitals? Try DebugBear for free. Or learn more about website performance monitoring tools here.