
When you open your website, it probably just takes a couple of seconds for all the content to appear. Too fast to really understand what's going on and how to optimize it.
Find out how you can use Chrome DevTools to load your website step by step and pause loading to inspect the page at each stage.
Throttle the network to slow down loading
Chrome DevTools allows you to throttle the network so that your page loads more slowly. By applying very strong throttling you can see how different parts of your page appear over time.
- Right-click the page and click Inspect to open the developer tools
- Open the Network tab in DevTools
- Open the dropdown saying No throttling and select Fast 3G (or Slow 3G to slow the page down even more)
- Reload the page
Based on the video we can see that the general structure of the page appears pretty quickly, although there is a fair amount of layout shift.
After about 5 seconds some web fonts are loaded and you can see that the shape of the letters changes.
The images take quite a while to load and an image at the bottom of the screen appears before the main image. If this was your website you might want to consider prioritizing the main image or optimizing images more generally by using modern image formats and by sizing the images correctly.
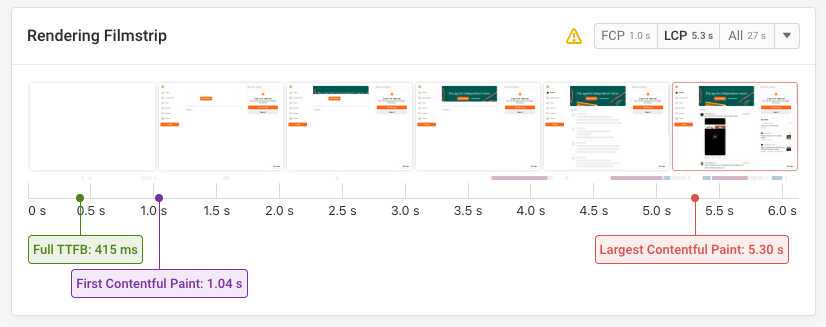
The DebugBear website speed test automatically captures a video and filmstrip view of how your page loads on a mobile network connection.
Pause JavaScript execution to inspect the page
What if you want to understand the current appearance at a given point in more detail? You can pause loading the page with Chrome's JavaScript debugger:
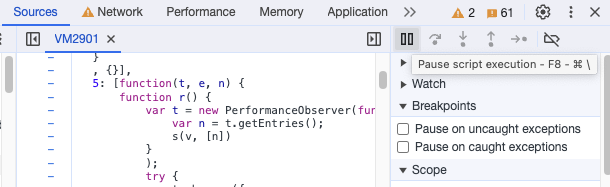
- Switch to the Sources tab
- Reload the page
- Click on the Pause script execution button when the state you want to inspect is reached
This will pause the execution of JavaScript code. DevTools will show you the line of code where it has paused, but this doesn't matter in this case.
Once the page is paused you can switch over to the Elements tab and look at the current structure and styles of the page.
You can click Resume script execution later.
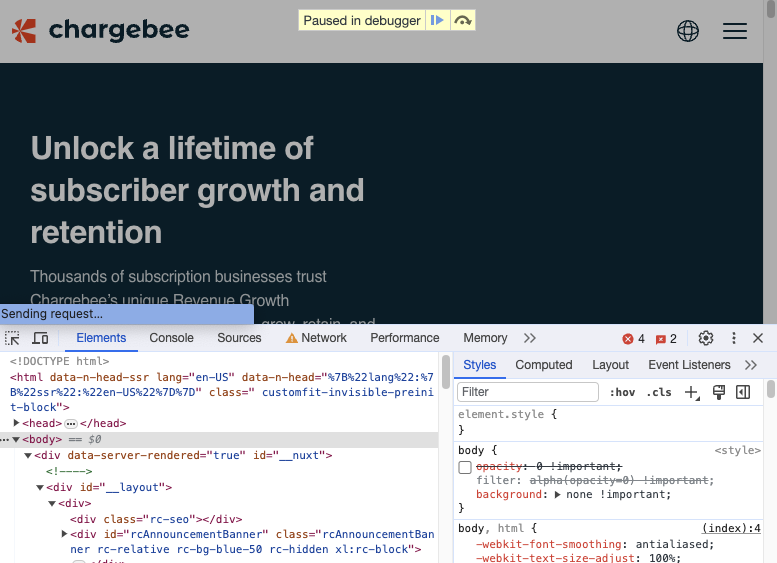
Example: hidden page content
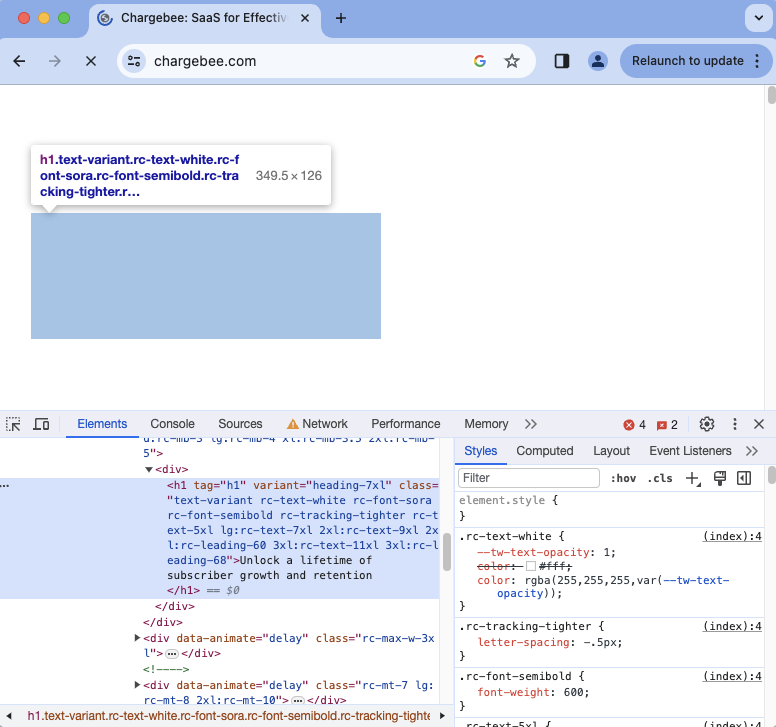
Let's take a look at this example website. The site is not showing any content, but all the render-blocking resources have been loaded.
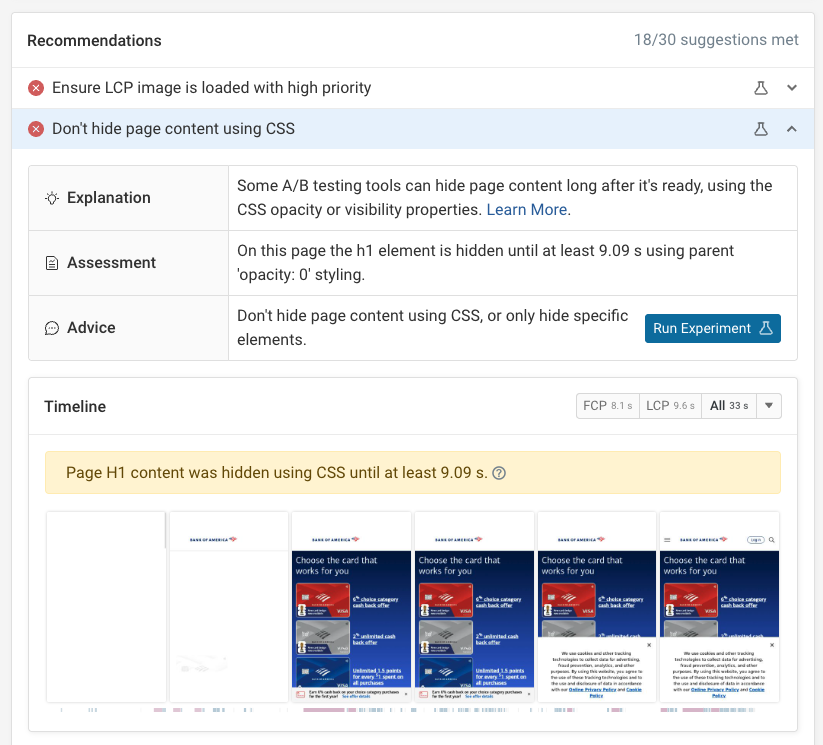
We can pause loading the page in this blank state and inspect its content. We find that the h1 heading element is present on the page but not shown.
What's going on here? We can go up the HTML tree to find a parent element that's hidden. In this case we eventually reach the body tag and see that the CSS opacity: 0 styles have been applied to it.
This often happens as part of the anti-flicker snippets used by A/B testing tools.
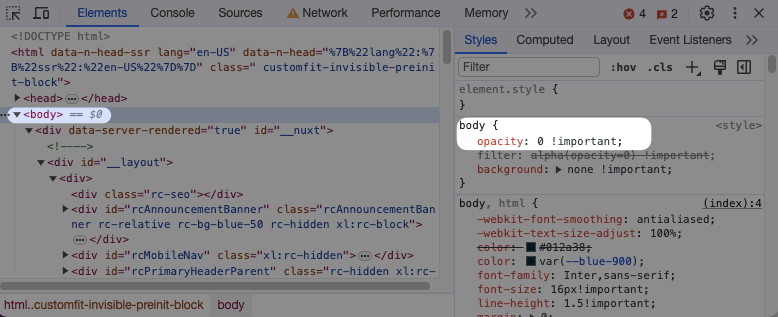
We can click on the checkbox next to the CSS rule to disable the styling. Now the page content appears right away.
Advanced tip: Chrome breakpoint types
Pausing in just the right place can be tricky. You'll often need to reload the page several times and try to hit pause at the right time.
The feature used to pause execution is called breakpoints, and clicking "Pause execution" is basically an instant breakpoint.
If you know the codebase and where you want to pause, you can set a breakpoint on the specific line of code where you want to pause.
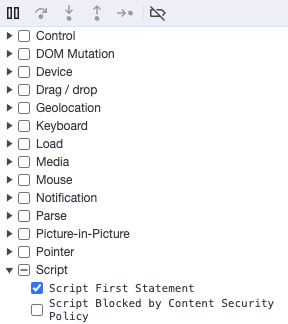
Or you can use an event-based breakpoint like Script First Statement to pause at the beginning of every JavaScript file.
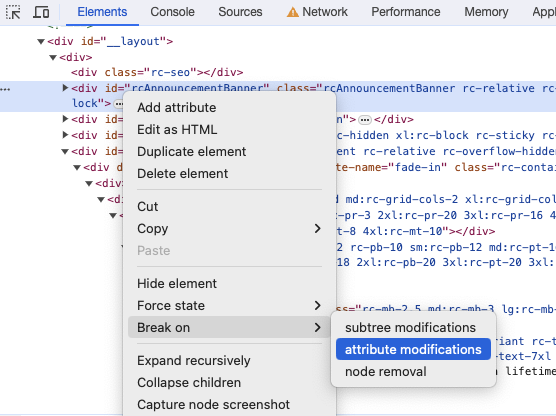
Finally, Chrome has DOM breakpoints where you can break when there's a change to the page HTML contents.
- Right-click on an element in the Elements panel
- Select Break on
- Select an option like attribute modifications
- Reload the page or continue execution if already paused
Then when that HTML element changes Chrome will pause execution.
Throttling the CPU in Chrome DevTools
Sometimes pages load slowly not because of resources being loaded over the network but because of slow JavaScript code. This can make it tricky to pause in the right place to be able to inspect the page.
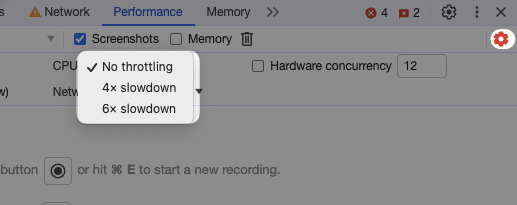
In this case enabling CPU throttling in DevTools is helpful:
- Open the Performance tab
- Click the second gear icon in the top right
- Change CPU: No throttling to 6x slowdown
Now reload the page and it should load a lot more slowly.
Record a performance profile
Slowing down the page lets you see how your website loads visually and inspect it at different points. But the Chrome DevTools profiler lets you analyze the overall page load process and see each frame of the rendering process.
- Open the Performance tab
- Click the Reload button in the top left
- Click Stop when the page is ready
You can now see the performance recording that has been captured.
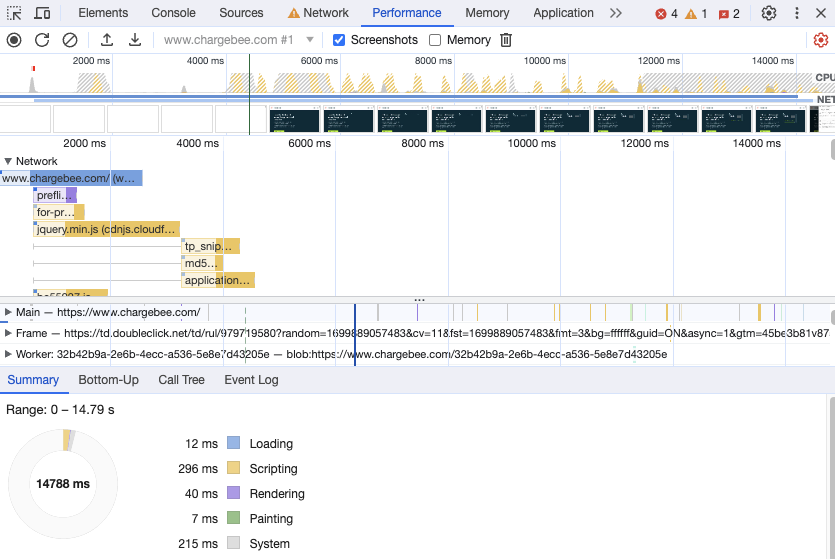
The profile shows different events and loading stages chronologically from left to right. There's a ton of data and this can be really overwhelming!
But there are a few things that you can check out here:
- Hover over the filmstrip view to see what page content was visible at that point
- Expand the network lane and see how resource loading correlates with what's on the screen
- Check out the Timings lane to see the Largest Contentful Paint milestone
- Look at the Main thread recording to identify slow CPU tasks
Inspect the page load process with DebugBear
Instead of using Chrome DevTools to debug your page you can also run a free website speed test with DebugBear.
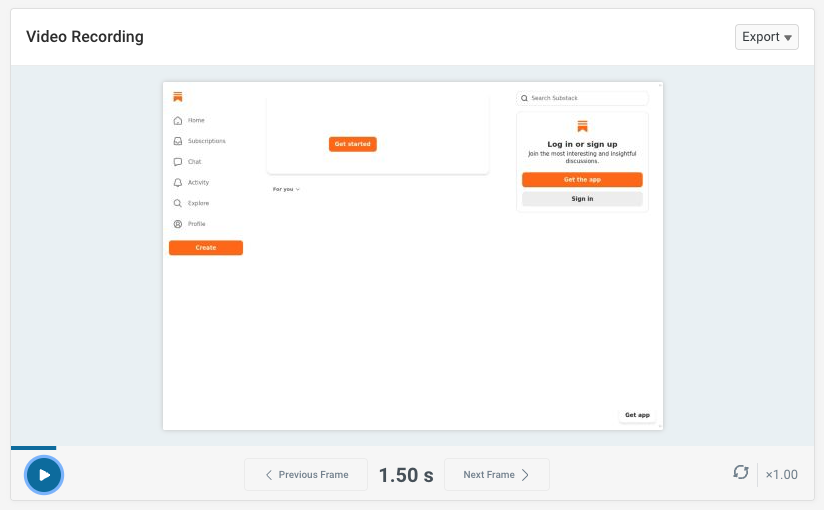
Check out the filmstrip showing you what your page looks like at different points in time. Or scroll down to see a video recording and click Next Frame and Previous Frame to see what changes.
If you sign up for a DebugBear trial you can also export the video as MP4, compare two versions of your website, or compare your website loading speed to a competitor. This makes it easy to communicate with your team or clients.
The DebugBear test also automatically identifies common page speed issues. For example, we can detect when the page content is hidden using CSS.
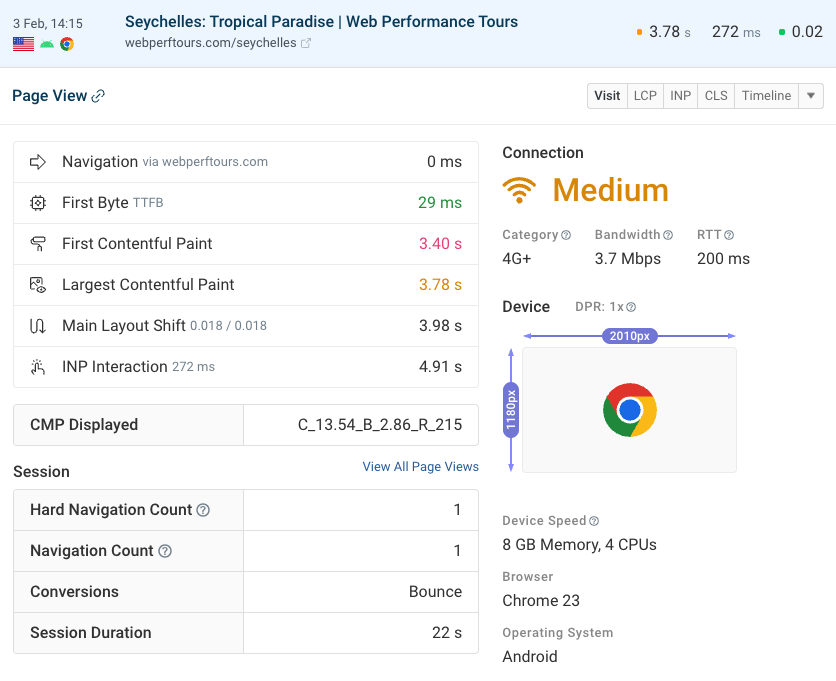
While controlled lab-based tests are useful, real-user monitoring captures how your website performs, and how it loads, for your real users.
The Timeline feature lets you dive into individual page views to see what their page load experience was like.
Monitor website performance
DebugBear can help you monitor and optimize your Core Web Vitals. Keep track of your page speed, identify ways to optimize performance, and check that your changes are having the expected impact.
You can run scheduled lab-based tests as well as collect real-user monitoring data for actual visitors on your website.


Monitor Page Speed & Core Web Vitals
DebugBear monitoring includes:
- In-depth Page Speed Reports
- Automated Recommendations
- Real User Analytics Data