
The Chrome DevTools Performance tab is packed full of features that let you audit page performance in depth. You can use it to test both the initial load of your website as well as how quickly it responds to user input, as measured by Google's Interaction to Next Paint metric.
This article explains how to use the Performance tab to profile your site and interpret the results.
Recording a performance profile
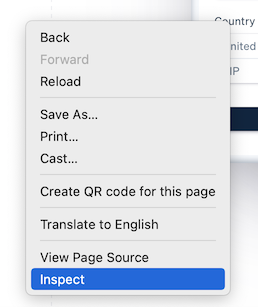
To access the Performance tab, navigate to the website you want to profile, then open Chrome DevTools by right-clicking and selecting Inspect.
Select the Performance tab inside Chrome DevTools.
The easiest way to capture a performance profile is by clicking the Start profiling and reload page icon. The profile will stop automatically once CPU and network activity on the page stops.
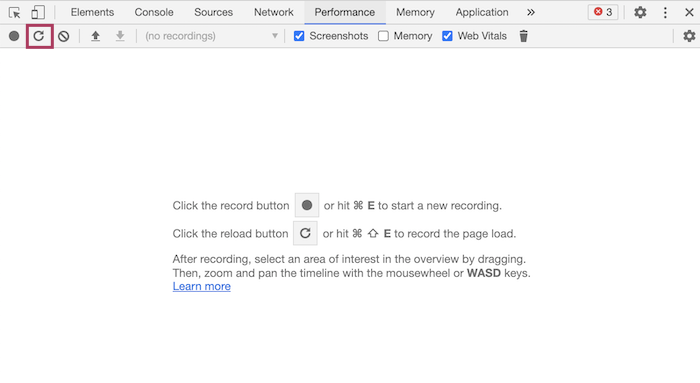
You might prefer running performance tests in Incognito Mode, as Chrome extensions can impact site performance.
Overview of the Performance tab
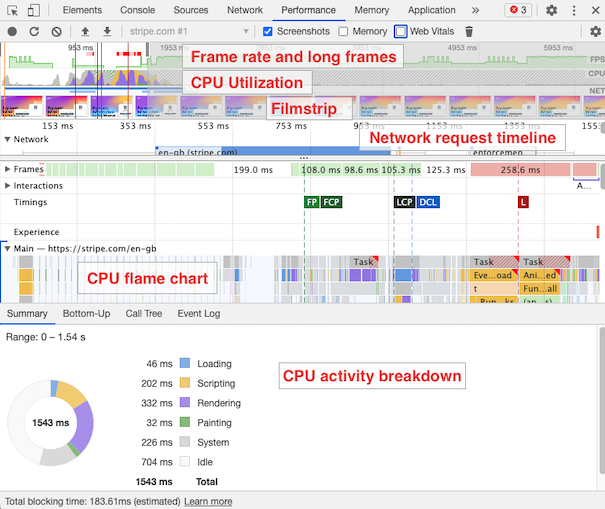
A Performance profile in Chrome can get pretty complicated! But having a wide range of information available means you can correlate different types of page activity and identify the cause of a performance problem.
The next few sections will look at a few key components of the Performance tab and how to interpret the data in them.
CPU utilization timeline
This chart shows how busy the CPU is with different types of tasks, usually mostly JavaScript (yellow) and Layout work (purple).
CPU activity normally becomes fairly quiet after an initial burst of activity, as you can see on the Stripe homepage.
![]()
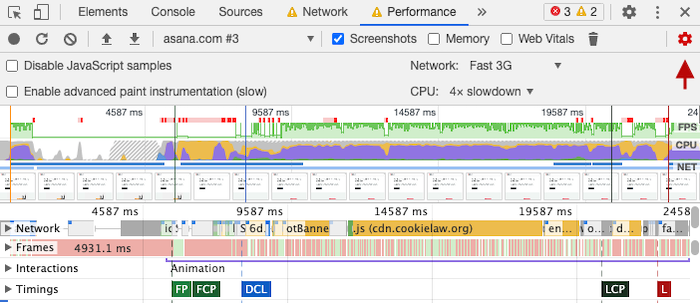
The example below is from the Asana homepage, and you can see that the CPU remains busy after the initial page load. Especially on slower devices this could make the page slow to interact with.

Filmstrip
The filmstrip recording shows the rendering progress of your website in an intuitive way. You can hover over the filmstrip to see a screenshot from that point in time.
Starting the recording from a blank page
When using the Start profiling and reload page option it can be hard to tell at what point the page started rendering, as the filmstrip shows the fully rendered page from the start.
You can record a filmstrip starting from a blank page instead:
- Go to about:blank
- Click on the Record icon in the Performance tab
- Once the page is loaded click the Record icon again to stop the recording
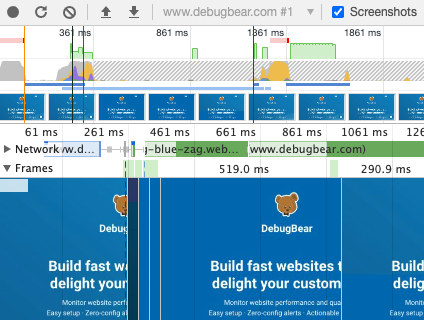
The page now starts from an empty page and then gradually renders. I also used network throttling to make the page render a little more gradually.


Monitor Page Speed & Core Web Vitals
DebugBear monitoring includes:
- In-depth Page Speed Reports
- Automated Recommendations
- Real User Analytics Data
Network request timeline
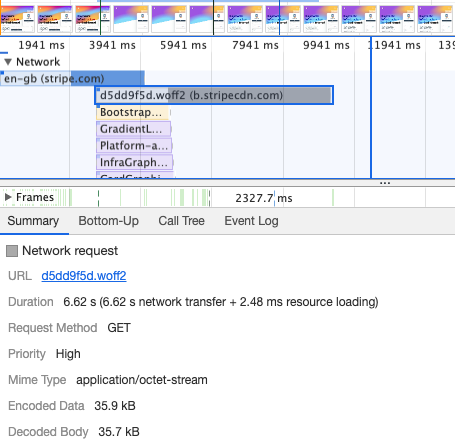
The network section shows a request waterfall, starting with the HTML request at the top and then showing additional requests below it.
Click on each request to see additional information like the full URL, request duration, resource priority, and download size.
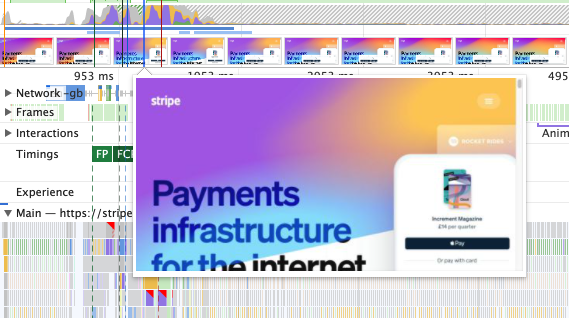
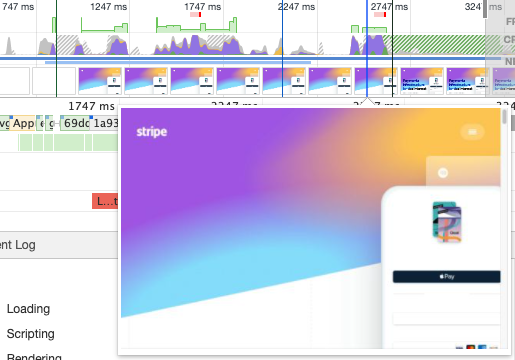
The network timeline is especially useful to correlate requests to UI updates or CPU activity. For example, this screenshot shows the Stripe homepage just before a font finishes loading.
If you see a change in the UI you can look at the requests section to identify what network request was holding back the UI update.
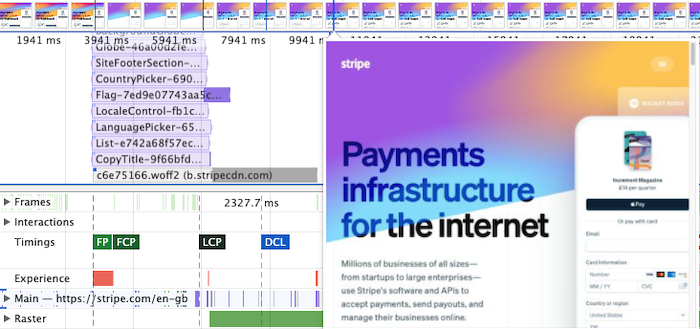
In this screenshot from immediately after loading the font file you can see that the UI has rerendered using the downloaded font.
CPU flame chart
The main-thread CPU section contains an inverted flame chart showing how CPU tasks are broken down into different components.
For example, you can see a waitForCssVars function call in the flame chart. Looking above it tells us that this function was called by an anonymous function, which in turn was called because it was used as a requestAnimationFrame callback.
We can also see that the init function is called from within waitForCssVars.
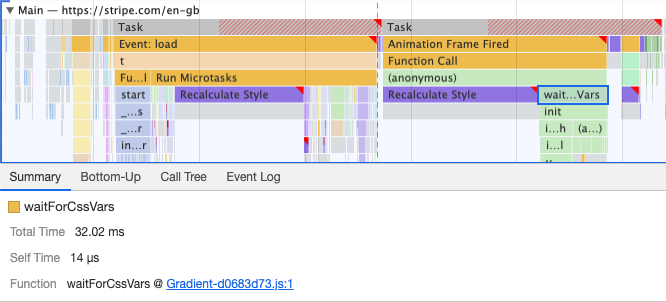
Selecting a JavaScript function in the flame chart will show additional information about this function call, including the source location.
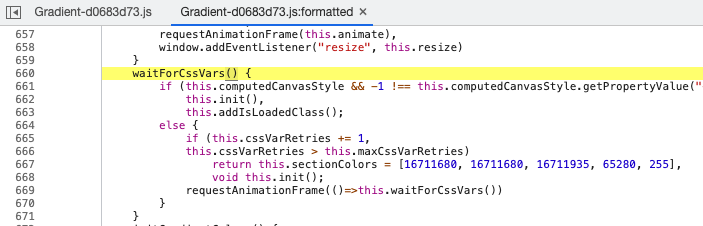
Clicking on the source location navigates to the source code. I also used the Prettify button in the bottom left of the Sources panel to make the code readable.
Forced reflows
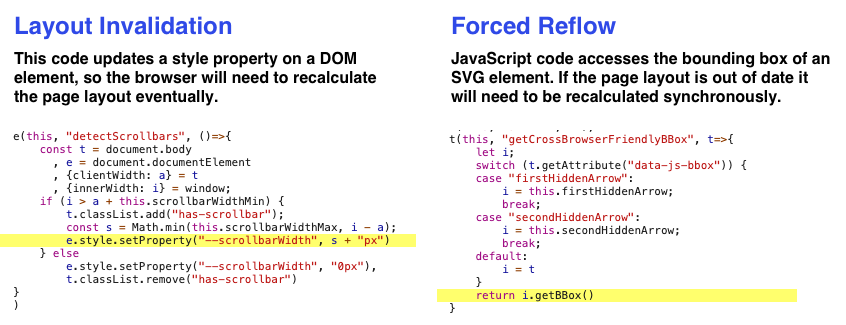
Normally the browser first finishes running JavaScript code and then updates the UI for the user. A forced reflow is when JavaScript code accesses an element's layout properties while there are pending UI changes that could affect the layout properties of the element. The browser has to calculate the layout updates synchronously while JavaScript code is running.
Forced reflows don't always have a large impact on performance. Forced style recalculations pull work forward, so if the layout doesn't change later on then no additional work is required.
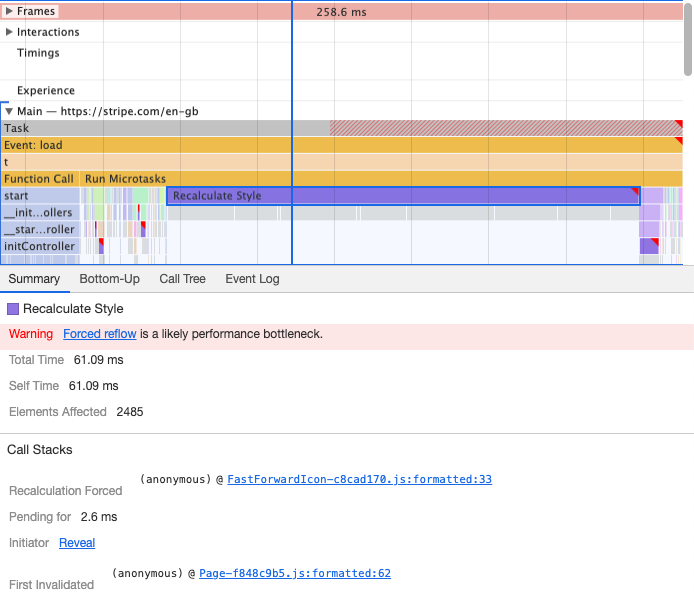
The detailed CPU task data provided by Chrome's profiler can help understand and debug synchronous layouts. The style recalculation task points to two locations in the source code:
- Recalculation Forced: The code that triggered the relayout by accessing DOM element properties that depend on the layout
- First Invalidated: The code that changed the DOM, meaning layout recalculations would be necessary the next time the UI is updated
Aggregated task breakdown
If no specific CPU task is selected, the details panel at the bottom of the Performance tab shows an overall breakdown of CPU activity into four categories:
- Loading: Making network requests and parsing HTML
- Scripting: Parsing, compiling, and running JavaScript code, also includes Garbage Collection (GC)
- Rendering: Style and layout calculations
- Painting: Painting, compositing, resizing and decoding images
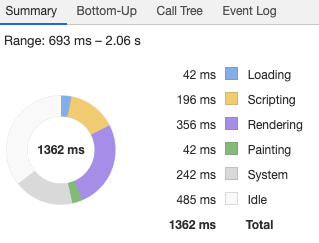
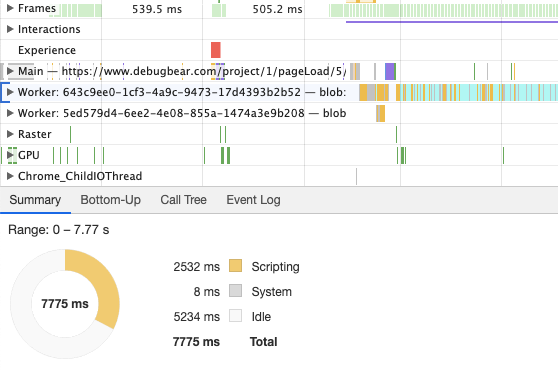
By default the page main thread is selected, but you can select different threads by clicking on them or by using the up and down arrow keys.
This screenshot shows the CPU breakdown for a web worker.
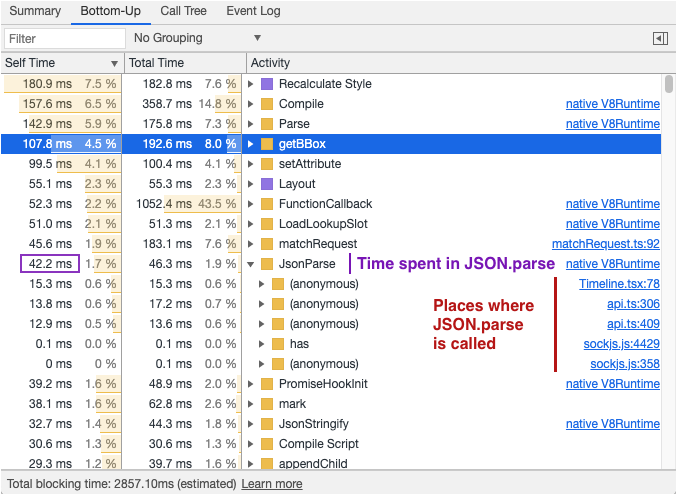
Bottom-Up tab
You can select the Bottom-Up view to see a more fine-grained breakdown of CPU activities. It shows the lowest-level types of activities from the bottom of the call tree, so you'll often see native browser functions like getBBox or setAttribute.
Expand these low-level functions to find out what code is calling them. This helps you find the code that you have control over.
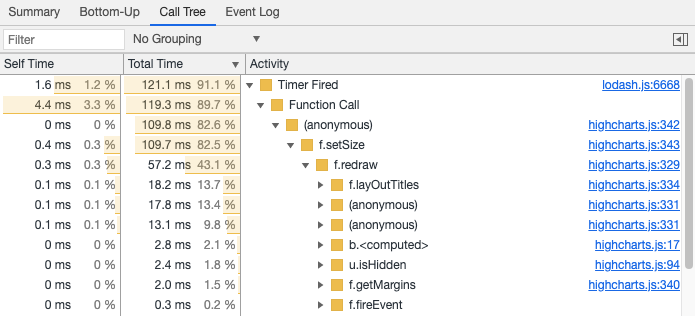
Call Tree tab
The Call Tree tab is similar to the flame chart: it shows how much time different subtasks and function calls contribute to the overall duration of a task.
The advantage over the flame chart is that the Call Tree aggregates repeated code invocations rather than looking at one call at a time. This makes it easier to see where time is spent on average.
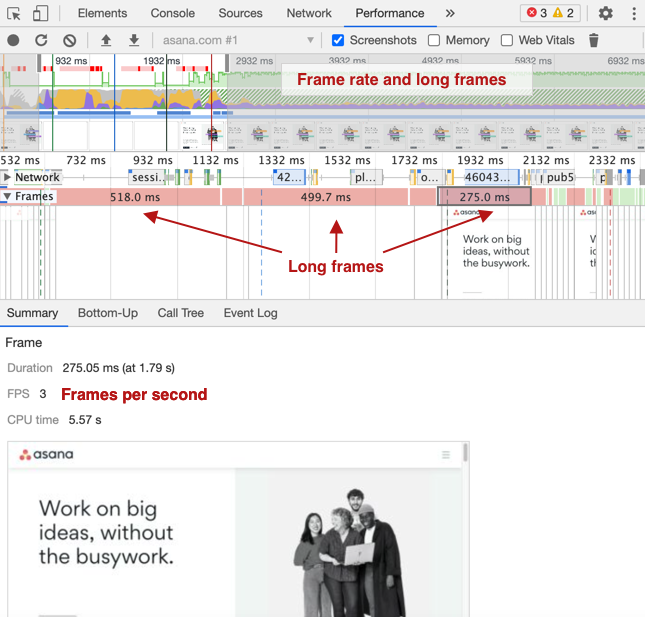
Frames and frame rate (FPS)
The Frames section of the Performance tab shows a screenshot of every UI update on the page. Each UI update is called a frame, and if the UI is frozen for a long time the frame is called a long frame. The screenshot below shows several long frames, where UI updates are delayed due to heavy JavaScript activity.
Long frames and the frame rate (Frames Per Second, FPS) are also shown right on top of the CPU activity chart.
If you click on the frame snapshot in the details pane you can step through all captured frames in order.
Keep in mind that, on a web page, a low frame rate isn't always a problem. When playing a video game the UI is updating constantly, and you'll need a high frame rate. On a website it's normal for the frame rate to go down to zero after the initial page load, unless there are ongoing animations.
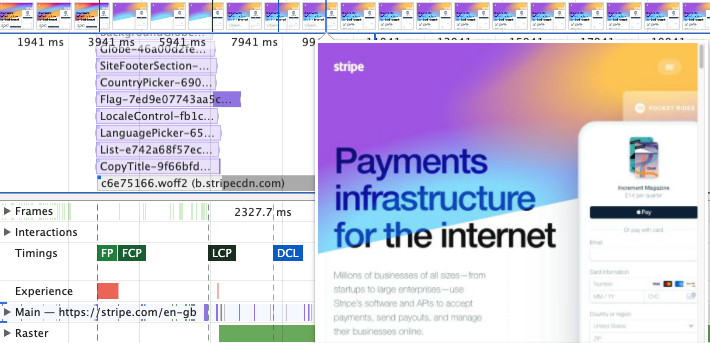
Web Vitals and other timings
The DevTools Performance tab can also show Web Vitals and User Timing metrics.
The Timings lane also shows the First Paint (FP) and the DomContentLoaded (DCL) and Load (L) events.
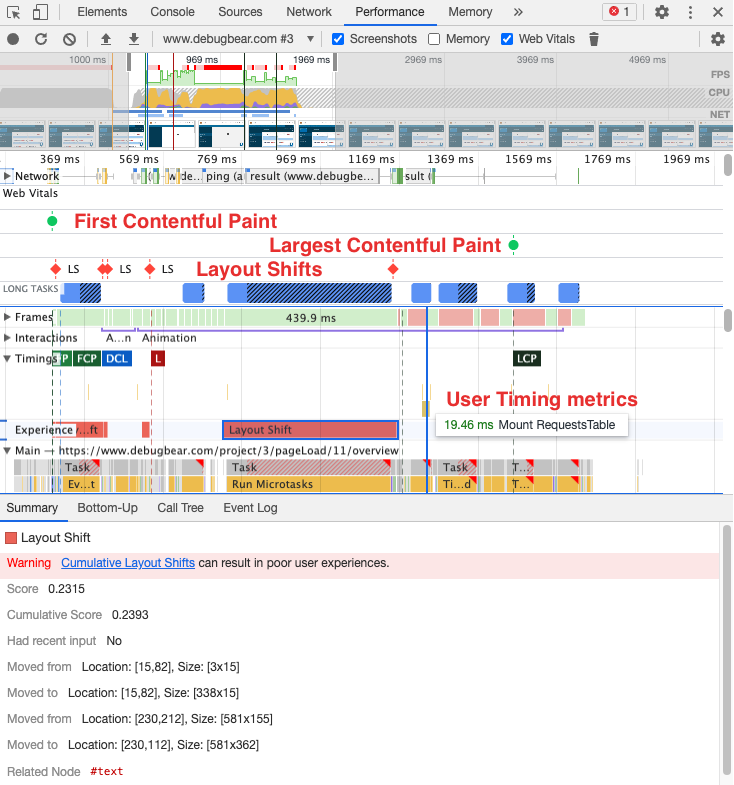
Hovering over a layout shift in the Experience lane will highlight the DOM node that changed position on the page, assuming that DOM node still exists. Clicking on the layout shift entry shows additional information like the location the element moved from and to.
The Long Tasks lane shows CPU tasks that take longer than 50ms to run, making the page less responsive to user input. The time in excess of 50ms is counted as blocking time, which is marked using black stripes. This can help you debug the Total Blocking Time metric.
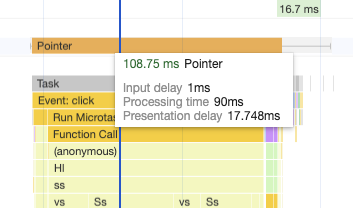
Look at the Interactions lane to see slow interactions and debug slow INP. Read this article to take a deeper look at how to debug INP with Chrome DevTools.
CPU throttling
When optimizing the speed of your website you'll often run into situations where the site is fast on your device but slow for some of your users. For example, pages often load more slowly on phones with slow CPUs than on a desktop device.
DevTools can throttle the CPU and network connection in order to emulate how a user on a slower device would experience your website.
To throttle the CPU, click the gear icon in the Performance tab – not the one at the top right of DevTools! You can then enable a 4-6x slowdown of the CPU.
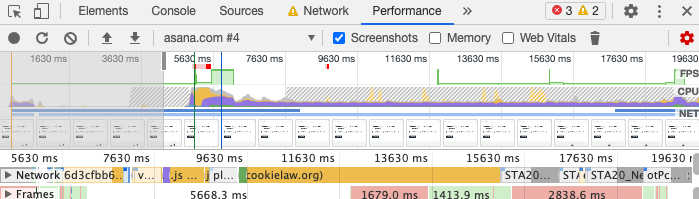
The screenshot above shows that on a slower device the CPU remains busy even after the initial load. This can make the page less responsive to user interaction, as well as using extra battery power.
For reference, compare the CPU chart above to the one below, where the CPU isn't throttled.
Using throttling to make page activity easier to understand
In addition to emulating the page experience of your users, throttling also makes it easier to investigate performance problems.
Unless your page is really slow, when loading a page hundreds of events often happen at once, making it hard to understand the relationships and dependencies of different types of page activity. Applying Slow 3G and 6x CPU slowdown throttling will make the page load really slowly, allowing you to look at network requests and CPU tasks one at a time.
Advanced paint instrumentation
The Enable Advanced Paint Instrumentation option collects additional debug data about page rendering performance. Collecting this data slows down the page, so if this setting is enabled other performance metrics will be less accurate.
If you find a slow Paint event in the timeline you can select it and get a detailed breakdown of what the browser has been drawing and how long it took.
You can also select an item in the Frames lane to see the layers (groups of page content) that make up the page.
Layers that were painted in that frame are colored in. Select each layer and find out why this part of the page was promoted to its own layer.
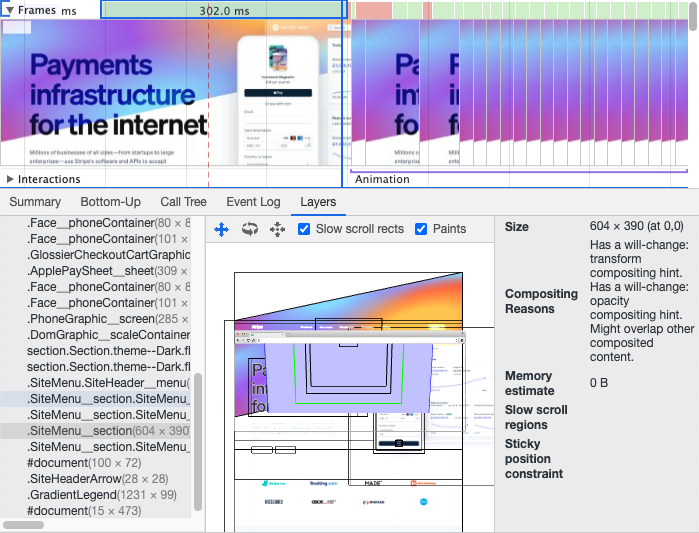
Looking at the Stripe homepage, one interesting thing is that there are layers for each section of the header menu.
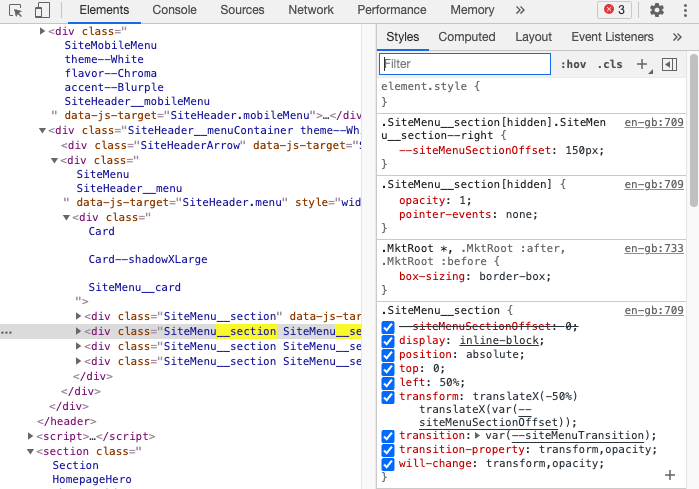
The position and opacity of the menu changes as the user hovers over the navigation, so Stripe uses the will-change: transform, opacity CSS property to make Chrome aware of this. Chrome then puts these elements in their own layer to speed up these transformations.
Monitoring performance with DebugBear
The DevTools Performance tab is a great tool for an in-depth performance investigation of your website. But it doesn't allow you to continuously monitor site speed or compare test results to each other.
DebugBear keeps track of site speed and the Core Web Vitals metrics that Google uses as a ranking signal.
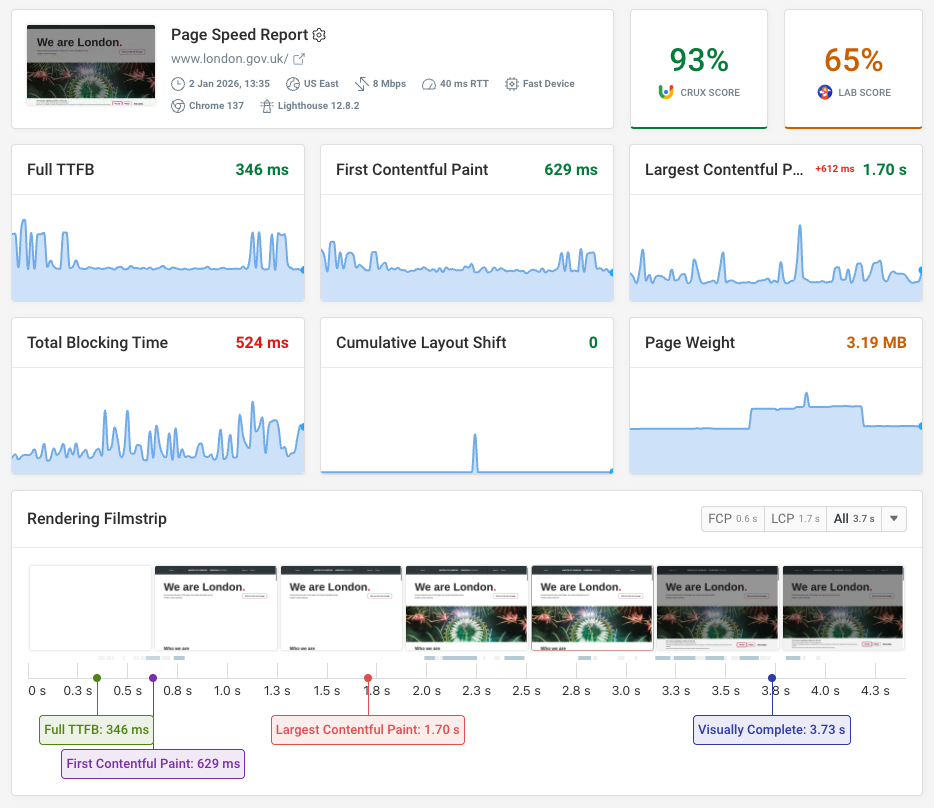
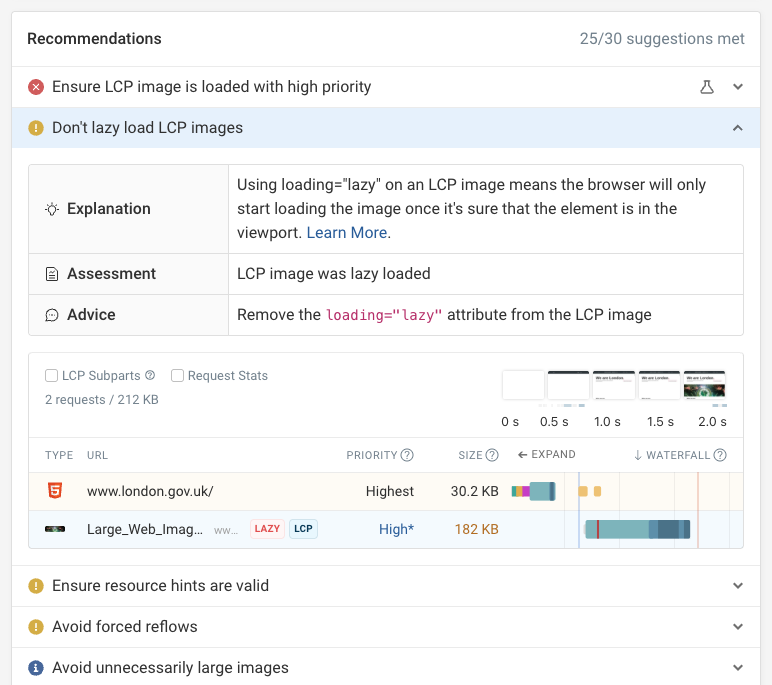
We also provide detailed debug data to help you understand and optimize web performance. Each test report includes detailed recommendations and a request waterfall that shows how loading different resources impacts rendering.
Monitor Page Speed & Core Web Vitals
DebugBear monitoring includes:
- In-depth Page Speed Reports
- Automated Recommendations
- Real User Analytics Data