
HAR files record network requests made in the browser and provide a way to share this debug data with developers.
Read this article to learn how to create a HAR recording and how to visualize it for easier analysis.
What is a HAR file?
The HTTP Archive (HAR) file format records what resources a browser loads when accessing a website.
When loading a website the browser requests a number of files from the server, for example HTML code, images, or fonts. The .har file records each of these requests, how the server responded, and how long the request took.
Logging these data exchanges allows users to exchange recordings with developers and other people working on the website. For example, HAR files can provide insight into:
- Specific resource requests that were unsuccessful
- Request details like login status or user agent
- Resources that took a long time to load
The HAR file enables troubleshooting by the website team and allows them to fix website performance issues.
How to generate an HTTP Archive file
All major browsers provide a way to record network requests that a made when loading a website and export this data as a HAR file. You can find this option in the Network section of the browser developer tools.
Chrome
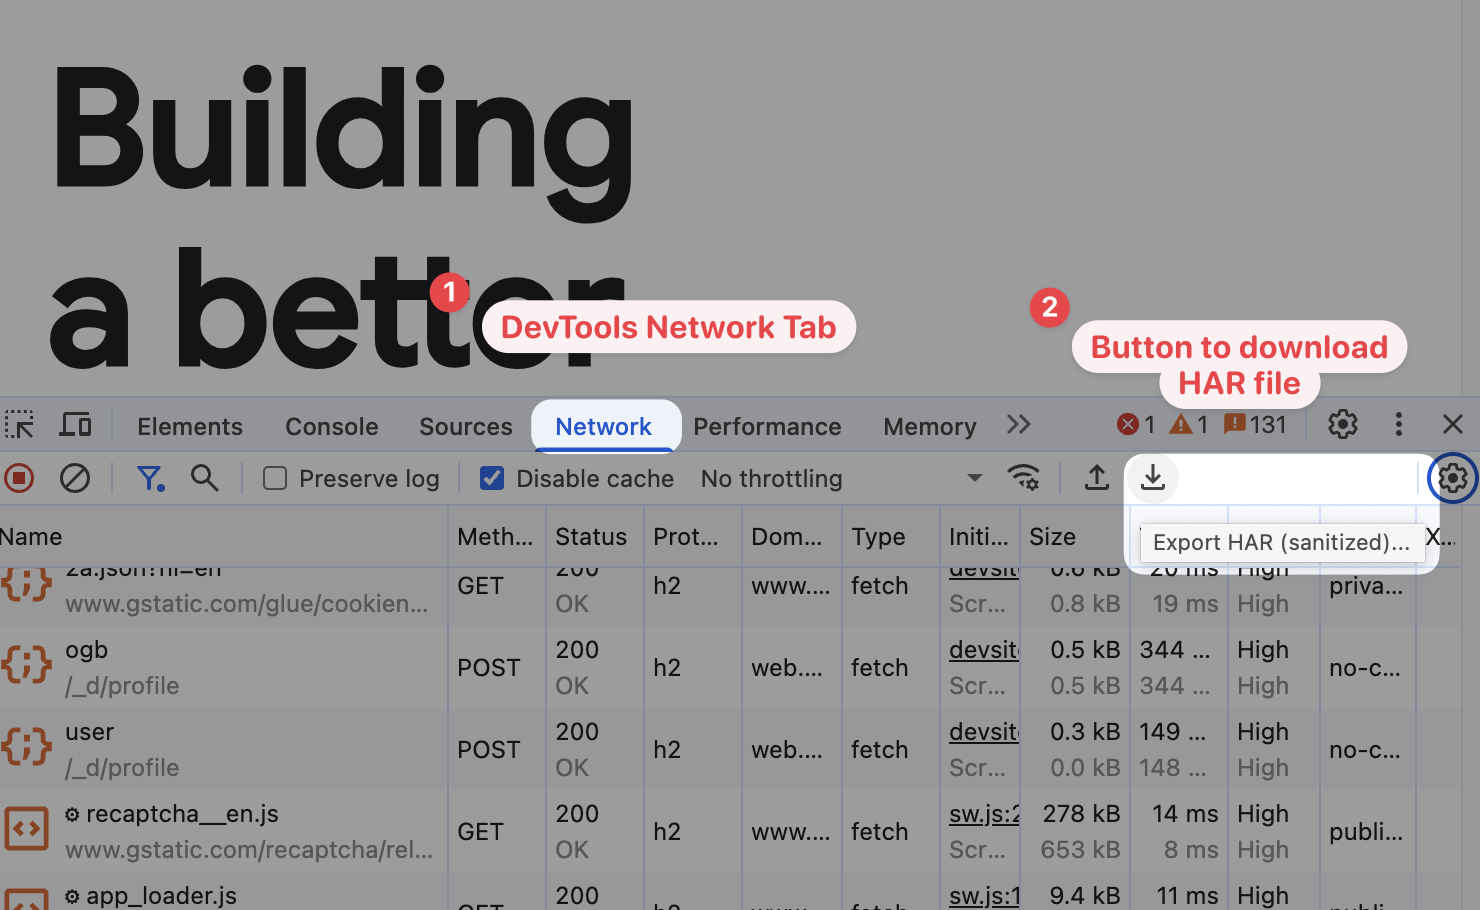
Chrome's developer tools have a Network tab where you can save recorded requests as a HAR file.
- Open Chrome DevTools: right-click the page and select Inspect
- Switch from the Elements tab to Network
- Reload the page and interact with the page to replicate any issues
- Click the Export HAR (sanitized) icon
- Select a destination on your hard drive
You can then share the HAR file with the person who needs to investigate it in more detail.
What is a sanitized HAR file?
When loading a website the browser often sends sensitive information to the server, for example session cookies. If this information is shared the recipient of the HTTP Archive file would be able to take over the visitor's login session.
To avoid that, Chrome sanitizes the HAR export: it removes cookies as well as authorization and set-cookie headers.
Even a sanitized HAR file can contain private information if that information is loaded by the page. Don't share HAR recordings if you don't trust the recipient.
Safari
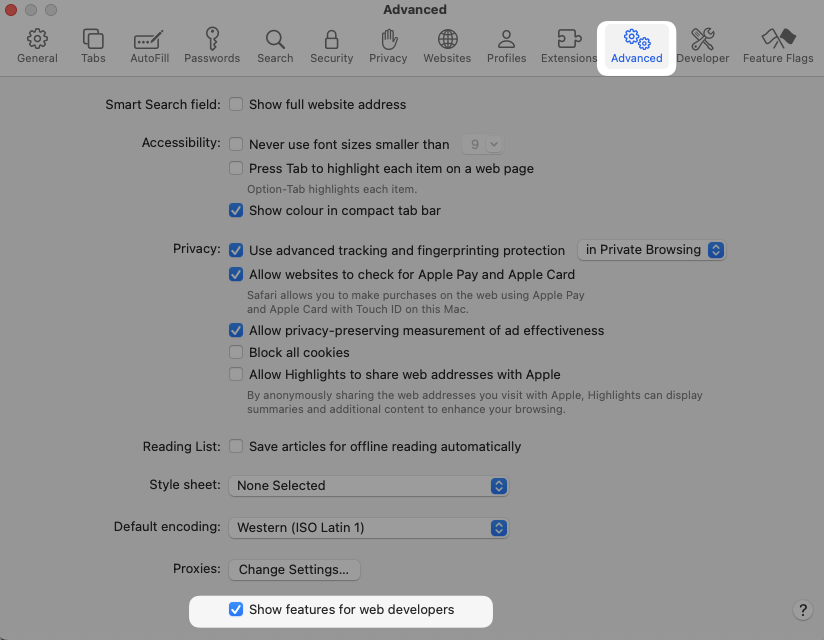
To create a HAR recording in Safari, first make sure you have Safari developer tools enabled. Open the Safari settings, select the Advanced tab and check that Show features for web developers is enabled.
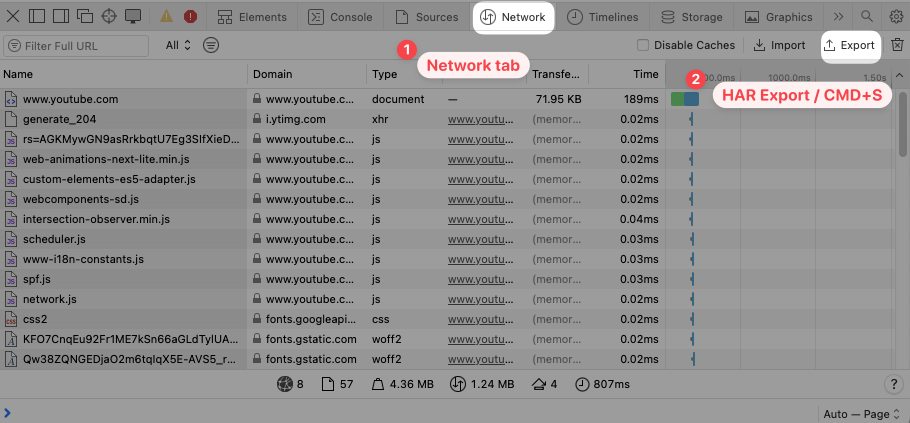
Then follow these steps:
- Right-click the page and select Inspect element
- Open the Network tab
- Collect the requests you want to record
- Click on the Export button
You can also simply press CMD + S on your keyboard to save the HAR file.
Firefox
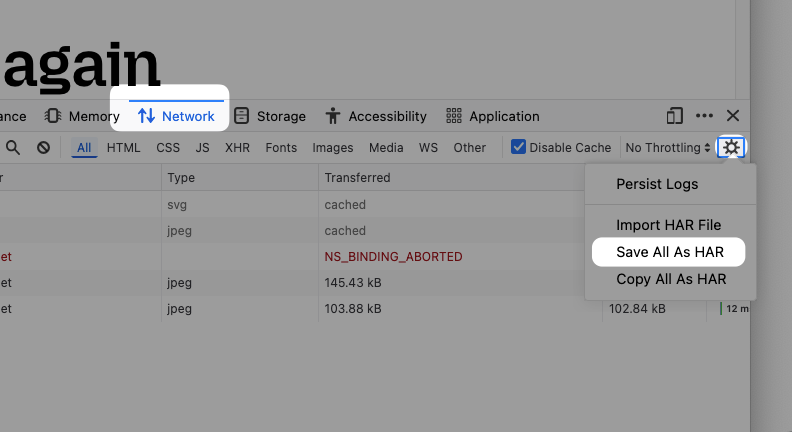
Firefox also lets you export the request log via the developer tools.
- Right-click the page and click Inspect
- Select the Network tab
- Reload the page to record the network requests
- Click the gear icon in the top right
- Select Save All As HAR
How to open HAR files
Many free tools are available to view and analyze HAR files:
- DebugBear's HAR File Analyzer
- Chrome DevTools
- Google's HAR Analysis Tool
DebugBear HAR File Analyzer
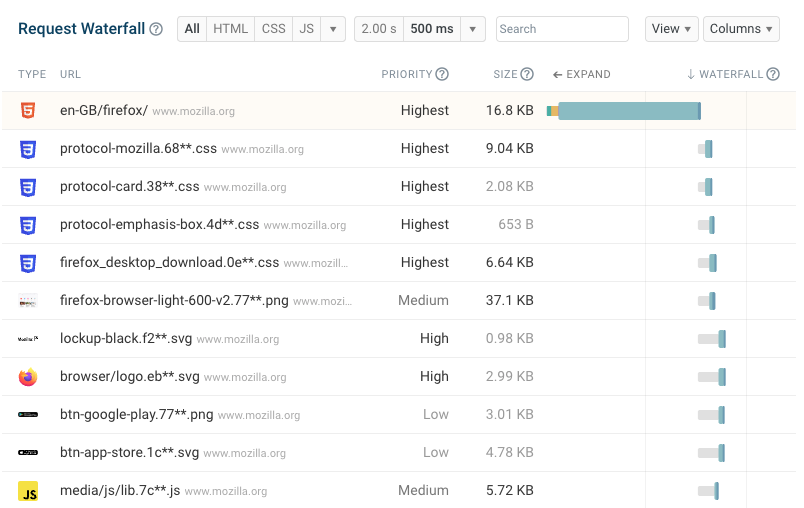
DebugBear's HAR File Analyzer can visualize your HAR recording and show you what resources were loaded by the browser.
Simply drag your HTTP Archive file into the file picker to start the analysis. You'll get a request waterfall view listing resource requests along with data on how much time was spent on each component of the request.
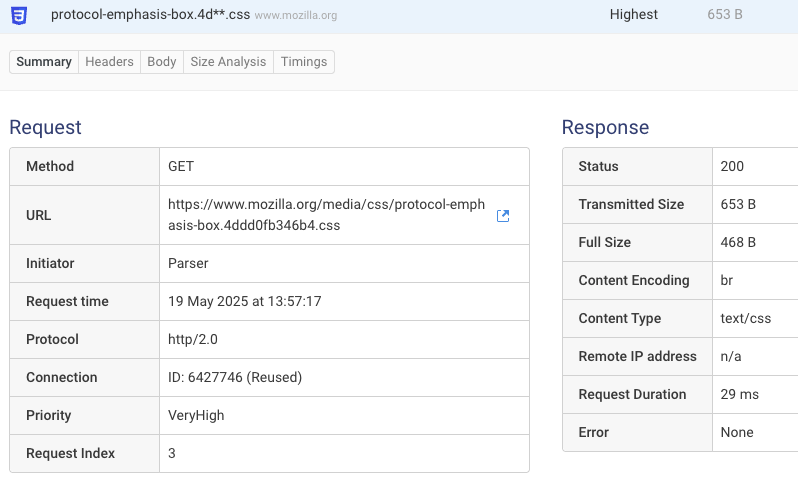
Click on a request to expand it to view details like the full request URL, HTTP protocol or content encoding.
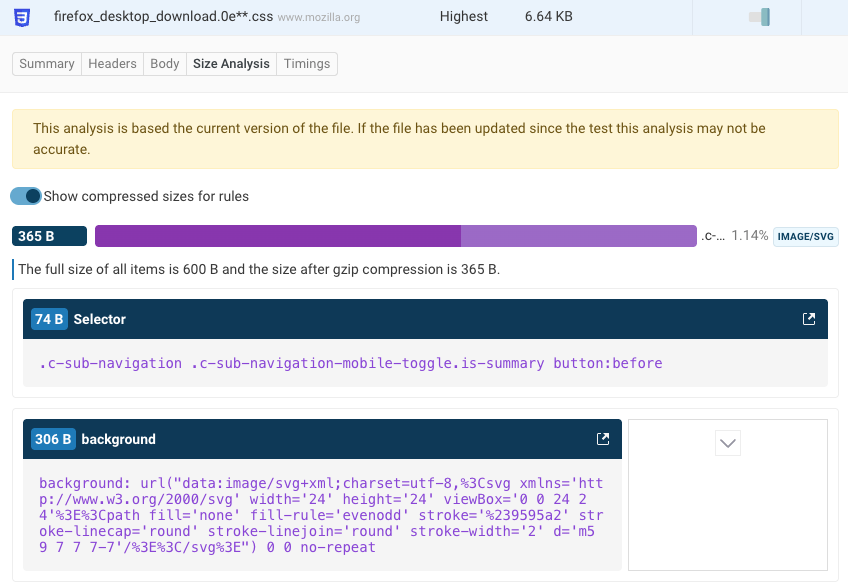
You can also view the full response body or a size breakdown for HTML and CSS files.
Load HAR file in Chrome DevTools
Chrome DevTools doesn't just let you record HAR logs but also lets you import and view existing ones. Click on the Import HAR file button in the Network tab to view the list of requests.
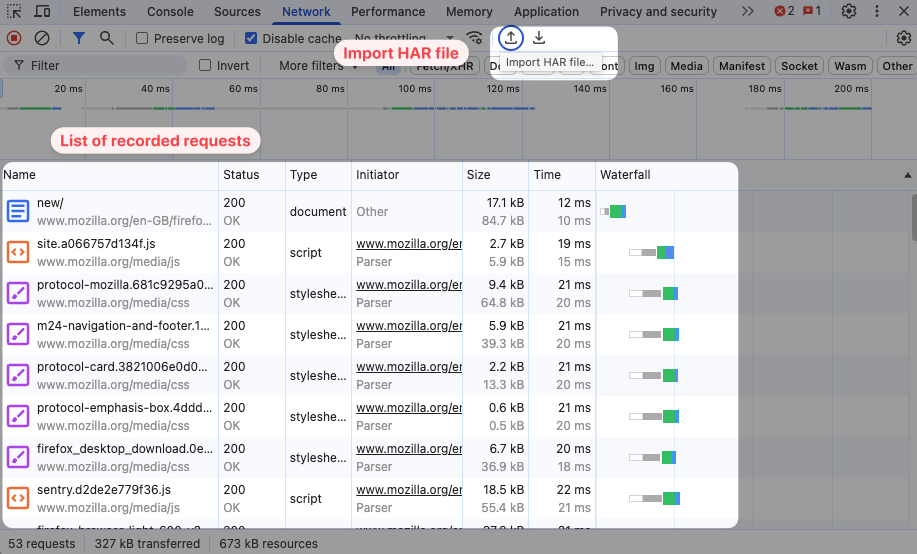
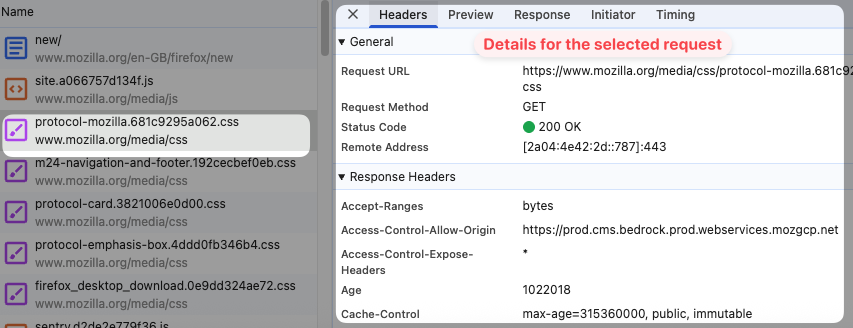
Click on each resource to see view details like request headers, response headers, or the response status code.
Google Admin Toolbox HAR Analyzer
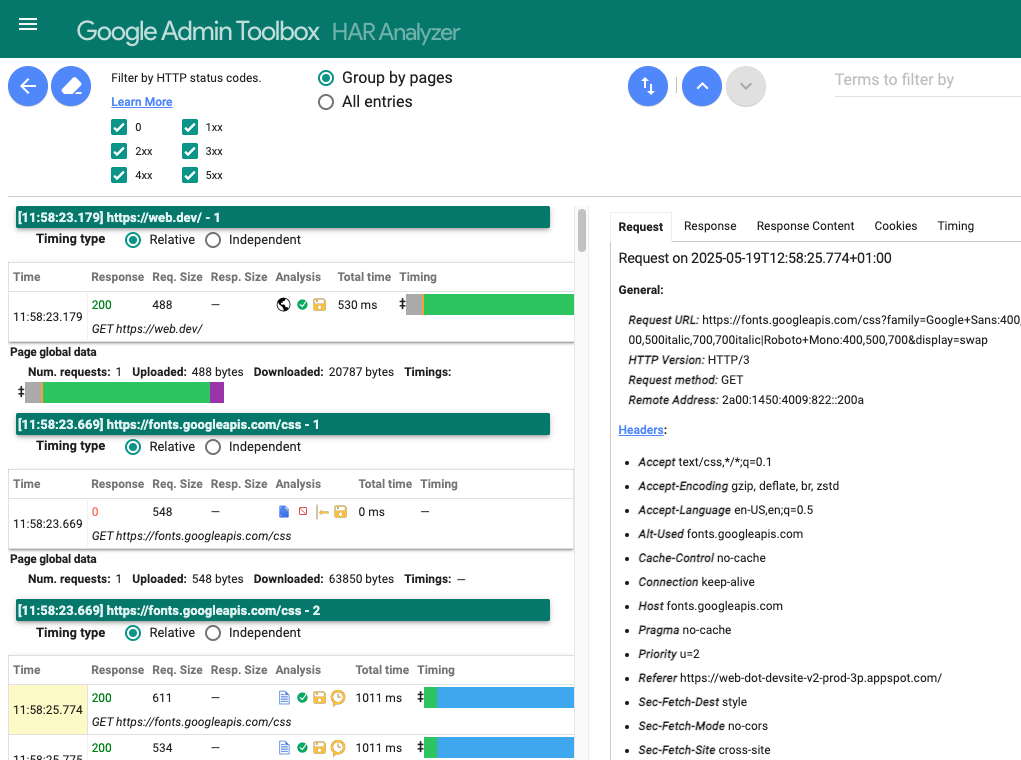
Google has built a dedicated HAR Analyzer tool for viewing HTTP Archive data.
Upload your HAR file to see what resources were transferred when loading the page. You can filter the requests by response status code and use the Terms to filter by search field to filter by request URL or response body content.
What's included in a HAR file?
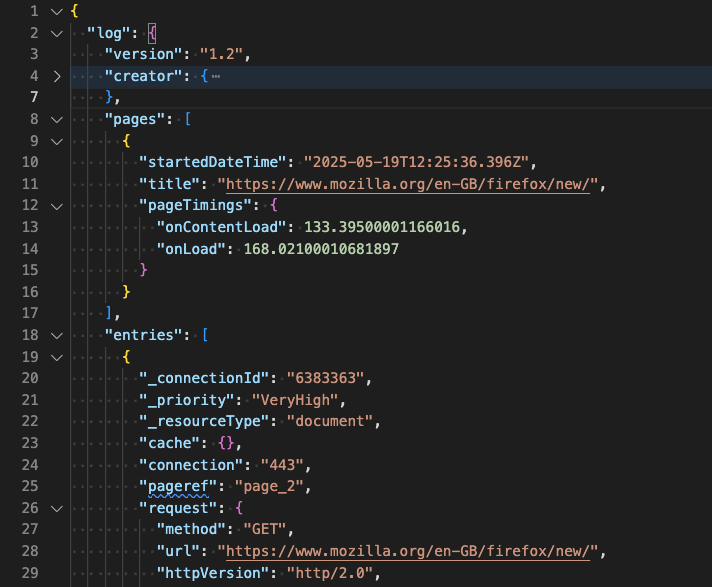
HAR files encoded request data using the JSON format. You can open HTTP Archive files with a text editor to view the full raw data that's been saved. Then pages key records URL navigations in the tab, while the entries property contains the detailed resource entries.
A bunch of information is included for each resource:
- The request method and URL
- Chrome also includes the request priority and resource type
- Request headers
- Connection details like IP address, connection ID, and HTTP version
- Response headers
- The response body content
- Resource and HTTP header size
- Request duration details and breakdown
Cookies can also be included if the HAR export is not sanitized.
Capture network requests in a lab environment
HAR files are great if you have a specific issue on a website and want to share debug data with other people. However, for page speed analysis they aren't always consistent and representative of a specific visitor experience.
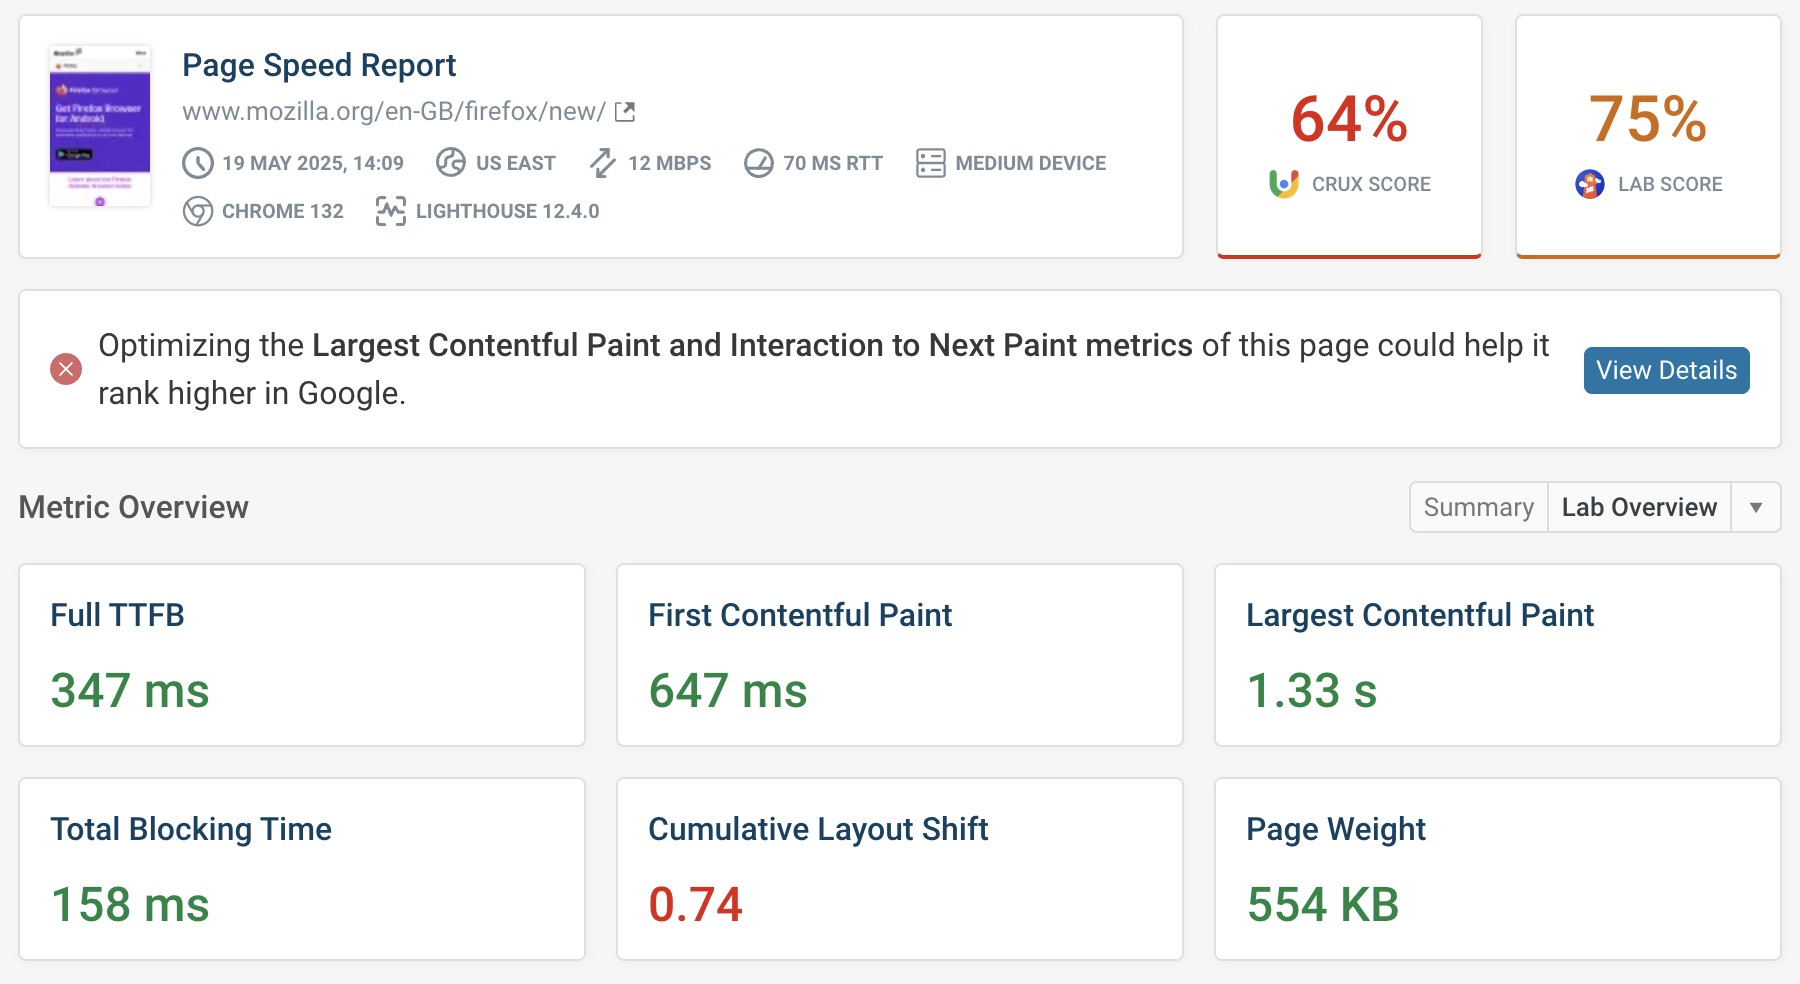
Running a website speed test can give you a more detailed performance analysis that goes beyond just network requests. Page speed testing tools use a dedicated testing environment to measure loading speed and identify high-impact optimizations.
You can also monitor website performance continuously to see page speed trends and identify new or updated requests that are causing performance issues.
DebugBear is a monitoring tool built to help you track and optimize Google's Core Web Vitals metrics that impact search result rankings.


Monitor Page Speed & Core Web Vitals
DebugBear monitoring includes:
- In-depth Page Speed Reports
- Automated Recommendations
- Real User Analytics Data