Opening a page in the Google Cloud Console always takes a long time.
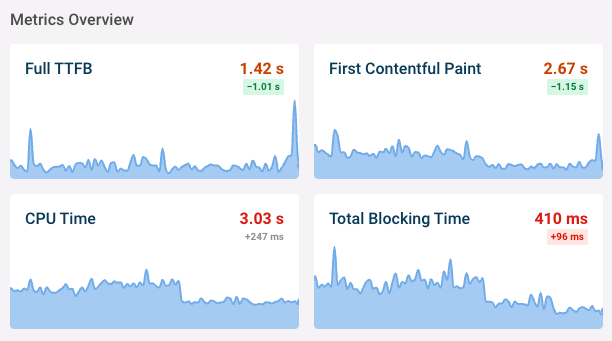
Here are some metrics I collected on a high-end 2018 MacBook Pro on a UK-based Gigabit internet connection.
| Page | Download | JavaScript | CPU Time | Main Content | Fully Loaded |
|---|---|---|---|---|---|
| Cloud Functions | 4.2 MB | 15.7 MB | 5.3s | 6.7s | 8.1s |
| Compute Engine | 4.5 MB | 15.1 MB | 6.5s | 6.7s | 8.1s |
| Cloud Storage | 4.3 MB | 16.2 MB | 6.2s | 6.5s | 8.2s |
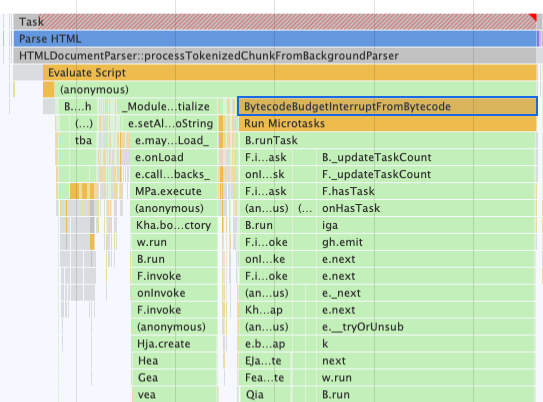
We can see that each page loads over 15 MB of JavaScript code. A look at the performance timeline in Chrome DevTools confirms that running this code is the primary cause of the poor page performance.
This article will take a closer look at the page load process of the Google Cloud Functions page, and examine how it could be sped up.
You can use these strategies to investigate and improve the performance of the apps you're working on.
Loading the HTML document
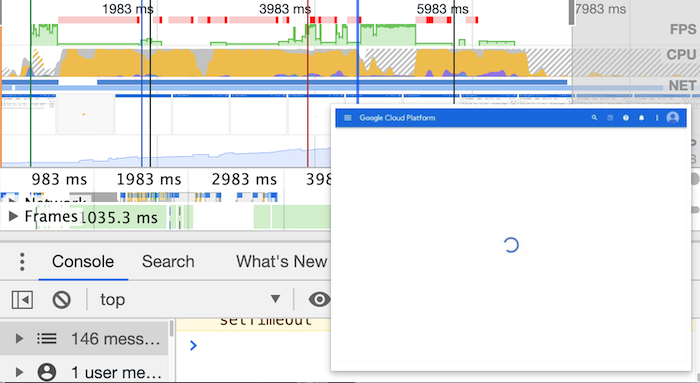
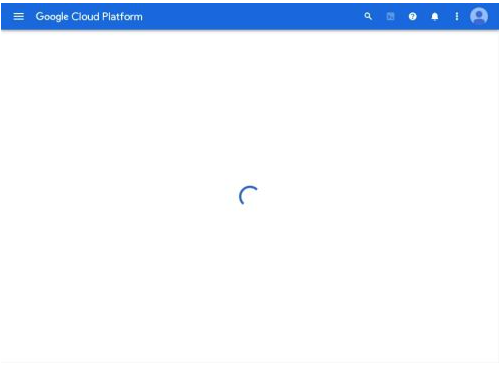
The initial HTML request is very fast and only takes about 150ms. It contains an embedded SVG spinner that shows while the first chunk of JavaScript code is loading.
Loading the initial JavaScript bundles
These are the first two JavaScript bundles the page starts loading.
- routemap 21 KB (103 KB uncompressed)
- core,pm_ng1_bootstrap 1.3 MB (4.8 MB uncompressed)
These files don't take too long to download, but running the code freezes the UI for a while. The spinner SVG becomes stuck at this point, until it's replaced by a skeleton UI for Google Cloud Console page.
Here's what happens when the browser wants to run some JavaScript code.
- Parsing (done lazily at first, and then as needed later on)
- Compilation (also happens lazily)
- Initialization – the browser runs module initialization code, i.e. code that runs when loading a module rather than when calling one of its functions
- Running core app code – renders the application using the initialized modules
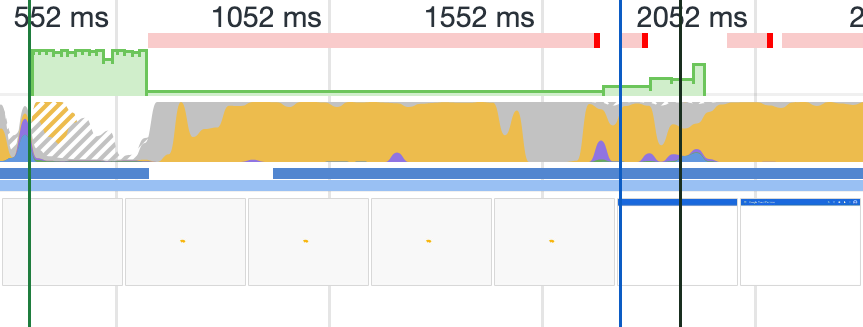
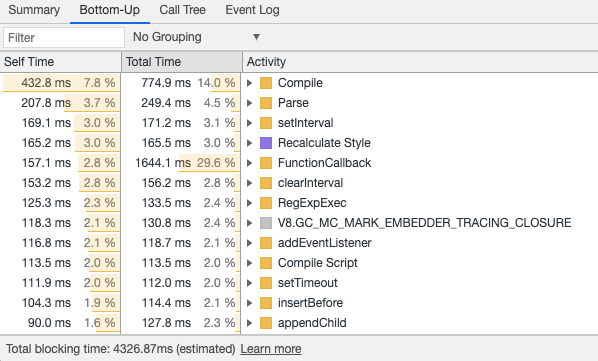
For the whole Google Cloud page, just parsing the source code takes 250ms, and compilation takes another 750ms (not including the 113ms spent on "Compile Script").
The initial render of the Angular app takes about 1s.
Eventually we start to see a new spinner.
Loading page bundles
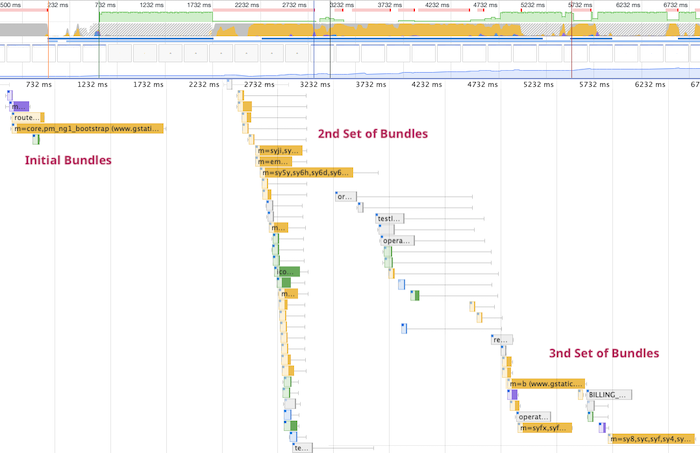
Once the generic Google Cloud UI is rendered the page starts loading 18 additional JavaScript files with an overall size of 1.5 MB.
Making a lot of separate requests isn't actually a problem though – it can improve performance by increasing the likelihood of cache hits, and splitting up bundles makes it easy to load only necessary code.
After loading the first set up bundles the app starts making fetch requests and loads 3 more bundles at a total size of 6 MB.
When loading the page on my normal network the requests all kind of blurred together and it was hard to see which requests were sequential. So this screenshot shows the request chart on a throttled connection.
Loading the list of Cloud Functions
The request loading the list of Cloud Functions takes about 700ms. But it doesn't start as soon as the bundles are loaded, in part because there's a testIamPermissions request that needs to finish first.
As a result the CPU ends up being idle for half a second – this time could be used better if the request started sooner.
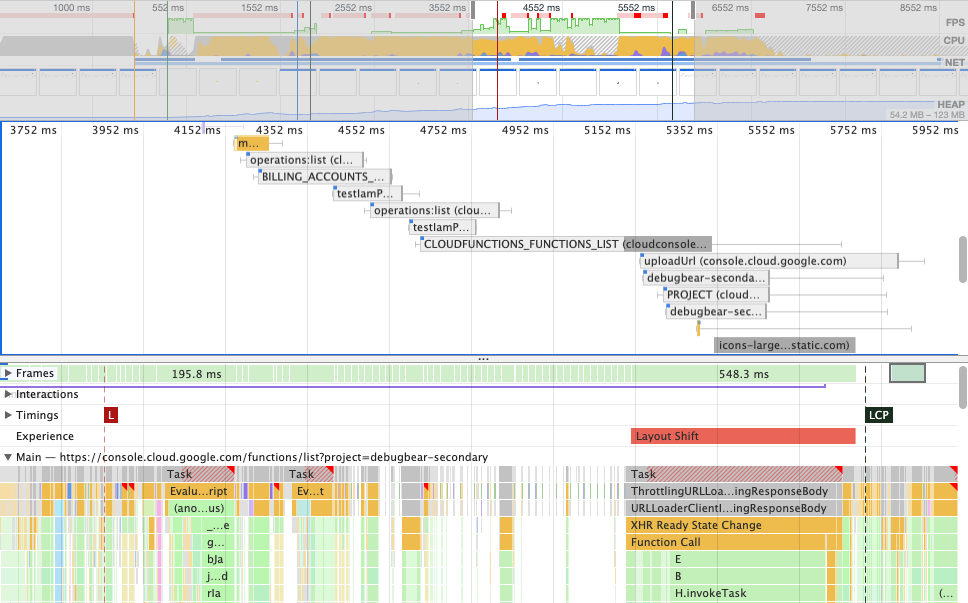
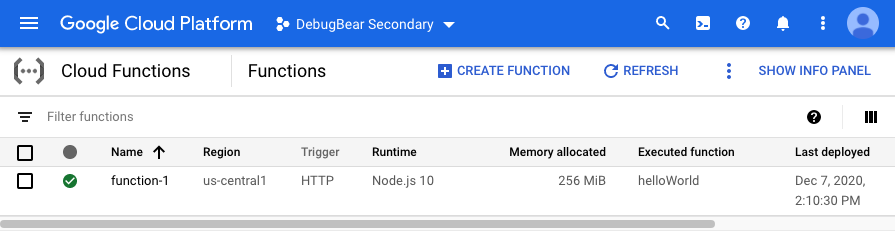
Finally the app re-renders and we get the list of Cloud Functions we wanted to see.
Detecting unused code in Chrome DevTools
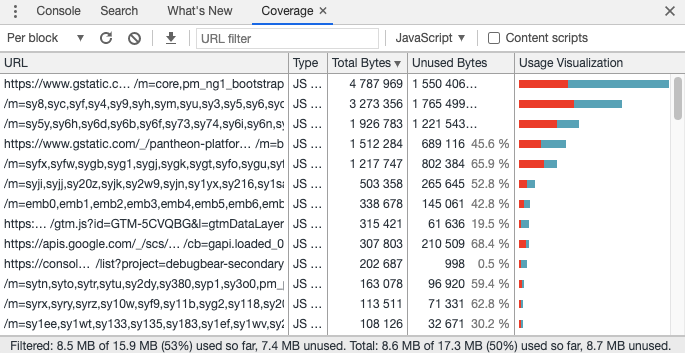
Chrome DevTools has a code coverage tool tracks which parts of the code actually run on the current page. This can help identify code that doesn't have to be loaded.
The Cloud Functions page runs 53% of the JavaScript code it downloads. This is actually a bit disappointing, as it means that even if only necessary code is loaded it would still only cut the total JavaScript size of the page in half.
Moving configuration into JSON
A good amount of the code actually consists of configuration objects. For example, this 200 KB object with 4997 keys.
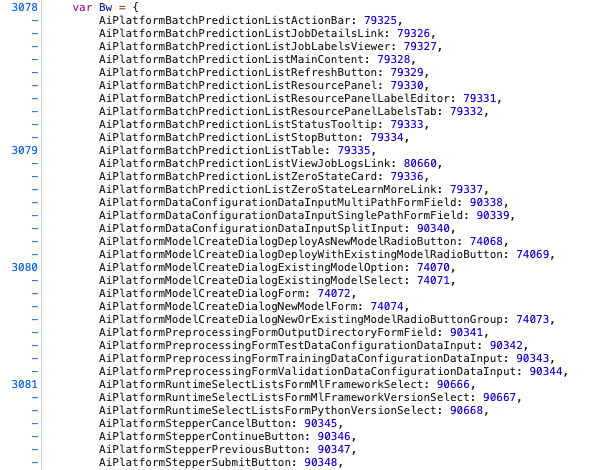
Loading this as a JSON string with JSON.parse could be faster, as JSON is simpler to parse than a JavaScript object. This would be easy to do, but might not result in a huge performance improvement.
Ideally the app wouldn't need to load the full list on the client, but this would be harder to implement.
Reduce code duplication
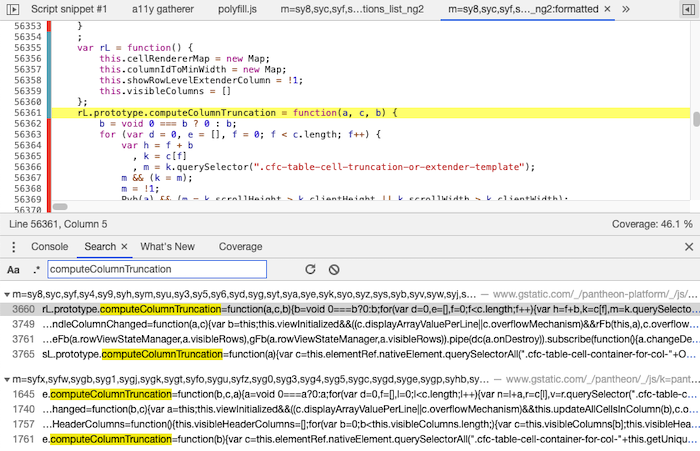
The 200KB JSON object above is actually included in two of the JavaScript bundles. Breaking it out and reusing it would save download and processing time.
The same seems to apply to a bunch of UI components, like this one.
Prioritize primary content
The Google Cloud page loads a large initial JavaScript bundle. The longer it takes to load and initialize this code, the longer it takes to load page-specific code and to render the list of Cloud Functions the user wants to see.
But the initial bundle also contains secondary content, like the complex navigation sidebar. This menu becomes functional before the main page content is loaded, but it should only be loaded after the primary content.
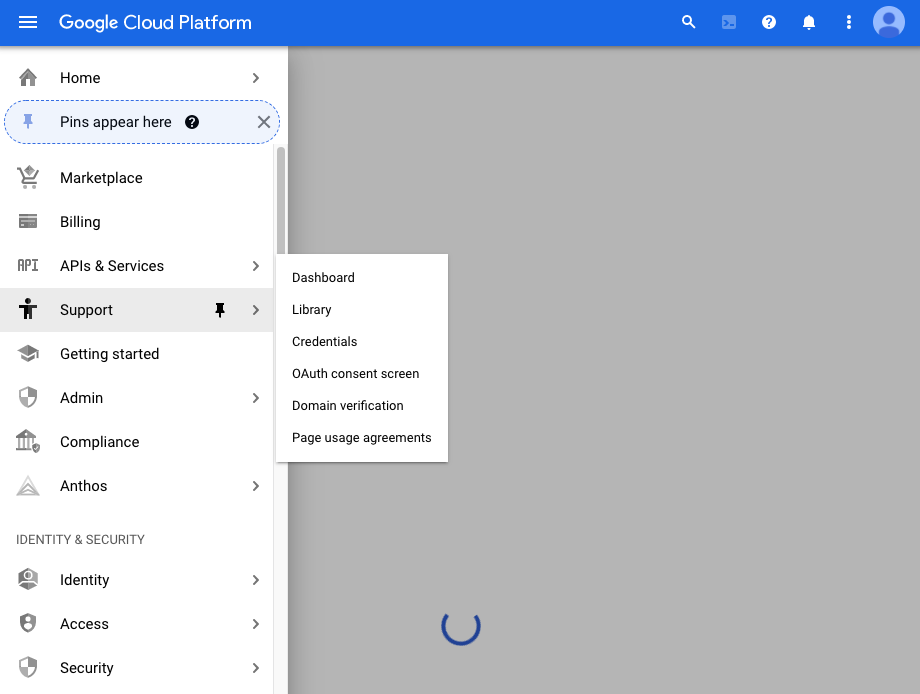
Google Cloud already does this in some cases. For example, the page initially renders a simpler version of the header and then loads more complex features later on.

Conclusion
While the performance of static pages tends to be dominated by render-blocking network requests, single-page apps are often blocked by JavaScript execution or loading account data.
Downloading large amounts of code can hurt performance on slow connections, but due to compression and caching CPU processing often has a greater impact.
If you want to track the performance of your website, including logged-in pages, give DebugBear a try.
Why is the Google Cloud UI so slow? This article looks at the performance of a large JavaScript application and explores how it could be made faster.https://t.co/HSHhCXYQCi
— DebugBear (@DebugBear) December 9, 2020
Monitoring the speed of your web app and making it faster
DebugBear makes it easy to keep track of the key web performance metrics of your site and produces in-depth reports showing you how to make it faster.
Start a free 14-day trial now.