A fast website is key to user experience and also impacts Google search result rankings. Server-side rendering (SSR) has emerged as a powerful technique to meet these demands for complex JavaScript applications.
In this article, we'll explore techniques to optimize server-side rendering performance in the Nuxt framework. From efficient data fetching, caching, to smart deployments and edge rendering, you'll learn how to build faster, leaner, and more scalable Nuxt applications.
What is Nuxt Server-Side Rendering?
In Nuxt, SSR (Server-Side Rendering) means that your pages are rendered on the server before being sent to the browser.
Instead of loading a blank page and relying on JavaScript to render everything on the client side, Nuxt generates the full HTML on the server and sends it to the user.
Server-side rendering makes the page load faster and appear more quickly to the user, which improves the user experience. SSR also helps with SEO, because search engines can crawl and index fully rendered pages more effectively.
This is especially useful for websites that need to be discoverable, like blogs or e-commerce sites.
Check out our article on Nuxt performance optimization to learn about other rendering modes like client-side rendering and static site generation.
Server Side Rendering is a default rendering mode in Nuxt but you can disable it like this:
export default defineNuxtConfig({
  ssr: false,
});
How does Server Side Rendering work?
Nuxt 3 has been completely rebuilt to offer enhanced performance and flexibility. At its core is Nitro, the new server engine that enables hybrid rendering, edge support, and file-based API routes.
When a browser requests a URL with universal rendering, Nuxt runs the Vue.js code on the server and returns a fully rendered HTML page – either generated on demand or from a cache. This gives users immediate access to the app’s content, unlike client-side rendering.
After the HTML loads, Vue.js runs again in the browser to make the page interactive by binding event listeners – a process called hydration. Once hydrated, the page supports dynamic features like transitions and interactivity.
This diagram explains how server-side rendering and hydration work for Nuxt.
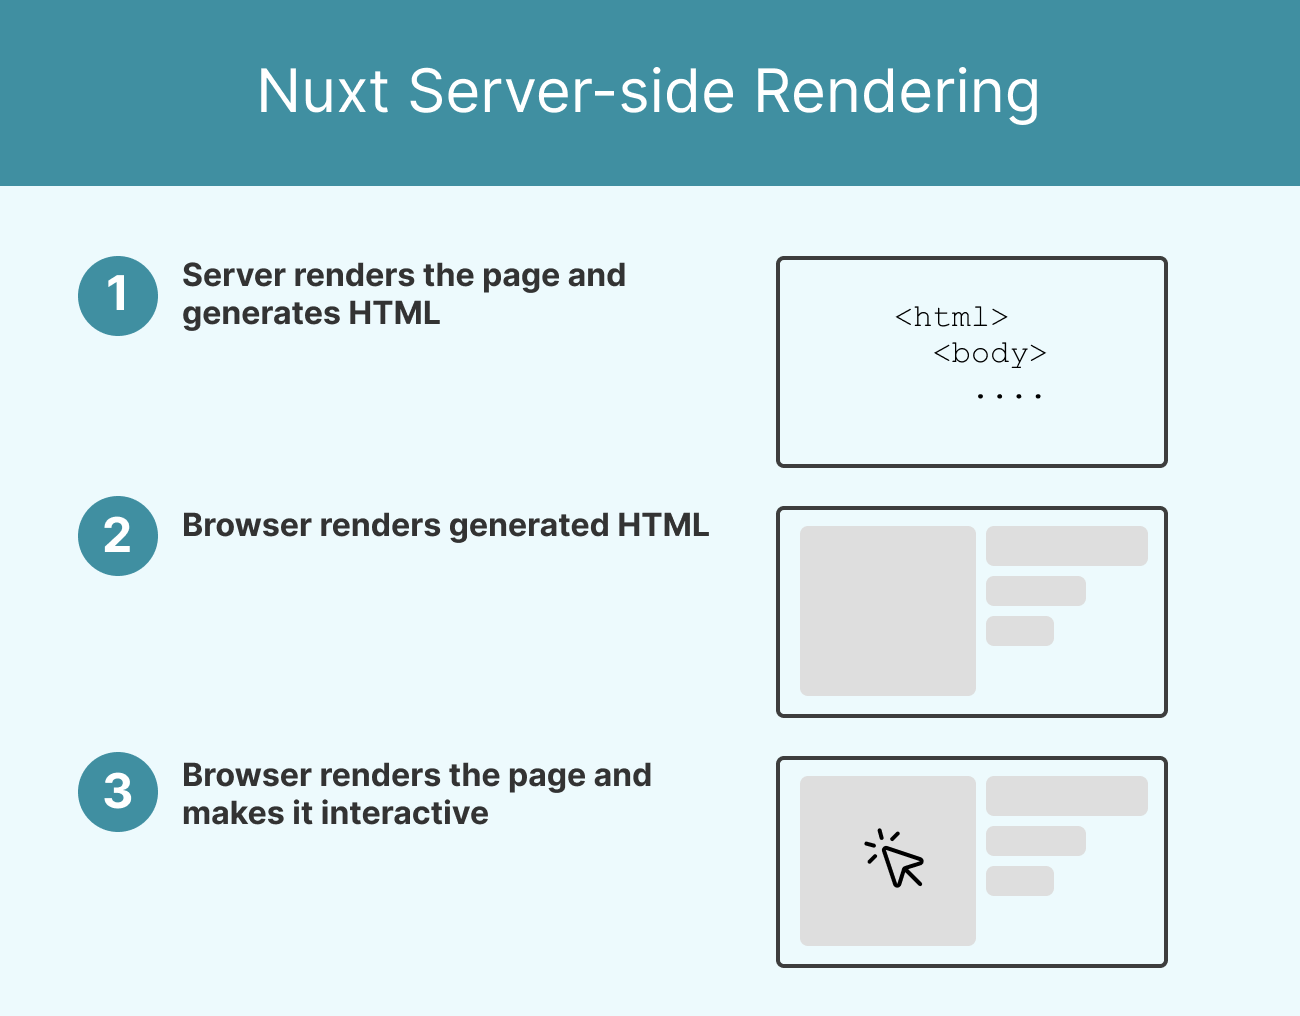
In SSR mode, here’s what happens when a request is made:
- Middleware runs before the request hits the page logic.
- API endpoints in the
/server/apidirectory are accessed via$fetchoruseFetch. - The page component’s lifecycle functions (
useAsyncData,useFetch, etc.) are executed server-side. - The fully rendered HTML is streamed to the client.
This process introduces opportunities for optimization at each step — especially in how data is fetched, rendered, and cached.
How to monitor Nuxt SSR Performance?
Use these tools to monitor real-time performance and identify regressions:
- Nuxt Devtools: Inspect hydration times, asyncData usage, and payloads.
- Chrome Lighthouse or DebugBear: Identify performance bottlenecks in SSR output.
- Nitro logs: Use
nitro:devto see route execution time and cache stats. - Sentry or Datadog: Capture real user metrics and backend errors.
- Payload Analyzer: Use
nuxi analyzeto detect large bundles or duplicated dependencies.
These insights allow you to make data-driven performance improvements.
What metrics matter for Server Side Rendering applications?
When optimizing a Nuxt SSR application, it's critical to track the right metrics. SSR performance isn't just about fast rendering: it’s about delivering a complete, responsive, and SEO-friendly experience.
The following metrics help you measure and diagnose your app’s performance from both server and user perspectives:
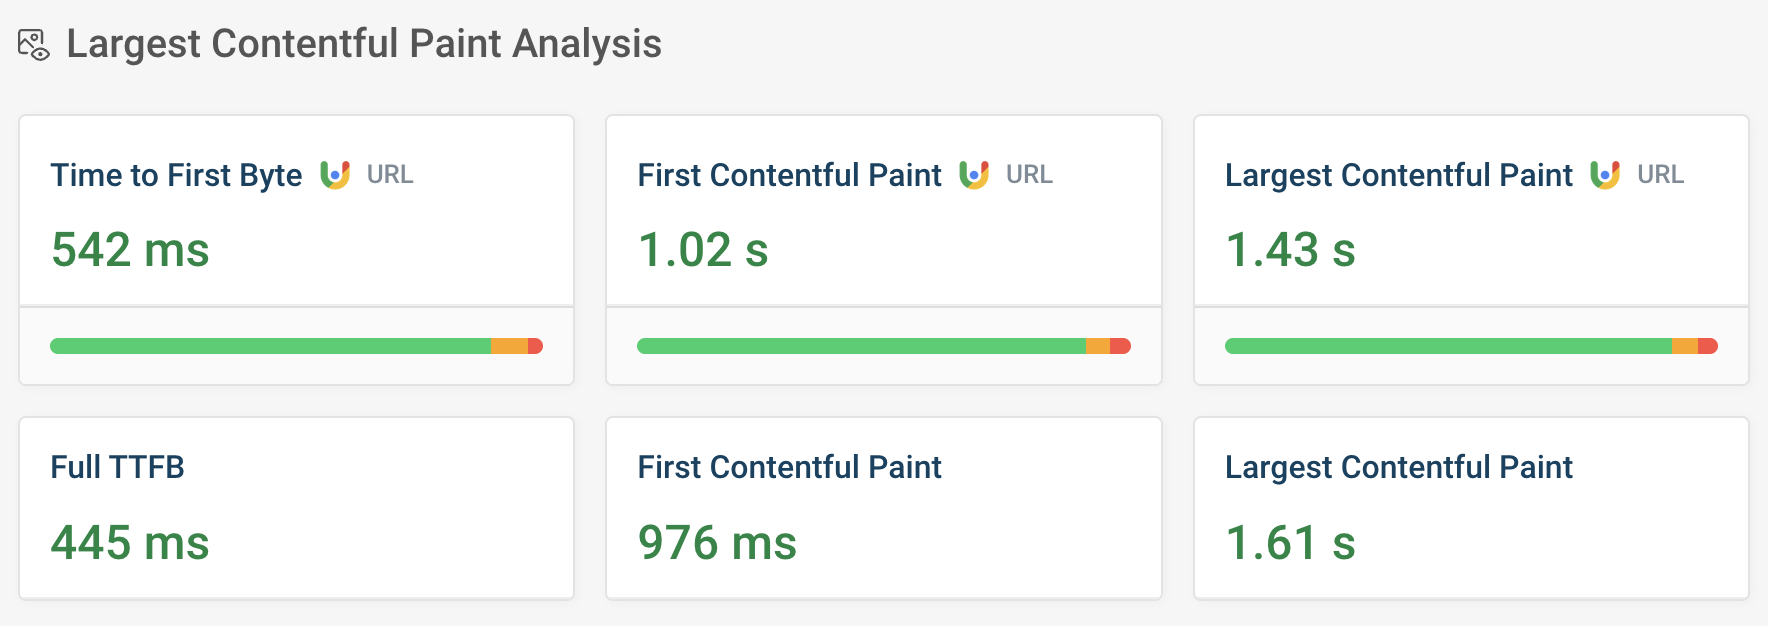
Time to First Byte (TTFB)
TTFB measures time between a browser making a request and receiving the first byte of the HTML response. TTFB directly reflects server rendering time, including middleware execution, data fetching (useAsyncData, API calls), and HTML generation. Ideally, TTFB should be under 200ms on average.
To improve the value of this metric, use caching, reduce blocking middleware, optimize data fetching logic.
First Contentful Paint (FCP)
FCP measures how long it takes for the first piece of DOM content to be rendered on screen. It indicates how quickly a user sees something useful. Ideally, FCP should be under 1.8 seconds on all devices.
To improve the value of this metric, optimize server payloads, defer non-critical scripts, and lazy-load components.
Largest Contentful Paint (LCP)
LCP measures how it takes for the largest visible element (e.g., hero image, heading) to render. LCP is a Core Web Vital that strongly impacts perceived performance. Ideally, LCP should be under 2.5 seconds.
To improve the value of this metric, use optimized images, server-render the above-the-fold content, and avoid layout shifts.
DebugBear can measure these milestones using Lighthouse tests and real user data from Google's Chrome User Experience report.
Optimizing Nuxt SSR Performance
There are several things you can do to improve the performance of your Nuxt SSR application. The following examples will focus on Server Side Rendering improvements specifically.
If you are interested in learning about general Nuxt Performance, check out our previous article on tips to improve Nuxt performance.
Optimize useAsyncData and useFetch for Efficient Data Fetching
Nuxt 3 encourages using composables like useAsyncData and useFetch over asyncData (from Nuxt 2). These tools let you fetch data both server-side and client-side, while giving you control over caching, SSR behavior, and lazy loading. Key Strategies:
- Avoid redundant API calls by naming your keys and reusing shared data.
- Use
lazy: trueto defer non-critical data loading. - Fetch data in parallel to reduce latency.
If the request is not critical, we can use lazy: true to defer it:
const { data } = await useFetch('/api/products, { lazy: true })
When requests don't rely on each other, we can make them in parallel with Promise.all() to boost performance:
const { data } = await useAsyncData(() => {
  return Promise.all([$fetch("/api/products/"), $fetch("/api/category/shoes")]);
});

const products = computed(() => data.value?.[0]);

const category = computed(() => data.value?.[1]);
The pick option helps to minimize the payload size stored in the HTML document by only selecting the fields that are needed:
<script setup lang="ts">
  const { data: product } = await useFetch('/api/product/shirt, {
    pick: ['title', ‘price’]
  })
</script>

<template>
  <h1>{{ product.title }}</h1>
  <p>{{ product.price }}</p>
</template>
Server-Side Caching with Nitro Storage
Caching is essential for reducing server response time and handling high traffic. Nitro provides a unified API for different storage backends such as memory, Redis, or local storage.
const cache = useStorage("cache");
export default defineEventHandler(async () => {
  const cached = await cache.getItem("products");
  if (cached) return cached;

  const data = await $fetch("https://api.example.com/products");
  await cache.setItem("products", data);
  return data;
});
With this setup, we can serve repeat requests directly from cache, reducing API hits and rendering time.
Utilizing Lazy Hydration
Lazy hydration is a built-in Nuxt feature that helps improve SSR performance by deferring the hydration of non-critical components.
Rather than hydrating all components immediately on page load, Nuxt allows us to delay hydration until the component is visible or the browser is idle.
<template>
  <div>
    <LazyMyComponent hydrate-on-visible />
  </div>
</template>
Delayed hydration can offer performance benefits, but it's essential to use it correctly which is described here.
Deploy Using Nitro Presets and Edge Functions
Nitro is designed to work seamlessly with platforms like Vercel, Netlify, and Cloudflare. By targeting CDN edge locations, you reduce latency and handle requests geographically closer to users.
Edge-Side Rendering (ESR) in Nuxt lets your app render on CDN edge servers, closer to users. This reduces latency and boosts performance for a better user experience. ESR shifts rendering to the network's edge, acting more as a deployment target than a rendering mode. When a page is requested, the nearest edge server handles the HTML generation, avoiding long trips to the origin server and speeding up page load times.
The current platforms where you can leverage ESR are:
- Cloudflare Pages
- Vercel Edge Functions
- Netlify Edge Functions
It can shave off significant milliseconds from TTFB and improve performance scores globally.
Bonus: Using DebugBear to audit performance of Nuxt SSR applications�
Let's take a look at the performance of a real-world website using Nuxt SSR!
We'll first use Vue Telescope to find a website and then test it using DebugBear.
Checking server-side rendering with Vue Telescope
The first thing we need to to is to actually find a Nuxt website that is actually utilizing the Server Side (Universal) Rendering. The easiest approach would be to install the Vue Telescope extension that allows us to easily see what rendering mode Vue/Nuxt application uses:
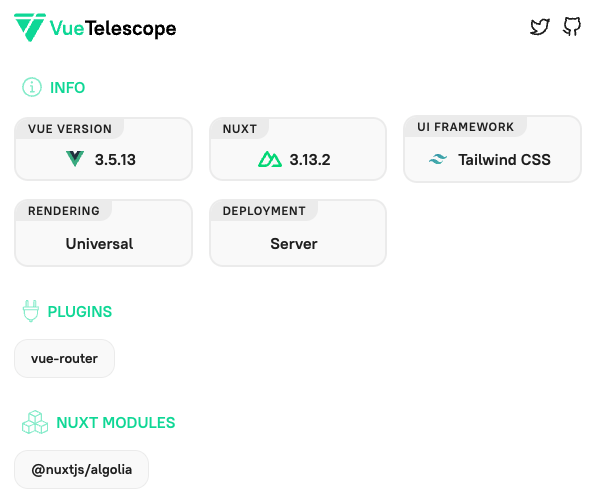
Scanning https://www.armani.com/en-pl/ with Vue Telescope tells us that that the rendering is Universal, which means it's rendered server-side and then hydrated on the front-end.
The deployment type of "server" tells us that the website is running Nitro on a Node.js instance to serve the page.
That makes this page a perfect candidate for an SSR Nuxt application to audit.
Auditing the Nuxt page
Next, let’s audit this website in the free DebugBear page speed test.
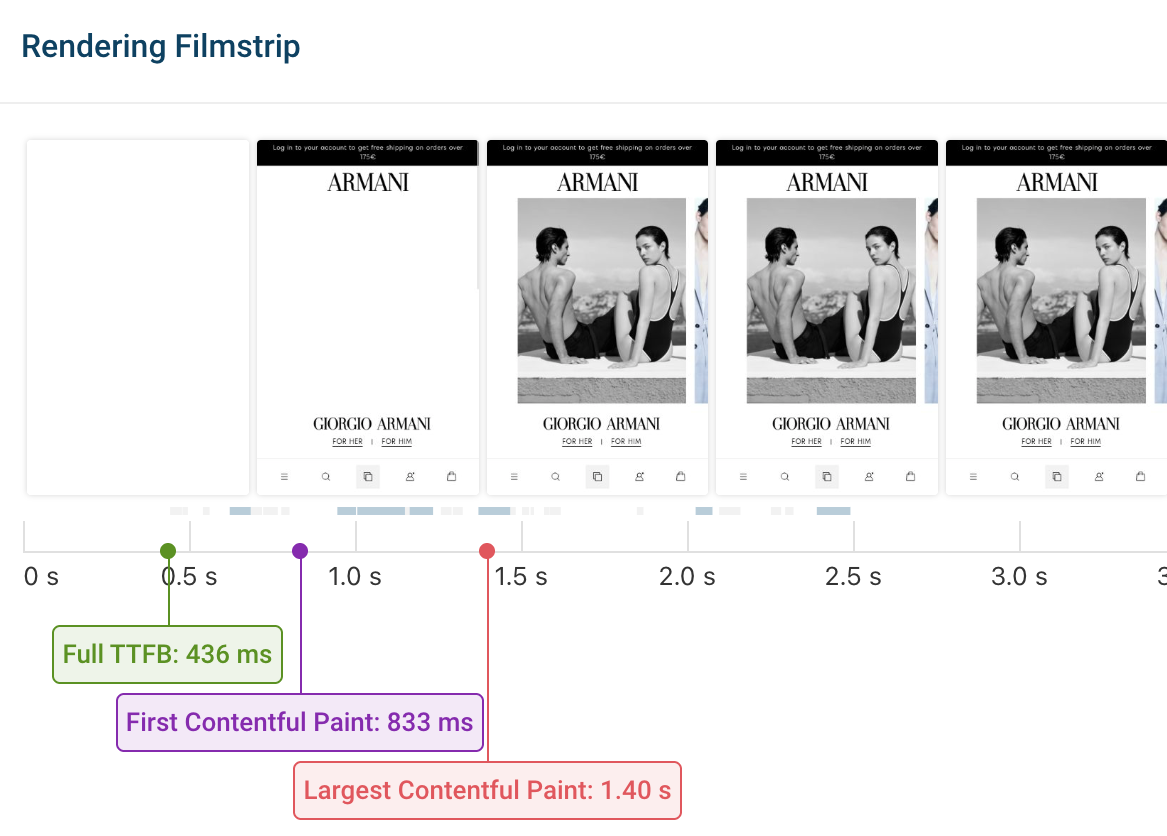
I have already run a test that you can check out here. Taking a look at the Rendering Filmstrip section, we can see that this website has actually decent values for important metrics like Time to First Byte (TTFB), First Contentful Paint (FCP), and Largest Contentful Paint (LCP).
Inspecting the Core Web Vitals section confirms our speculations that SSR metrics are indeed correct but there is a room for improvement for interaction and user related metrics such as Cumulative Layout Shift (CLS) or Interaction to Next Paint (INP) as well as the Total Blocking Time (TBT).
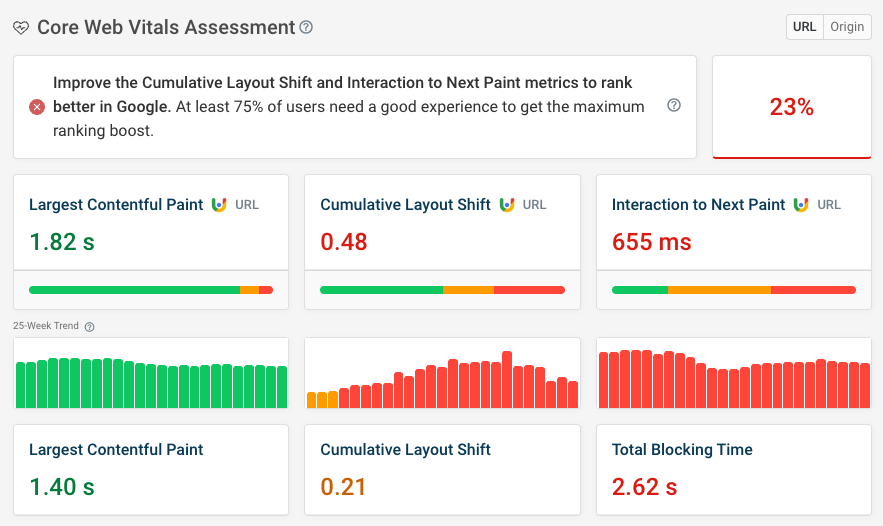
By using DebugBear, one can easily monitor their Nuxt SSR application and see real values for important metrics both for lab and field data, compare them, and implement meaningful changes to improve overall performance of their website.
Summary
Optimizing SSR performance in Nuxt requires a blend of strategic caching, intelligent data fetching, and deployment best practices. Thanks to Nitro, edge rendering, and advanced composables, Nuxt empowers developers to build fast, scalable, and SEO-friendly apps out of the box.
Whether you're launching a high-traffic SaaS or a content-heavy blog, these techniques will help you reduce server load, improve user experience, and scale with confidence.
Additional resources
If you would like to learn more about these concepts, please check out the following articles:
- Nuxt Performance series
- Understanding and Measuring Nuxt Performance
- How To Speed Up Your Vue App With Server Side Rendering
- How To Optimize Performance In Nuxt Apps
- Efficient Data Fetching in Nuxt with useAsyncData
Keep your Nuxt website fast
A web performance monitoring tool like DebugBear can help you identify slow pages on your website, find out how to optimize them, and make sure you get alerted to future performance changes.
Run synthetic tests for detailed analysis and use real-user monitoring to see how actual visitors experience your website and where you need to improve.
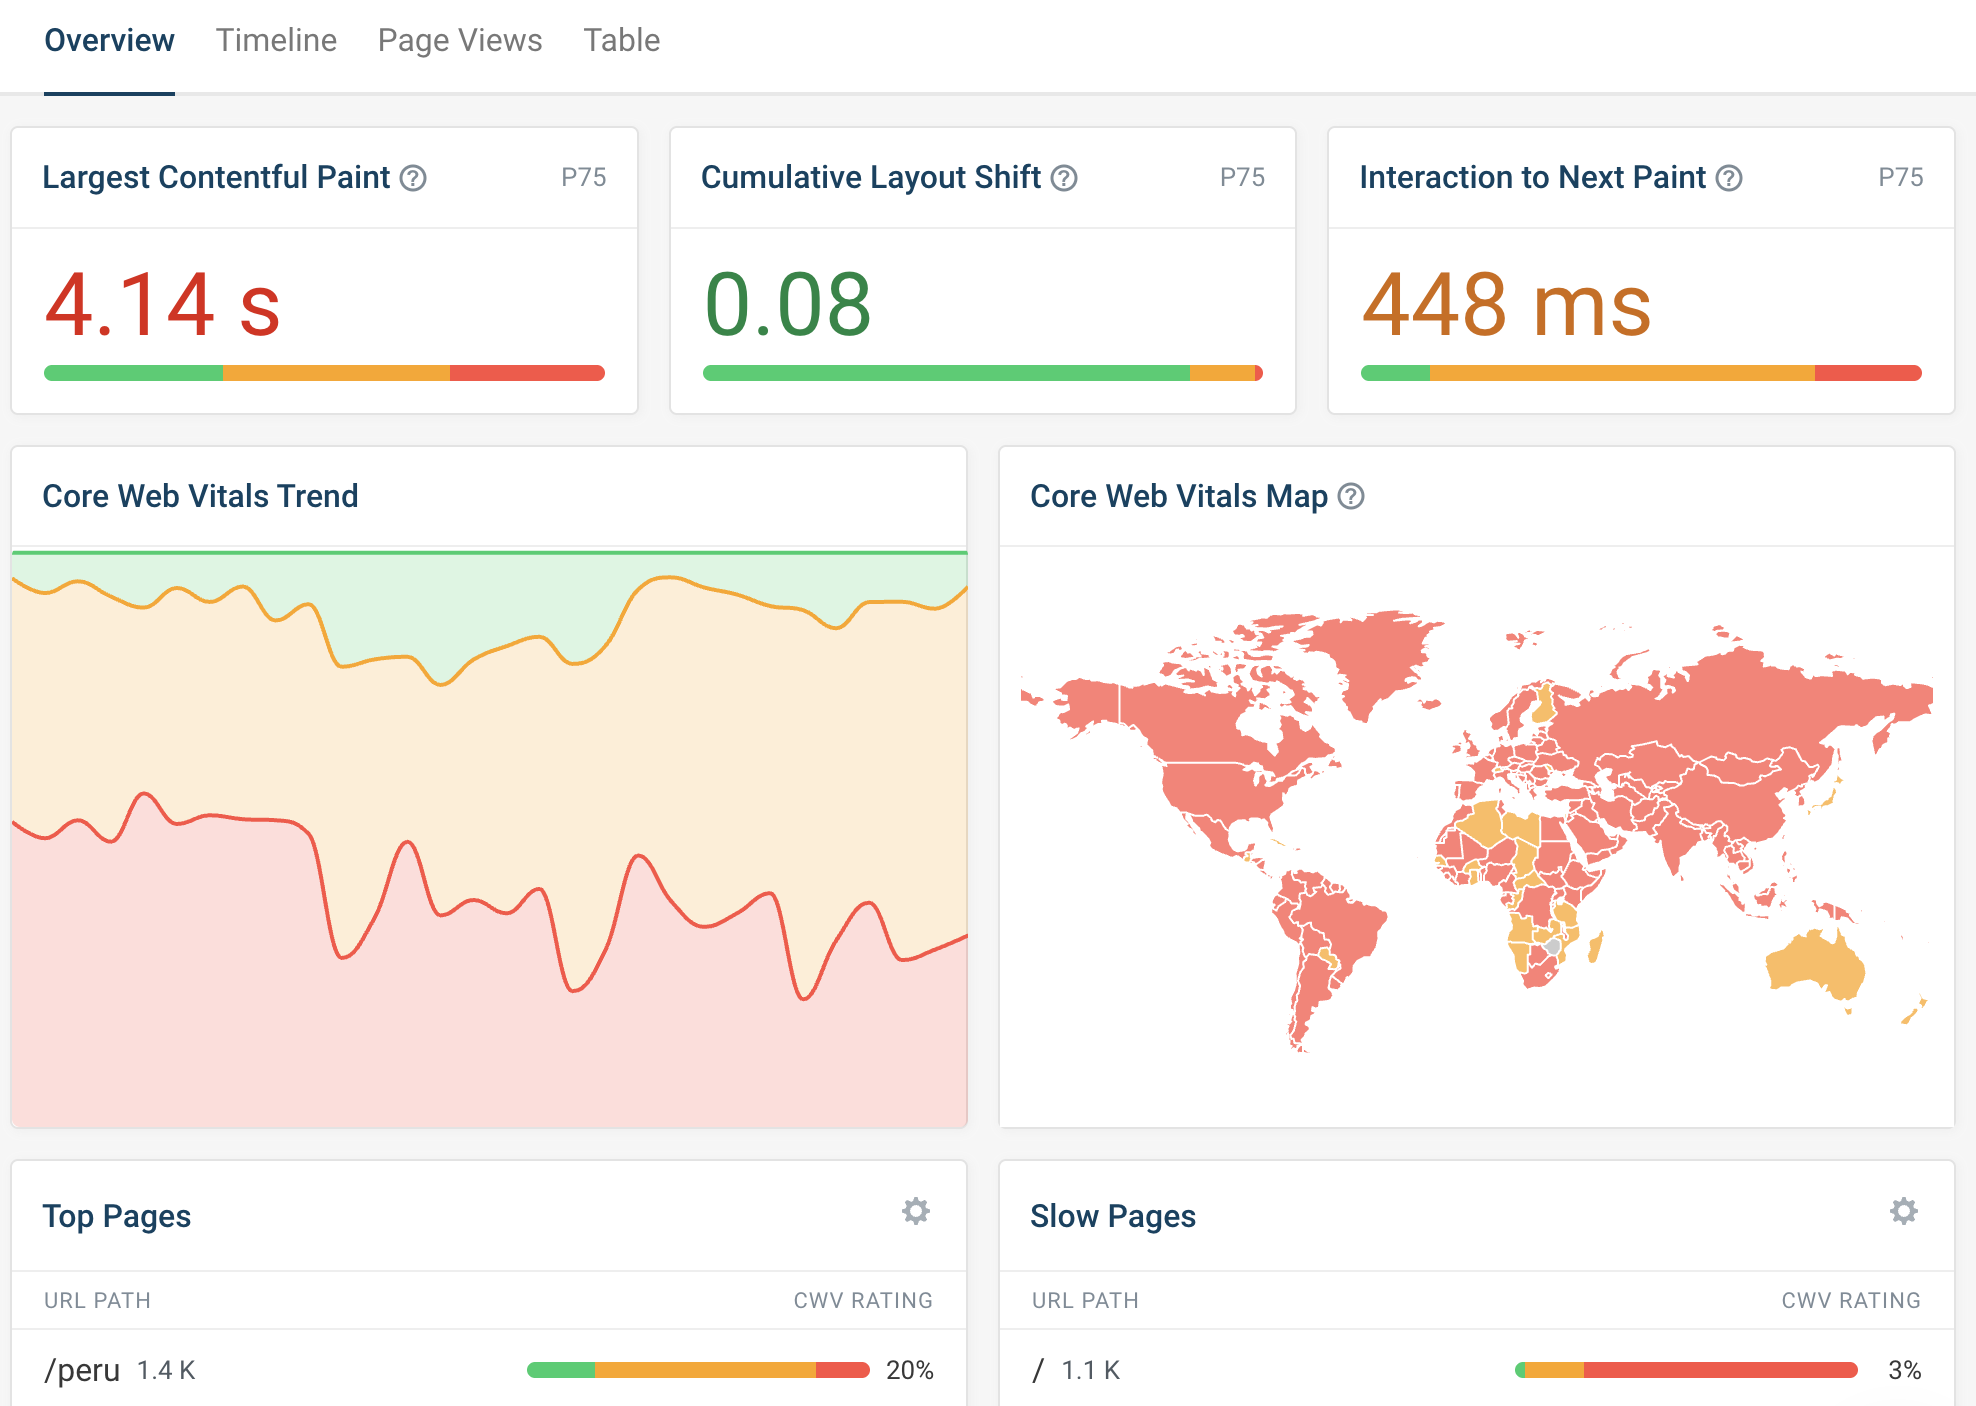
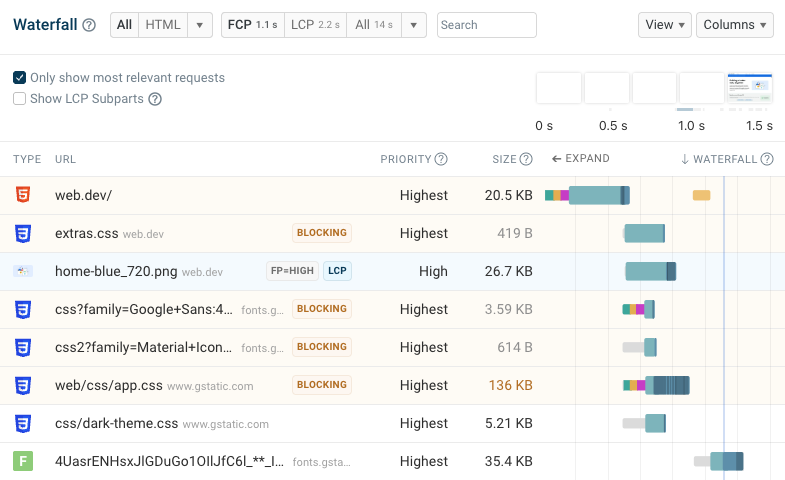
In addition to the high-level analysis of your website you also get detailed technical debug data to make speed up your website or application:
- Request waterfalls
- Tailored recommendations to improve your website performance
- An LCP subparts breakdown


Monitor Page Speed & Core Web Vitals
DebugBear monitoring includes:
- In-depth Page Speed Reports
- Automated Recommendations
- Real User Analytics Data
