
How quickly do websites respond to user input? In this article we take a look at this question based on real-user data published by Google as part of the Chrome User Experience Report.
What is Interaction to Next Paint (INP)?
Interaction to Next Paint measures how quickly a website responds to user input. If a lot of CPU processing happens during the page interaction, then there will be a longer delay before the page content can update.
What is a typical website INP score?
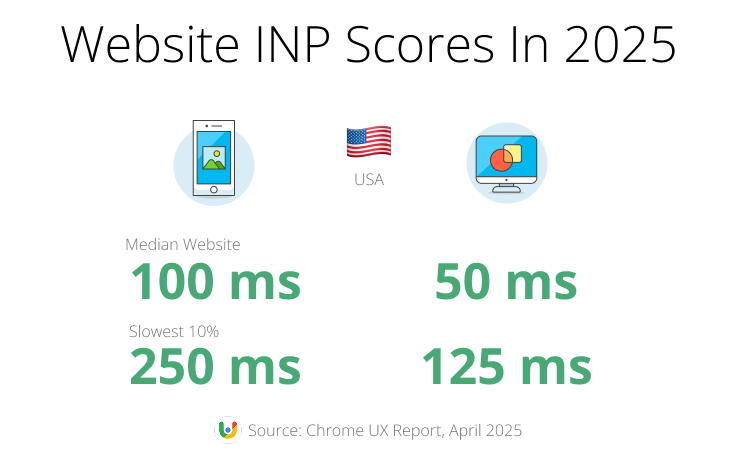
In the US, website responsiveness is usually pretty good. When looking at the 75th percentile for a typical website, fully handling an interaction takes 100 milliseconds on a phone and 50 milliseconds on a desktop device.
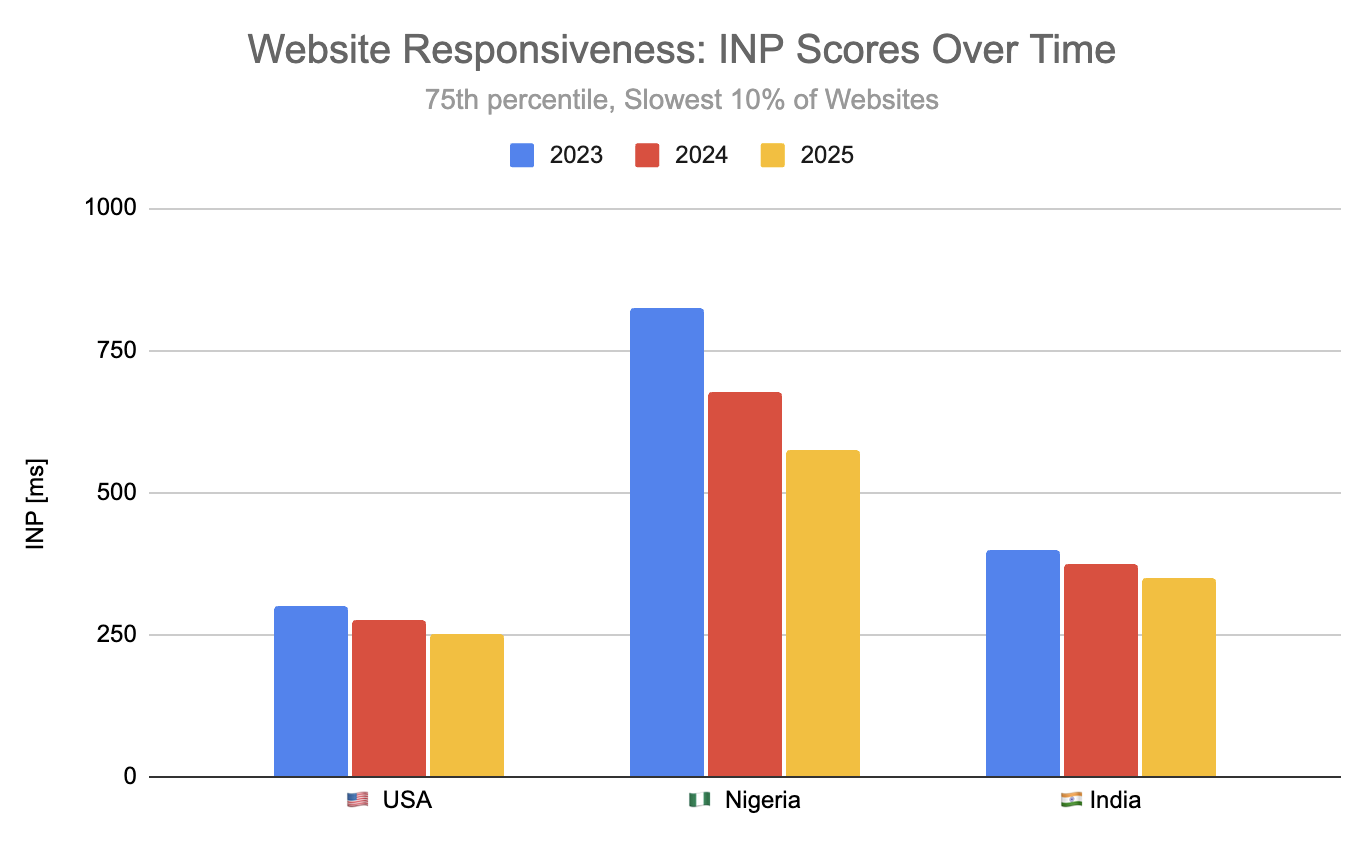
Even when looking at the slowest 10% of websites, INP scores don't exceed the rating threshold of 250 milliseconds.
Of course, that doesn't mean every interaction is fast. Here we're just looking at domain-wide data, and individual pages on these websites can well have mostly slow interactions.
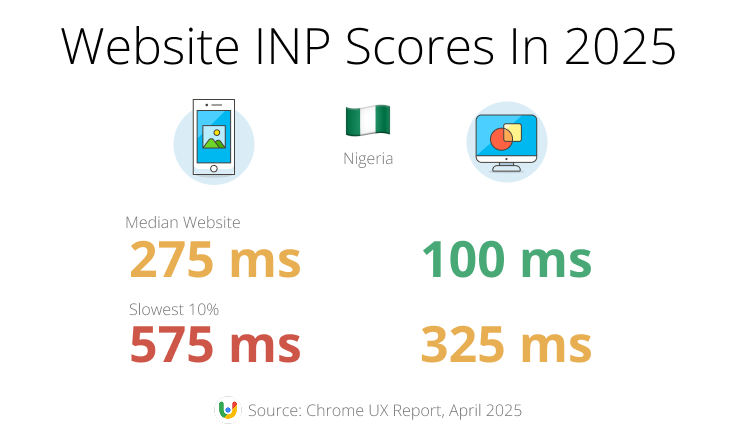
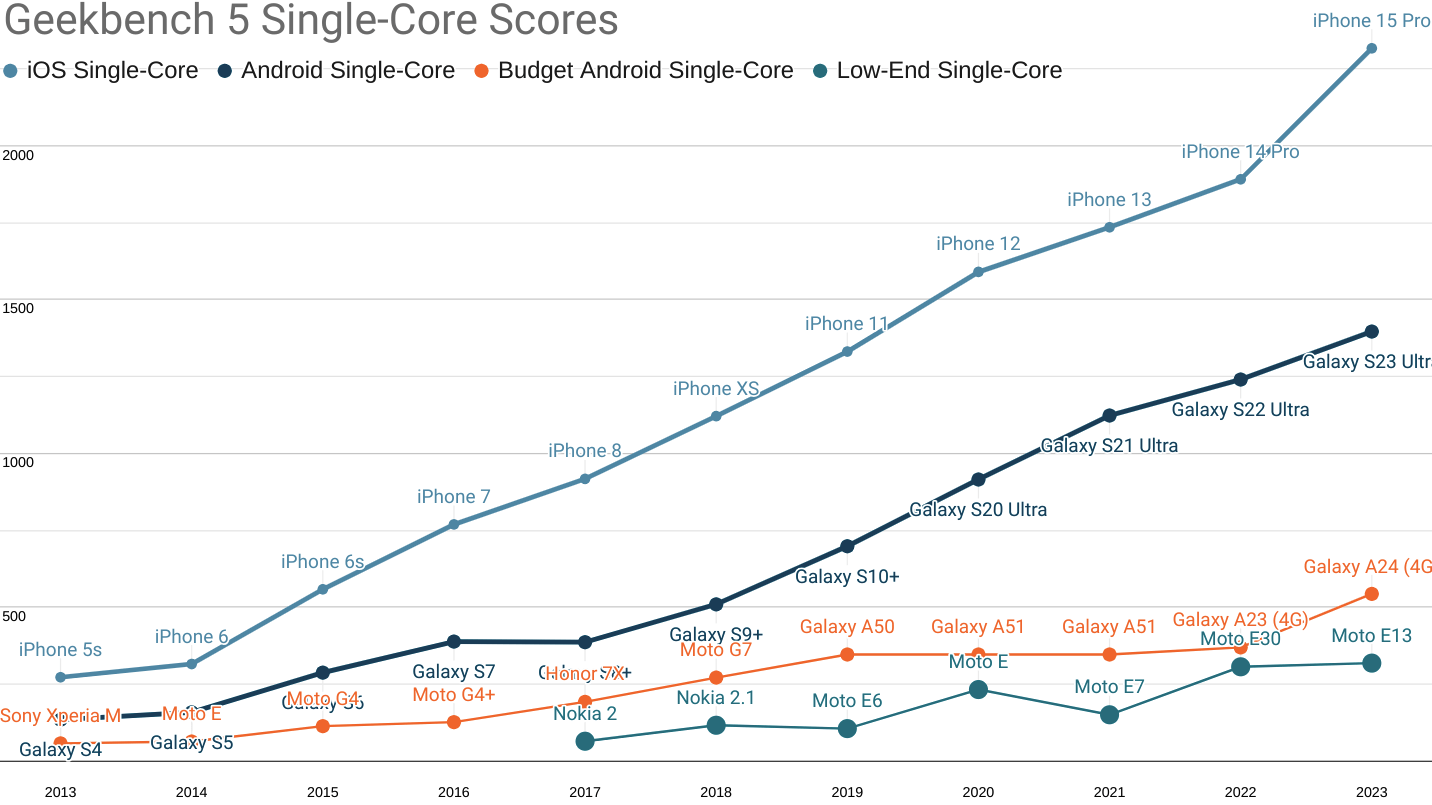
How fast a device can handle user interactions also depends on the processing power of the user device. Low-end mobile devices in particular take more time to respond to user interactions. As a result, INP scores vary significantly across the globe.
For example, in Nigeria a typical mobile site takes 275 milliseconds to respond to a user interaction. The slowest 10% of sites take over half a second across all pages.
Even on desktop, the slowest 10% of sites have a domain-wide INP score of 325 milliseconds.
How do INP scores compare globally?
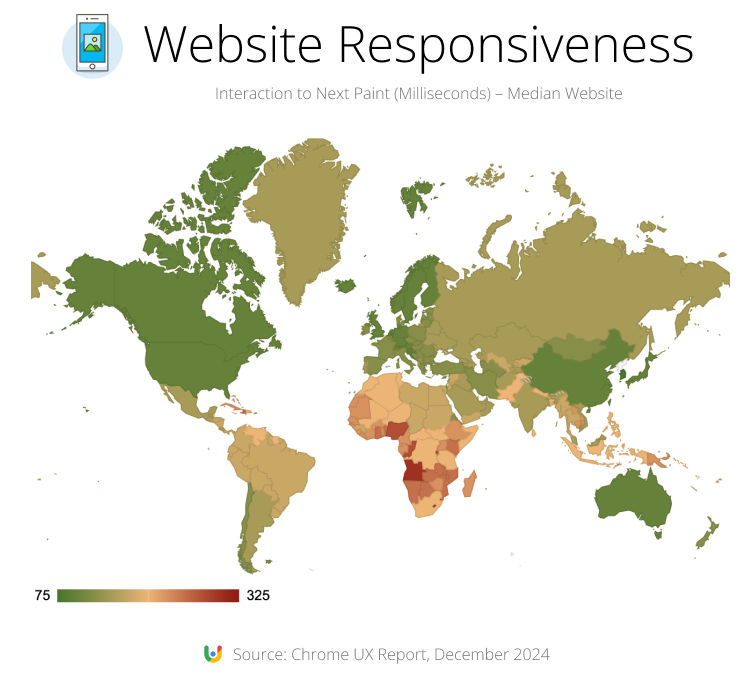
When looking at Interaction to Next Paint across the world, we find that poorer countries have higher INP scores. This stands out especially in Africa.
This map shows 75th percentile INP scores for average websites. Slow interactions are rarer in wealthier countries where website visitors use higher-end devices to access the web.
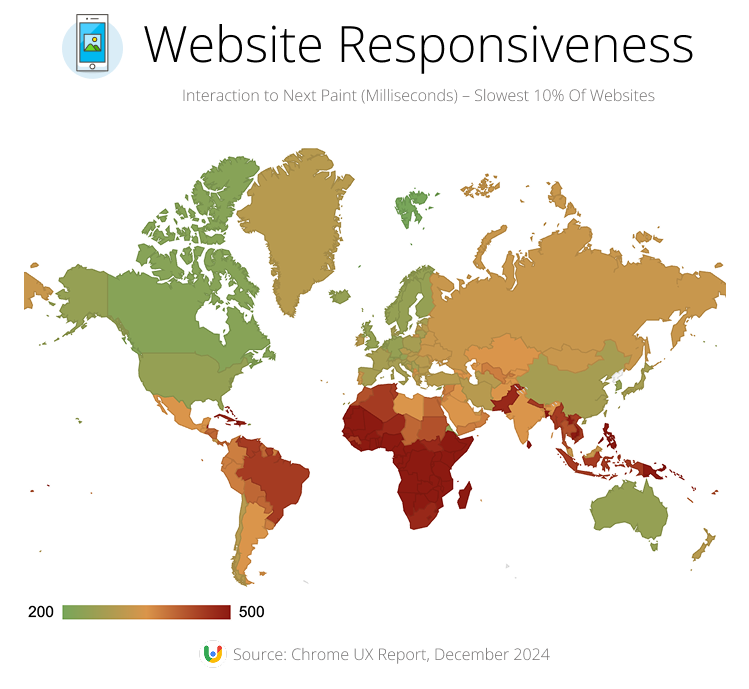
If we look at slower websites we can see the same pattern. However, poor INP scores become more common even in richer countries.
What country has the best INP scores?
Website visitors in South Korea have the lowest interaction delays, with just 75 milliseconds on a typical website. This matches our findings for the Largest Contentful Paint metric, where South Korea was also one of the leading countries.
Many other countries get a score of 100 milliseconds, including the US, Germany, and Japan. Our report is based on BigQuery CrUX data, which only provides a metric granularity of 25 milliseconds. So for a typical website it's not possible to see small score differences.
For the slowest 10% of websites, Canada comes out on top, with an INP score of 225 milliseconds.
What country has the worst INP scores?
Website visitors in Lesotho and Angola both wait over 300 milliseconds for a website interaction on an average website.
This also matches when looking at slower websites, with an INP score of 800 milliseconds in Lesotho and 750 milliseconds in Angola.
Outside of Africa we also find poor INP scores for the slowest 10% of sites in Asia. INP is 525 milliseconds in Papua New Guinea, 600 milliseconds in the Philippines, and 450 milliseconds in Vietnam.
Why do INP scores vary globally?
Most likely, the biggest cause of global score discrepancies is differences between the devices visitors use in different countries. Powerful high-end devices are expensive, so people in poorer countries use low-end devices to browse the web.
Alex Russel has looked into these differences as part of his report on the performance inequality gap. High-end phones are getting faster and faster, today often being as powerful as desktop devices. Visitors on cheaper low-end devices experience much worse performance.
Are website INP scores getting worse or better?
When looking at INP scores over the last three years we find a positive trend. The chart below shows INP improvements in the US, in Nigeria, and in India.
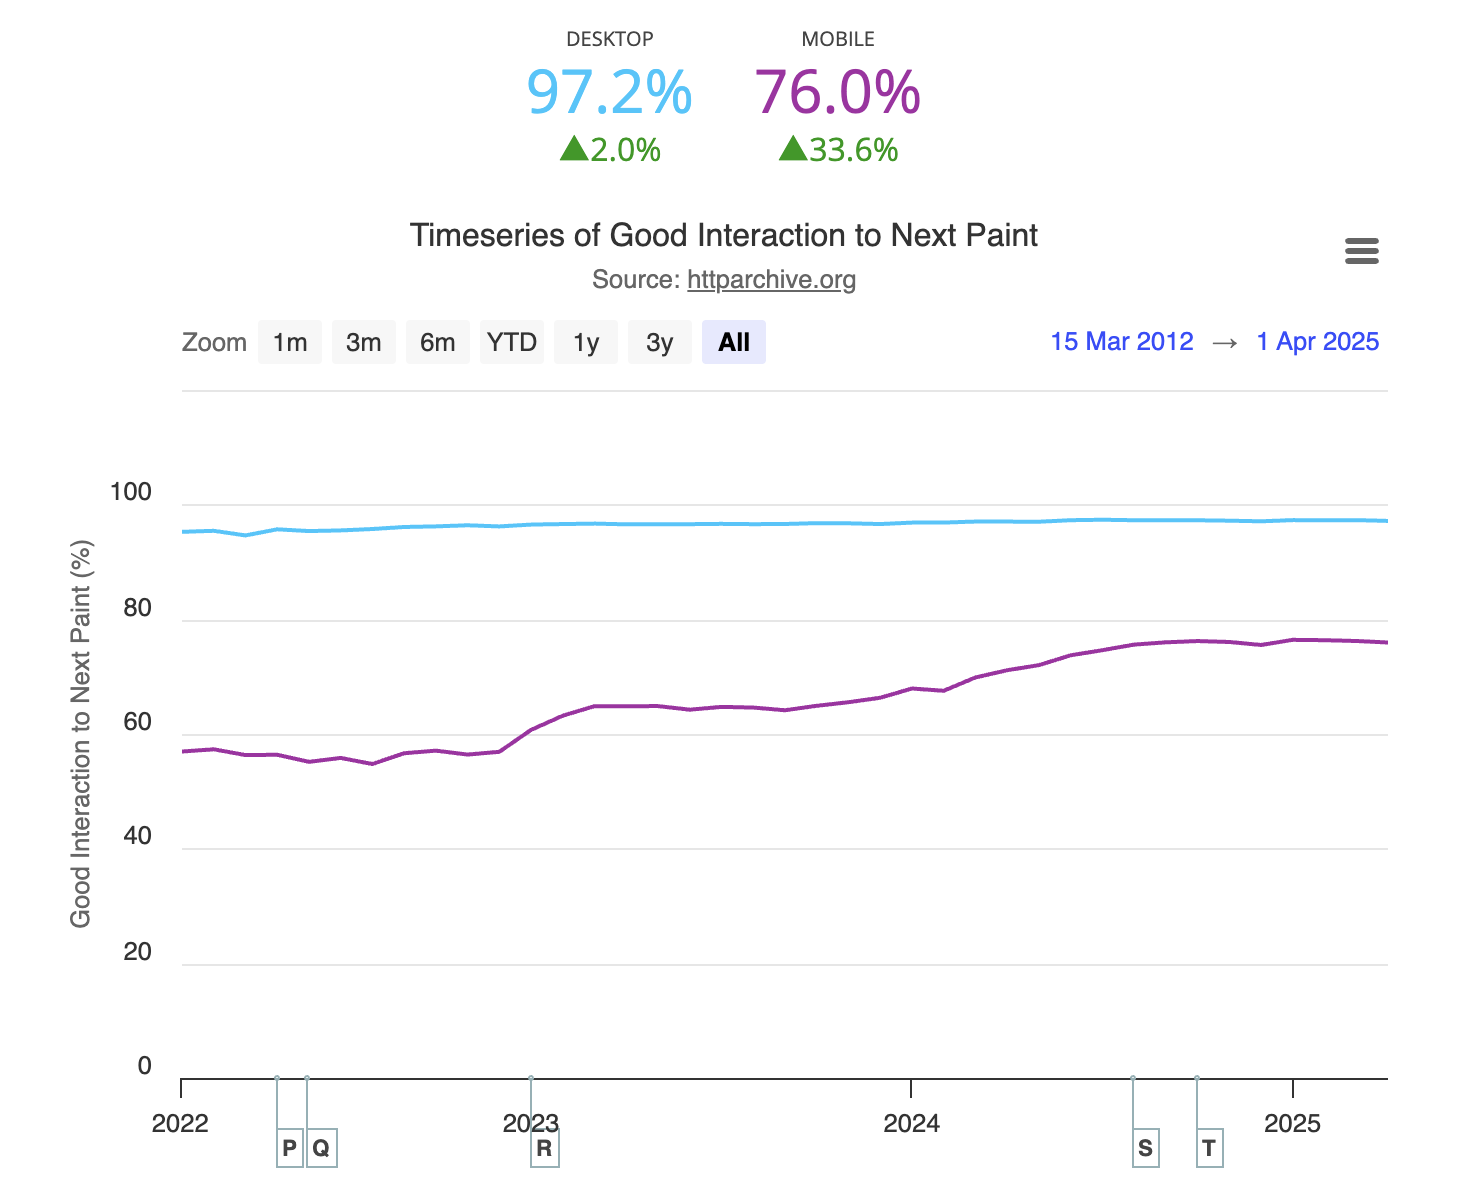
This trend matches the data reported by Google as part of the HTTP Archive CrUX report. Rather than reporting percentiles, the report looks at whether over 75% of visitors are having a good responsive website experience.
This has improved drastically since March 2022, with 57% good websites then and 76% today.
Why are INP scores improving?
There are three reasons why Interaction to Next Paint is getting better:
- Visitors are getting faster devices
- Developers are optimizing their websites
- Chrome is rolling out browser performance improvements
Fixing poor INP scores on your website
How quickly your website responds to user interactions depends on the devices they're using and how well-optimized your website is.
To fix INP issues on your website you need to know what's slowing it down. DebugBear's real user monitoring product can tell you:
- What pages on your website have slow interactions
- What UI elements cause poor INP
- What scripts are contributing to interaction delays


Monitor Page Speed & Core Web Vitals
DebugBear monitoring includes:
- In-depth Page Speed Reports
- Automated Recommendations
- Real User Analytics Data