
It’s been 25 years since I started my journey into the world of performance engineering. I've witnessed the evolution of our industry from mainframe optimization to modern web performance.
Something interesting that I have seen occur over the last decade is the rise of two distinct “camps” in the performance engineering space. Each has their own tools, metrics, and philosophies. In this blog, I’d like to talk about how we bridge the skill sets and processes of each.
The Great Performance Divide
In the early days of my career, performance was fairly simple. Large companies were moving out of the mainframe world (and rather slowly) into two-tier client/server systems. The mission was simple: optimize the server.
Most of the time the database server was the main focus (and culprit). Response times were measured in seconds, and user experience was largely determined by how quickly the backend could process requests.
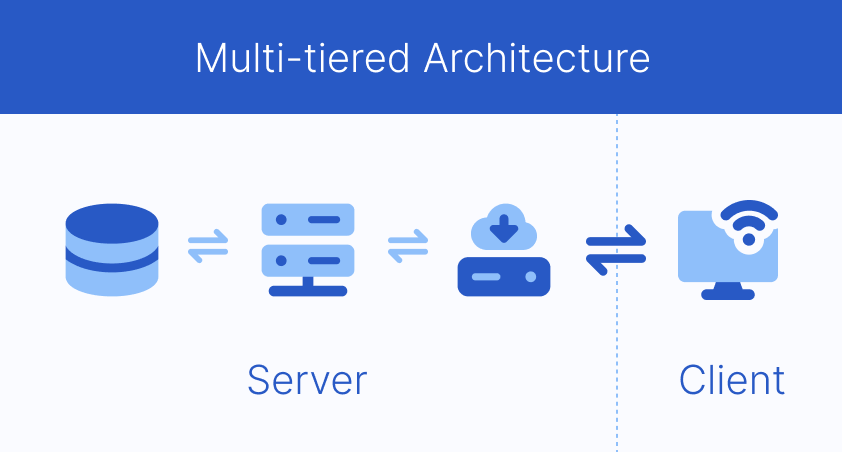
Moving to web-based applications brought with it new challenges as companies began with additional tiers between the client (this new thing called “the browser”) all the way to the back end and including the return trip. Sometimes it was three tiers (web server → application server → database) - and many times the application and web servers were combined on a single server, but separated architecturally.
Then companies found reasons to find new tiers to stick in between the web server and the other back end components, depending on what was needed. We referred to these as “N-tiered” or “multi-tiered” architecture, because we never knew how many tiers there would be.
Still, the performance engineers of the Enterprise software world had a steady fix on these systems, not the browser itself. This was considered the “last mile” and many considered that of no concern.
“How can we know if they are browsing on a 10 year old computer, or something else?” “Who knows which browser they will be using”. I mean, who cares, right? This is where we were sorta wrong (I considered myself as part of that group initially, but I caught on fast).
Since the late 2000’s, I have seen the rise of “front end” software engineers who focus on the performance of the browser specifically.
More and more we are seeing a focus on the intricate details of browser rendering, many times without any reference to what the back end is at all. I am connected to a lot of people in this industry, and I can plainly see that we have a fascinating dichotomy between the two.
Camp One: The Backend Performance Engineers
These are the seasoned veterans (a nice way of saying “old geezers”) who cut their teeth on enterprise software applications. These are the ERP systems, CRM platforms, and mission-critical business applications that make stuff run at Global 2000 companies.
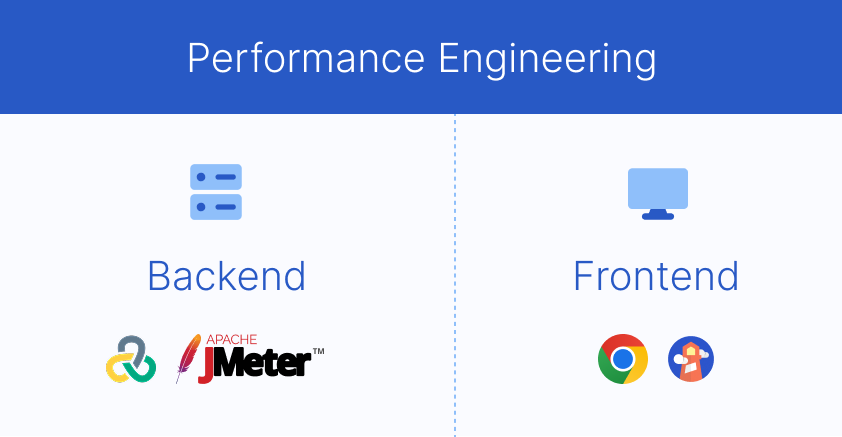
They use products like LoadRunner, NeoLoad, and JMeter. Their world is made up of throughput, end user transaction response times, number concurrent users on a system, and resource utilization of the infrastructure. They understand database optimization, connection pooling, caching strategies, and server scaling.
I have personally spent countless hours with these tools, working with developers and database administrators to analyze thread dumps, tune garbage collection, and optimize SQL queries.
When you go through the exercise of a properly implemented load test and see results where the system goes from breaking at 100 concurrent users to serving 10,000 concurrent users with no issues through careful tuning, it is extremely rewarding. It’s why I still do it today.
Camp Two: The Frontend Performance Engineers
Then came Steve Souders' "High Performance Web Sites" in 2007, which changed how many of us think about web performance.
He presented that a large percentage (around 80-90%) of the time users wait for a web page to load is on the frontend, shifting the focus of optimization from backend to frontend.
This book kicked off an entirely new generation of engineers focused on the browser side of performance. These engineers have a deep understanding of Google Lighthouse scores, obsess over Core Web Vitals, talk excitedly about waterfall graphs, and dream about Real User Monitoring (RUM) dashboards.
They understand the whole browser rendering path, resource loading, JavaScript bundling, and the intricacies of browser behavior. Their tools of choice include Chrome DevTools, DebugBear, WebPageTest, GTMetrix, and other similar synthetic web monitoring solutions.
The Problem with Silos
Here's what I've learned from my experience in this field: both camps are absolutely right, and both are incomplete without the other.
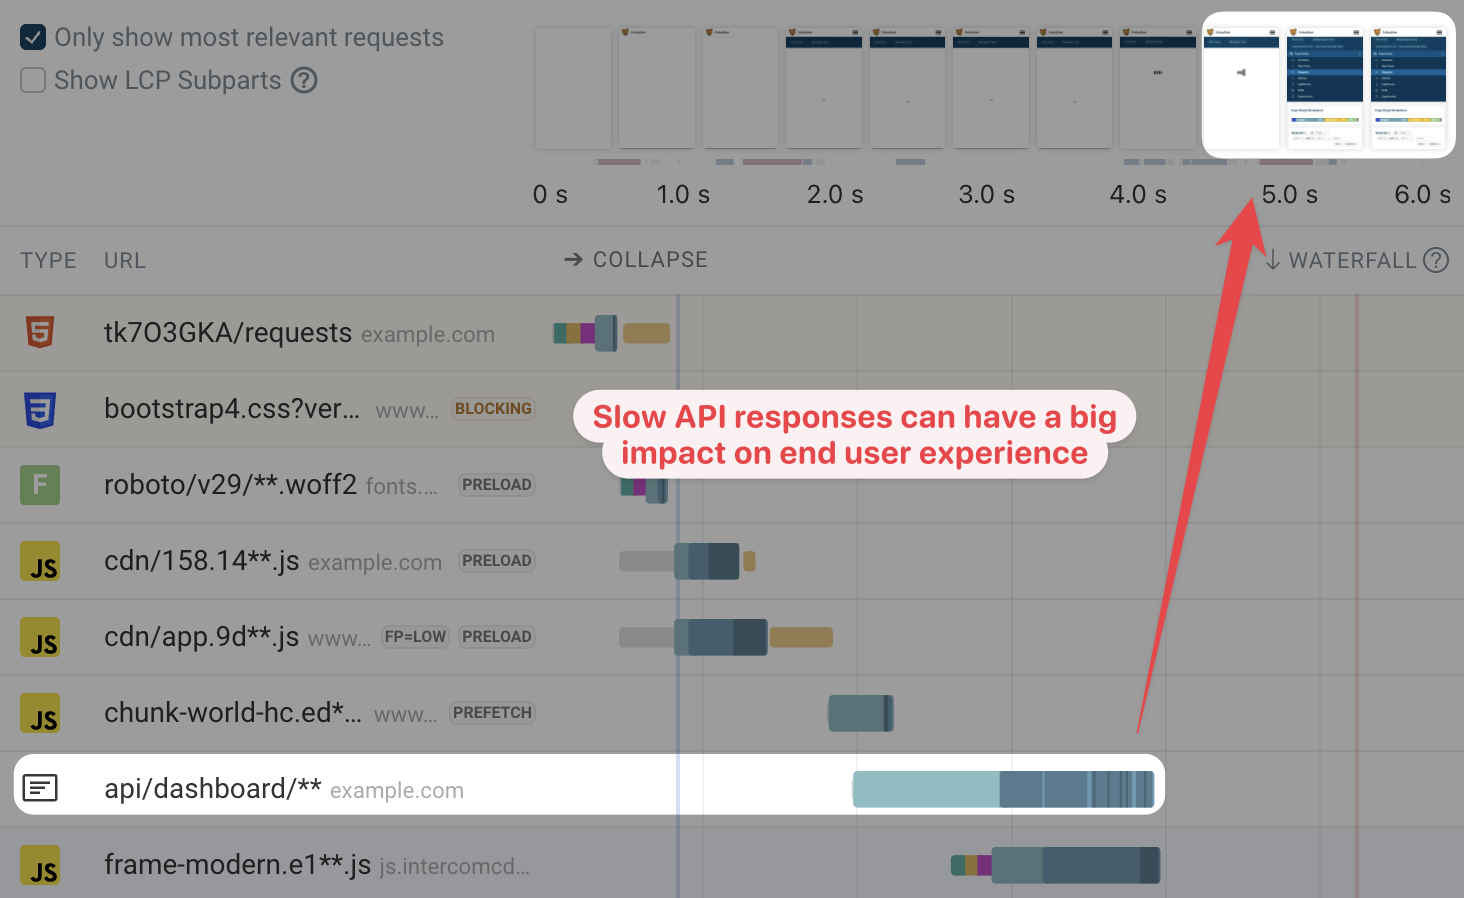
I've seen too many projects where backend engineers delivered lightning-fast API responses (sub-100ms) only to have users complain about slow page loads. I've witnessed perfect Lighthouse scores in development, only to see carefully optimized sites crushed under real-world traffic when the backend resources were suddenly constrained.
A website can only be as fast as the slowest component allows, and that component can be anywhere in the stack.
Understanding Google Core Web Vitals
Google's Core Web Vitals have become the standard for measuring web end user experience. They include:
- Largest Contentful Paint (LCP): Measures loading performance
- Interaction to Next Paint (INP): Measures interactivity
- Cumulative Layout Shift (CLS): Measures visual stability
These metrics focus on what the users actually experience. That’s great, but here's where many organizations go wrong: they treat these metrics as purely frontend problems.
Let me share a real example from a recent project. A major e-commerce site was struggling with poor LCP scores — consistently above 4 seconds. The frontend team spent weeks optimizing images, implementing lazy loading, and fine-tuning their build process. LCP improved marginally to 3.8 seconds, still well above Google's "good" threshold of 2.5 seconds.
Then we looked at the backend performance. The API was taking 2.1 seconds to respond during peak traffic due to poorly written database queries and a bad configuration setting for connection pooling. No amount of frontend optimization could overcome this fundamental bottleneck. These API performance issues would just get worse under load, which is generally when it first gets released.
“But I thought we tested this thing before we went live!”.
“We did.”
Well, not entirely. More companies have gotten caught by this than I can count.
The Backend Foundation
Every performance optimization starts with a solid backend. It’s a “must have”. But there also needs to be additional checks on the front end. Here's what backend engineers need to understand about their impact on Core Web Vitals:
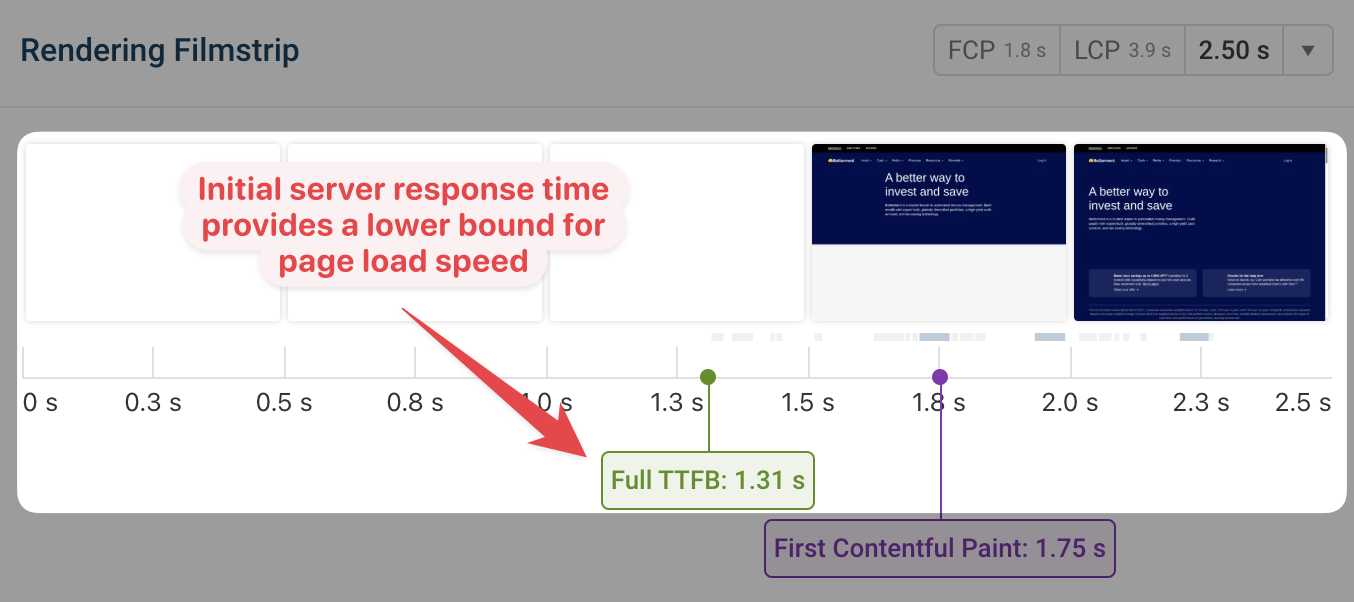
LCP is Directly Tied to Backend Response Times
If your API takes 2 seconds to return a response, the LCP can’t get better than 2 seconds. It does not matter how optimized the browser is. Critical resources like hero images, the main content, and above-the-fold elements all depend on backend data.
INP may not indicate the site is slow when it is
INP measures responsiveness. This is the time from user interaction to the next visual update (paint). That would include interactions that don't require immediate visual updates (like analytics tracking), as well as those that do require rendering new data from the backend.
An interaction that triggers a slow API request but doesn't immediately render new content may actually score well on INP, even though from the user's perspective the page seems slower.
While INP might not score worse with slow API responses directly, metrics like user satisfaction and conversion rates certainly will, so you have to consider both. Slow backends matter.
Resource Constraints Cascade Forward
During traffic spikes, backend bottlenecks can create a series of delays that impact every aspect of the user experience. Memory pressure, CPU throttling, and database connection timeouts will result in poor Core Web Vitals scores.
The Frontend Reality Check
Frontend engineers should understand that if the backend can't deliver, it directly affects the browser no matter how well it has been tuned. This is where Observability and Application Performance Monitoring (APM) become an important part of the process.
Synthetic Testing vs. Real-World Performance
Lighthouse scores in a controlled environment with infinite backend resources do not reflect real user experience during peak traffic. Core Web Vitals should be correlated with infrastructure performance metrics.
The Hidden Performance Tax
Many frontend changes you make to improve performance will cost you somewhere else.
For example, code splitting might reduce the initial bundle size, but increases the number of resource requests for additional JavaScript chunks. Instead of rendering a new page right away the browser will first have to fetch the page-specific code.
Client-side rendering could improve perceived performance, but that means more API calls for data that could have been rendered on the server. This increases server load.
There are always trade-offs somewhere. That is why there needs to be collaboration between frontend and backend teams.
A Unified Approach
Let’s use a common issue with SaaS companies that experience inconsistent Core Web Vitals and it’s not obvious why.
Real User Monitoring might reveal LCP scores are either great (under 1.5 seconds) or terrible (over 5 seconds), with nothing in between. What might cause this?
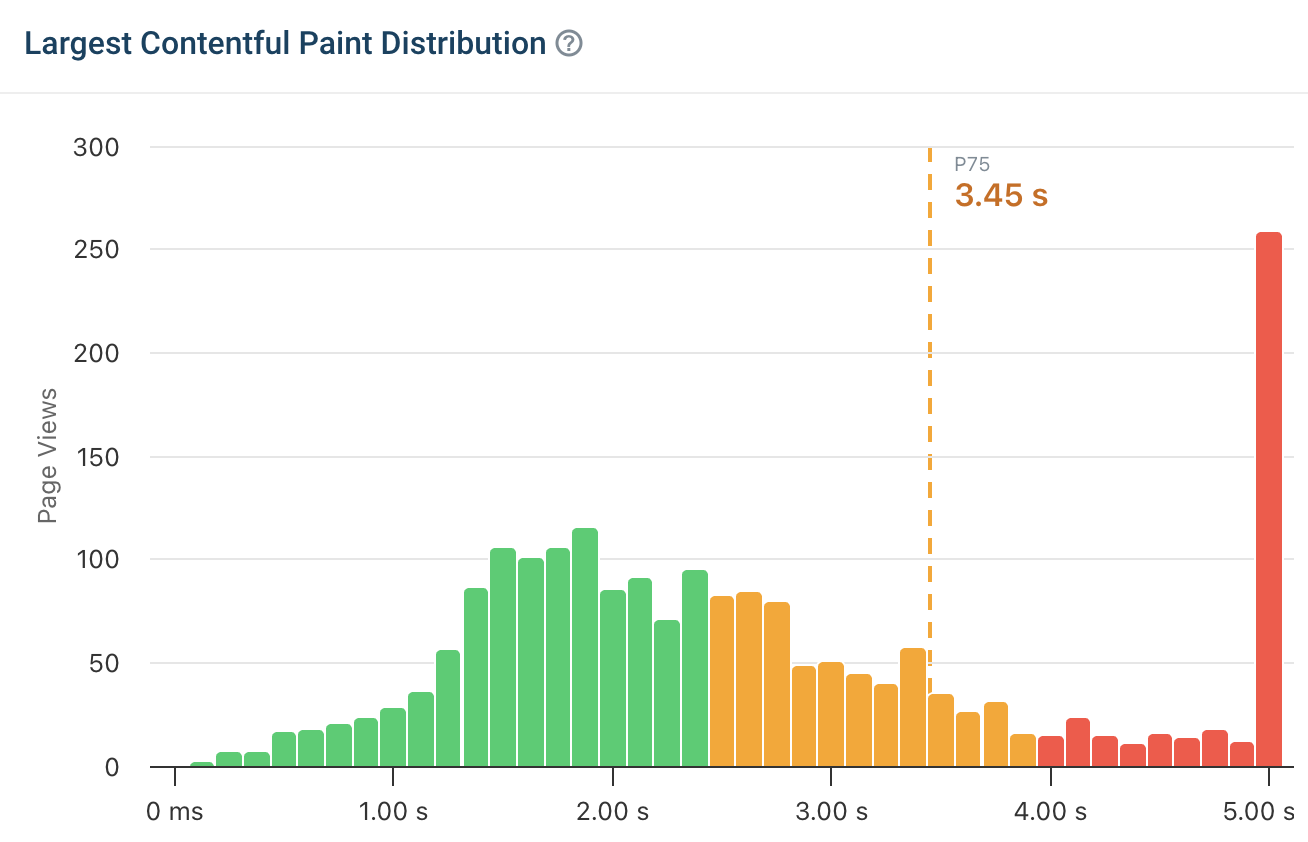
Using DebugBear's waterfall charts, you could easily determine the problem. Under normal traffic conditions, the API responses might be under 200ms. During traffic spikes, if the database connection pool becomes exhausted, API responses could spike into the 3 to 4 second range. This means LCP will take a nose dive.
DebugBear could show you the Core Web Vitals metrics and provide the context needed to understand why they are happening. The platform's field data collection (RUM) will measure real user experiences across different traffic patterns, something synthetic testing alone couldn't reveal.
By correlating DebugBear's frontend metrics with APM monitoring on the database, we could quickly identify the precise traffic thresholds where performance degraded. Increase the database connection pool size, implement a better cache plan, and add a few "circuit breakers" to prevent cascading failures. Boom! Done.
This makes the user experience consistent as well. Winning!
Building Bridges: Practical Steps
Maybe I am wrong, but I personally don’t feel we have enough cross over between the two camps. In case I am right, I wanted to offer ideas that can close the gap:
Backend Engineers
- Monitor Core Web Vitals: Add LCP, INP, and CLS to your performance dashboards alongside traditional metrics
- Understand the Frontend Impact: Every 100ms of API response time improvement can significantly impact LCP
- Implement Progressive Loading: Design APIs that support progressive enhancement and streaming responses
- Think Beyond Response Times: Consider payload size, compression, and caching headers as part of your optimization strategy. Don’t forget a performance budget for every web page!
Frontend Engineers
- Embrace APM Tools: Understand your backend dependencies and monitor their health
- Design for Resilience: Implement proper loading states, error handling, and progressive enhancement
- Collaborate on Caching: Work with backend teams to optimize caching strategies across the entire stack
- Test Under Load: Use tools like DebugBear to monitor Core Web Vitals under realistic traffic conditions with RUM, in addition to synthetic transactions
Organizations
- Unified Metrics: Create dashboards that show both backend performance and Core Web Vitals
- Cross-functional Teams: Ensure performance teams include both frontend and backend expertise
- End-to-End Testing: Implement performance testing that measures user experience, not just system capacity
- Shared Responsibility: Make Core Web Vitals a shared KPI between frontend and backend teams
The Path Forward
The future belongs to teams that think holistically about performance. Whether perceived or reality - this “divide” I have been talking about between frontend and backend performance engineering just should not exist. Working together, both teams should be focused on optimizing for the end user overall. I think we all agree on that.
The most successful performance optimizations I've been part of involved close collaboration between frontend and backend engineers. When a frontend engineer understands database connection pooling and a backend engineer understands the critical rendering path, good things happen.
Modern tooling provides the visibility needed to understand performance across the entire stack. But technology alone isn't enough – we need a cultural shift that recognizes performance as a full-stack discipline.
Conclusion
Performance engineering has come so far since the mainframe and client/server days, but the fundamentals remain unchanged. It’s about the best possible user experience.
True performance optimization requires understanding the entire stack, from database optimization to browser rendering. Only by working together, sharing metrics, and thinking holistically about user experience can we deliver the performance users deserve.

Users actually don’t care what caused their experience to be terrible. They care about whether the application is fast, responsive, and reliable. Otherwise, they take their business elsewhere. Let’s focus our performance efforts around that.
The future of web performance is frontend AND backend, working together toward a common goal: exceptional user experiences that keep users engaged and businesses running like a well-oiled machine.
Are you in one camp or the other, or have you already “bridged the gap” within your organization?
Backend engineers: Are you up on Core Vitals? If you’d like to try out DebugBear and start looking at these metrics seriously, you can sign up for a free trial account.


Monitor Page Speed & Core Web Vitals
DebugBear monitoring includes:
- In-depth Page Speed Reports
- Automated Recommendations
- Real User Analytics Data