
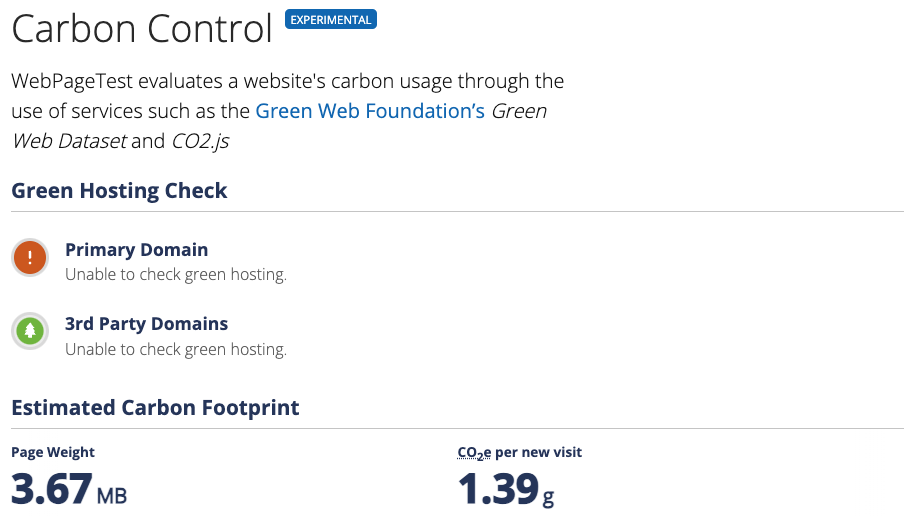
We regularly get requests to include carbon emissions in our website speed test results. However, we don’t display this data as it cannot be meaningfully calculated for a particular website just based on the URL.
This article explains how the internet contributes to carbon emissions, how CO2 calculators work, and why the numbers they report should not be used for decision-making.
How does the internet contribute to CO2 emissions?
The internet mostly contributes to global greenhouse gas emissions through the production and operation of electronic equipment. Overall the information and communications technology (ICT) sector is estimated to account for 1.4% (1.8% including TVs) to 3.9% (including TVs) of carbon emissions.
The emissions of the ICT sector can be broken down into two types:
- Embodied emissions: acquiring materials, producing devices, building cell towers, …
- Operational emissions: electricity consumption (and some offices/business travel…)
Emissions can also be attributed to one of three components:
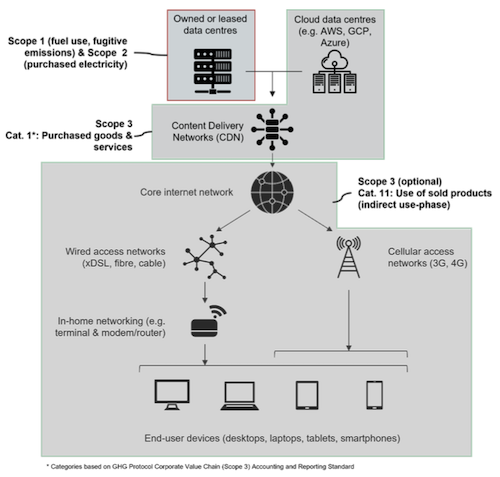
- User devices: laptops, phones, monitors
- Network: broadband and mobile data transmission infrastructure
- Data centers: website hosting and background processing
Ericsson has produced an estimate of how these different components contribute to overall greenhouse gas emissions. User devices account for about half of overall emissions with the rest split evenly between networks and data centers.
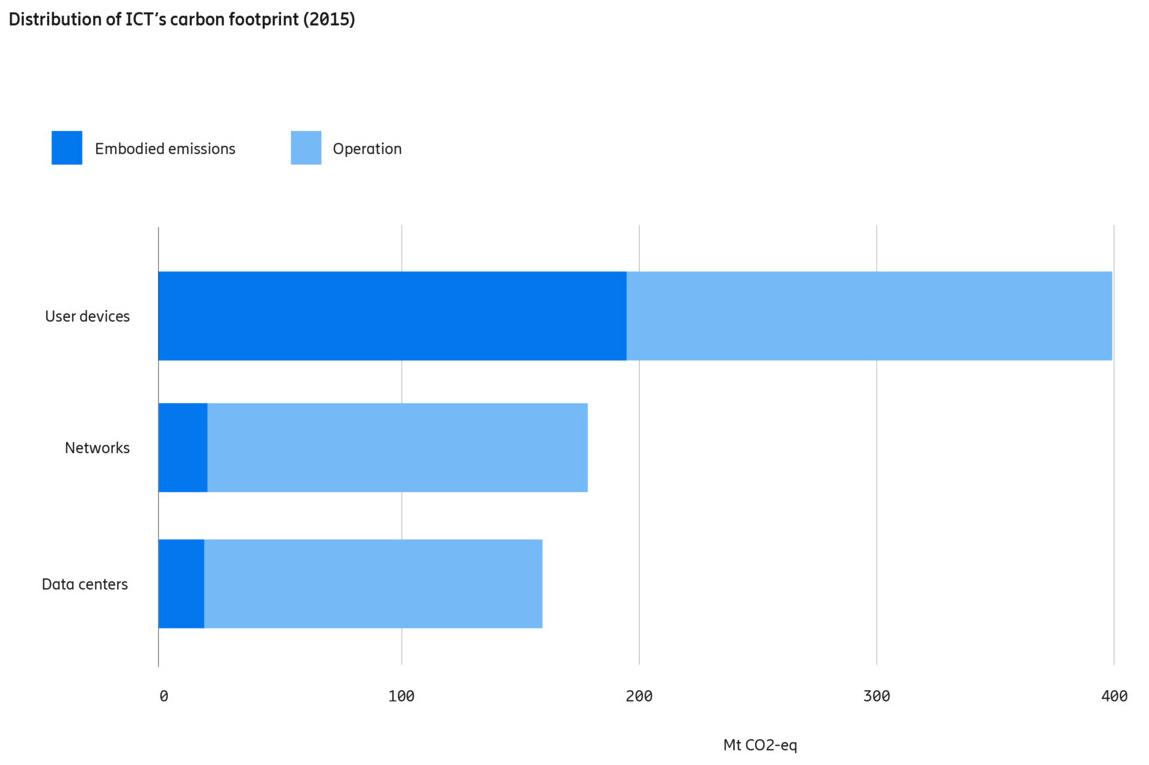
What explains this chart?
- One server can serve many individual users
- Embodied emissions are higher for user devices as they are used less frequently than commercial equipment
A lot of this data is fairly old (2015) and there are disagreements on the breakdown of CO2 emissions into the different components (see Figure 3 here). But it doesn't meaningfully affect the overall point, so we'll accept this breakdown here.
How do website carbon calculators work?
Fundamentally, website carbon calculators follow a three-step process:
- Measure the page weight of the website
- Convert page weight to energy consumption
- Convert energy consumption to CO2 equivalent emissions
For example, we can assume that it takes 0.81 kWh of energy to download one gigabyte of data. That’s based on an annual energy usage of the internet of 2,000 terawatt-hours and 2,500 zettabytes of data transfer.
So if a website takes 2 megabytes of data to download that means we would calculate that loading it takes 0.002 GB * 0.81 kWh = 0.00162 kWh of energy.
We could then look at the carbon intensity of the energy production, for example using a global average value of 437 grams of CO2-equivalents emitted per kilowatt-hour. That gives us a carbon footprint of 0.00162 * 437 = 0.708 grams of CO2.
The first website carbon calculator was created in 2018 by WordPress agency Wholegrain Digital.
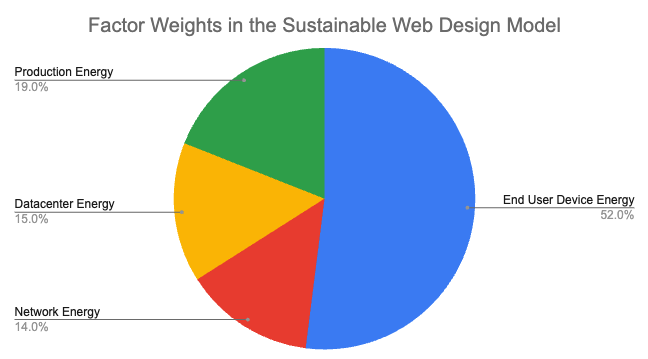
The Sustainable Web Design (SWD) model for website carbon emissions
The SWD model is used by co2.js, the Website Carbon Calculator, and the WebPageTest Carbon Control feature.
Fundamentally it works the same as described above. Carbon emissions are broken down into four factors and an emissions impact is calculated for each one based on the overall page weight.
The breakdown makes it possible to adjust the calculation to various scenarios. For example, if the hosting service used by the website is known to use renewable energy then a lower CO2 per gigabyte estimate can be used for the data center emissions.
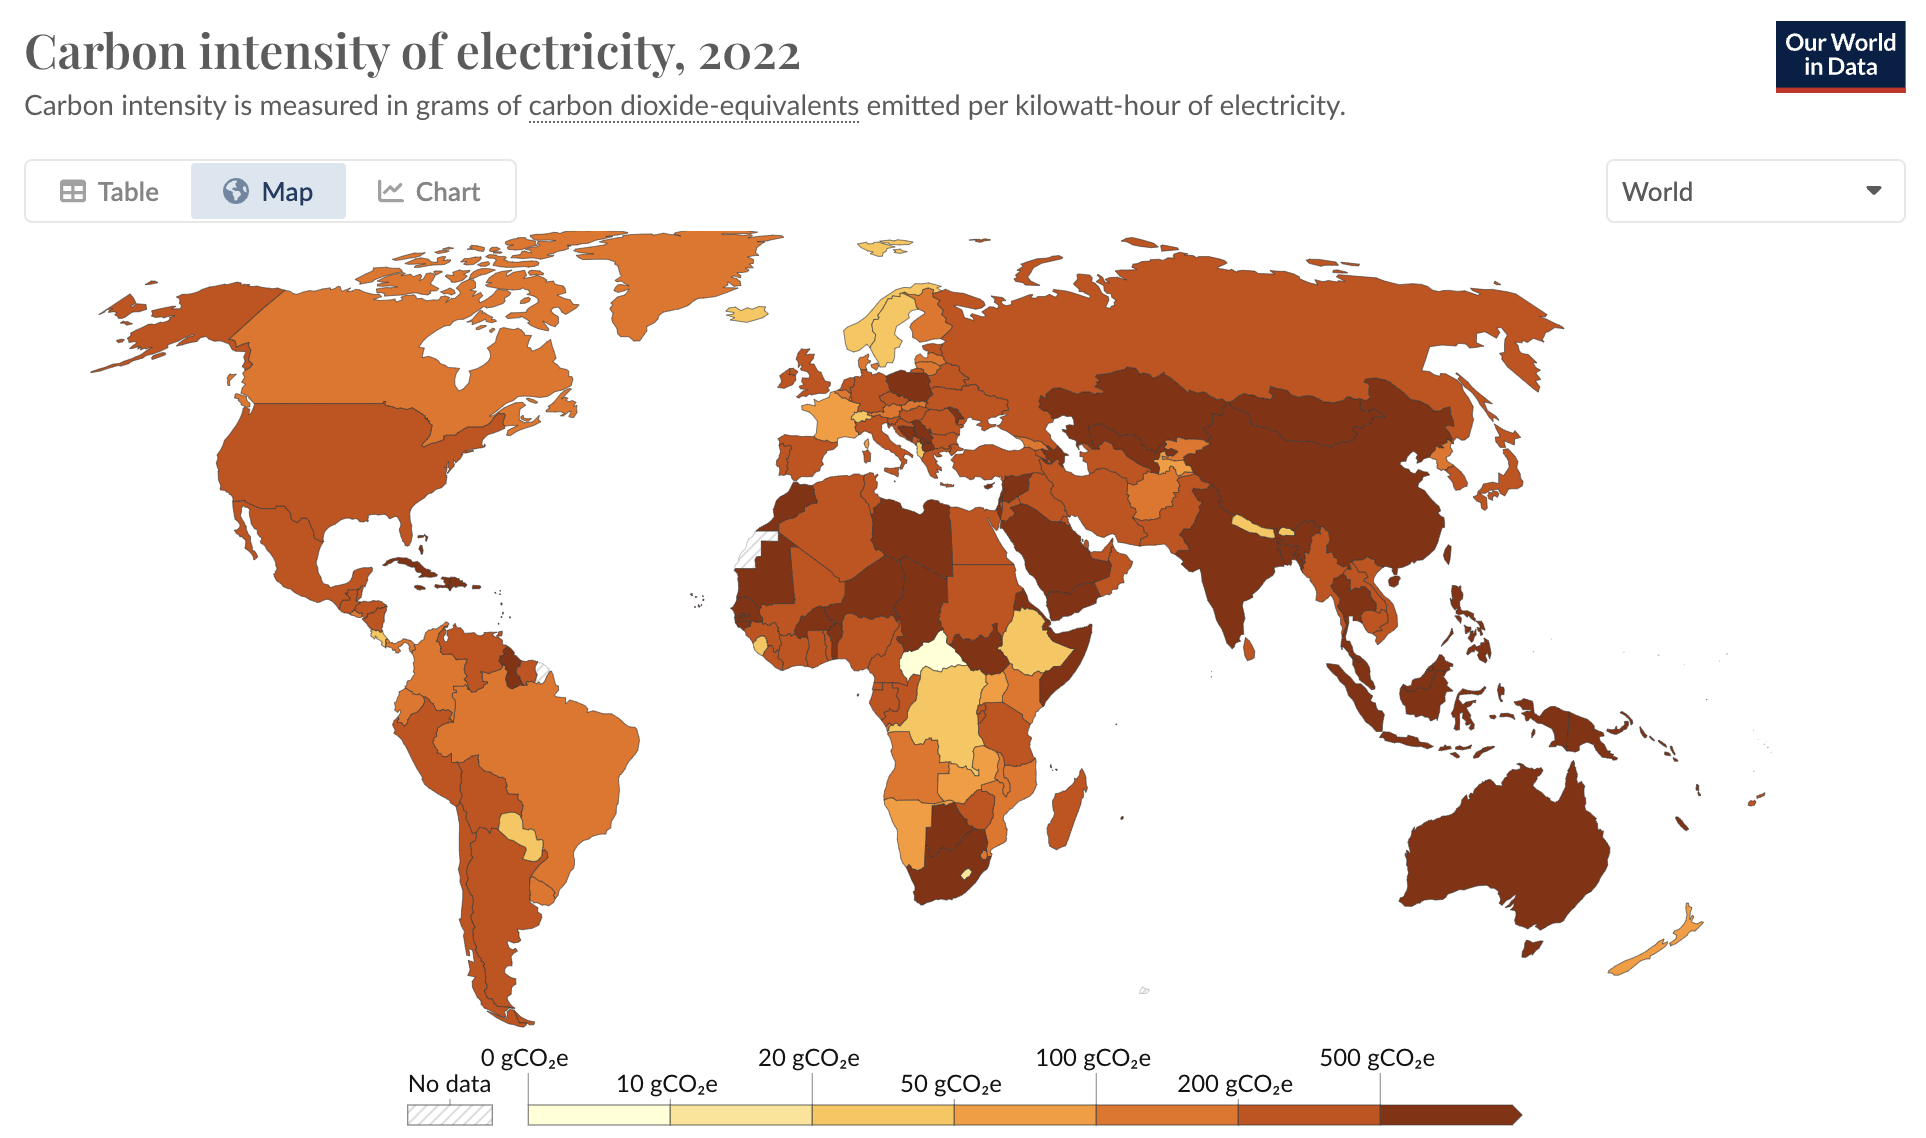
Carbon intensity of electricity production also varies across the world. An Indian user accessing an Indian 2-megabyte website might be reported as causing 0.963 grams of carbon emissions. In contrast, the same scenario in France would result in just 0.246 grams of emissions. That's because France sources most of its electricity from nuclear power.
The Sustainable Web Design model also makes it possible to calculate CO2 emissions for specific requests or to consider the subsequent visits of a page.
Why are website carbon calculators flawed?
Website CO2 calculators measure page weight and assume emissions grow proportionally with page weight. However, page weight is not a useful predictor of the greenhouse gas emissions generated by a website.
Instead, page weight is used as a proxy metric for CO2 because it is easy to measure. Simply open any website and see how many bytes of data are loaded.
ICT carbon emissions are largely caused by:
- Electricity consumption for end user devices, data centers, and network infrastructure
- Embodied emissions in end user devices
None of these metrics are meaningfully correlated with page weight when looking at an individual web page.
The size of a website resource does not predict end user device CPU time
When loading a website many different types of resources are requested. Most resources are static files like images and stylesheets. These files only require a small amount of processing during the initial load of the website.
In contrast, JavaScript application code uses up more time during the initial rendering process and also triggers additional CPU processing later on in the lifecycle of the web page. A 1-megabyte JavaScript file is much more resource-intensive on the client than a 1-megabyte image.
Extra CPU time doesn’t increase user device CO2 emissions by much
So more page weight does not mean more CPU time. But more CPU time also doesn’t mean more CO2 emissions.
We’ve already seen that half the emissions attributable to the end user device come from the production process. This applies especially to phones that use little electricity. Here 90% of greenhouse gas emissions are embodied.
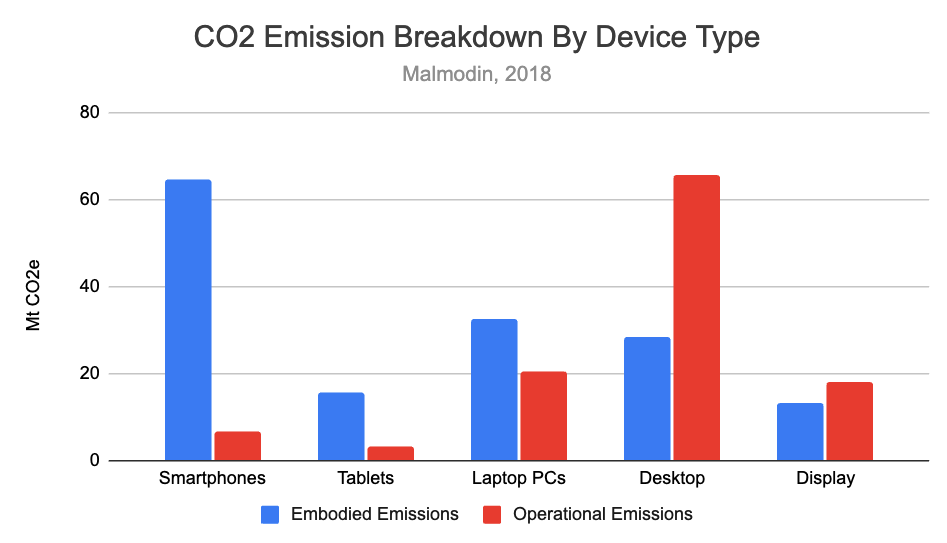
One estimate suggests that 58% of website traffic comes from mobile devices. The devices that people are actually using to access the internet are less likely to use a lot of electricity.
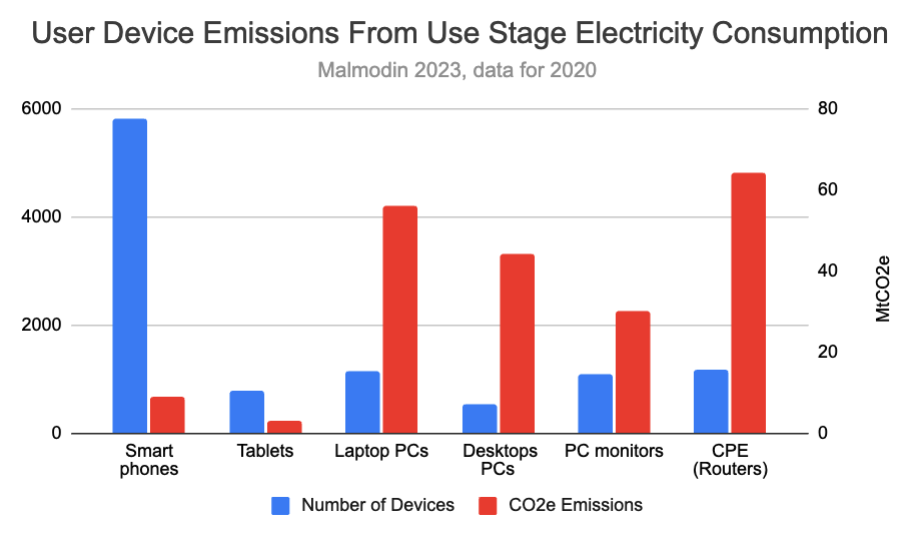
We can also see that displays are a big contributor to electricity consumption. But that number has no relationship with the amount of data necessary to load the page being displayed. Instead it mostly correlates with the amount of time a user spends viewing the content.
Consumer-premises equipment (CPE) like home routers also contribute a lot to overall electricity consumption as these devices are always on rather than being used for a few hours a day. The amount of data processed by these devices does not meaningfully impact their electricity consumption.
On smartphones or laptops the built-in displays also contribute significantly to the power consumption of the device. This energy consumption to display content is independent of CPU activity.
Data volume does not predict server side processing intensity
Ok so as website creators we have little direct control over the energy consumption on end user devices. But what about the backend infrastructure they do control?
Again, page weight is a terrible proxy for energy consumption. The user might load a 10 megabyte image, but this static file requires little server-side processing. At the same time, loading a 10 kilobyte HTML document might require lots of processing to generate. Page speed tools like ours are a good example of this, as most of the energy consumption is spent monitoring a website in the background.
A large static site would get a poor rating from website carbon calculators, despite using little energy on the server. But a small page built using many complex database queries will incorrectly get a good rating.
Traffic load does not have much impact on network energy consumption
The power consumption of network infrastructure does not increase significantly with higher data volumes. A consultant for the Green Web Foundation explains:
Since I started looking into digital sustainability, I have always had the notion in my mind that the more data we send as part of a site or app, the more energy we consume on the network to transfer those bytes [...] It is only recently that I became aware that this couldn’t be further from the truth. In fact, network devices are always on, and their energy consumption is generally independent of their traffic load.
However, the Green Web Foundation’s co2.js library (which is based on the SWD model) still calculates network energy consumption on the basis of page weight.
The creators of website carbon calculators don’t choose page weight for accuracy
The Sustainable Web Design website explains why page weight was chosen to estimate CO2 emissions:
We chose kWh/GB as the key metric on which to calculate the carbon footprint, as this metric is feasible to measure for most web services and is the unit of measurement used by the majority of studies on this topic.
The metric is used as a proxy for energy consumption because it’s easy to measure, not because it is a suitable proxy metric.
Some responsibility here also lies with researchers who use data volume to “project that half of the electric grid will be powering the digital-Internet economy” by 2010 or 21% by 2030 with a worst case scenario of 51%. For reference, Ericsson estimates that the ICT sector used 4% of global electricity in 2020.
Is reporting misleading website carbon reporting a problem?
Website carbon calculators report misleading data that should not be used to inform action for website owners. The Sustainable Web Design website by digital agencies Mightybytes and Wholegrain Digital argues that they are better than nothing:
What if Our Estimates are Wrong? The scientific community has yet to reach broad consensus on how, specifically, to measure emissions from digital products and services. Some are critical of the [Sustainable Web Design model] while others are working to hone and further refine it. To be blunt, we can’t wait while they duke it out.
However, emphasizing a low-impact metric like page weight means that efforts to reduce CO2 emissions are misdirected. Wholegrain Digital’s carbon calculator states the numbers as facts rather than explaining that they are wildly inaccurate estimates.

The agency also argues that impact should generally be overstated:
If we underestimate our emissions, we might conclude that there is no problem to be solved, ignore the issue entirely, and continue to build a web that threatens our chances of keeping global warming under 2°C. If we overestimate our emissions, the worst case scenario is that we build even faster, more efficient web services, save resources, and accelerate the transition to a zero carbon future.
But overestimating website CO2 emissions also means that savings are overestimated. Calculators will report huge reductions in emissions despite little real-world impact.
More generally, misleading data makes it harder for people to build an accurate understanding of the world and make good decisions.
Customers tell me that website carbon calculators are effective at getting stakeholder buy-in for reducing page weight and improving website speed more generally. Estimates based on page weight data wrongly impact decision-making:
It's so helpful to put your website into one of those calculators and it tells you that your website is really, really bad. It tells you in red as well.
WebPageTest explains that “tools for measuring these aspects are also frequently requested from folks who are increasingly being asked to measure and be more accountable for their digital footprint”.
This highlights the risk that stakeholders might believe the numbers reported by carbon calculators and include them in upstream assessments of their organization’s carbon footprint.
Criticism of greenwashing and flawed data is common
Thomas Broyer argued against this type of website carbon reporting after it was added to Catchpoint’s WebPageTest tool:

WebPageTest has a huge visibility, and putting the focus on such a small thing will likely be the tree hiding the forest and lead to more greenwashing rather than real improvements, doing more harm than good. … Among the worst things you did here is possibly the badge. It's as if people proudly display a badge that they switch the lights off every time they leave a room: did they avoid buying many IoT devices? did they replace their appliances for more energy-efficient ones? how about AC? how frequently do they change their TV? …
Incidentally, the badge is a 43 kilobyte PNG file that according to co2.js generates 15 milligrams of carbon emissions each time it is loaded. Thomas has also written a more detailed blog post about internet carbon emissions and what's important.
A discussion about adding CO2 footprint reporting to Google Lighthouse also brought up some concerns. For example, Paul Irish wrote:
I've looked at the various efforts to quantify website energy use/carbon footprint but currently they're rather under-developed compared to web performance or accessibility testing. They primarily use proxy metrics like network request count or byteweight. But relying on these is far too indirect.
And Radu Micu also argued against per-byte emissions:
As far as I see most of those tools use the same study from 2017 and the main metric is number of MB over the wire. I think this is flawed and you can't really measure the carbon footprint using that metric. My home router uses the same electricity if I watch Netflix vs normal browsing, and watching movies consumes way more data (I checked). […] I can have a 10KB website hosted by a nuclear plant or a SPA 100mb site hosted by a Raspberry powered by solar energy. Which one is better? The scientific community has not yet reached a consensus on how specifically to measure emissions from any digital product or service. And I'm not expecting this to happen anytime soon.
What about CO2 emission reporting in Firefox?
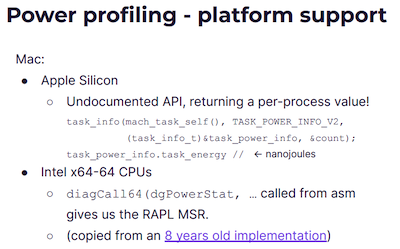
The Firefox profiler supports power profiling and reports energy consumption and converts them to CO2 emissions based on a global average of 442 grams of CO2 per kilowatt-hour.
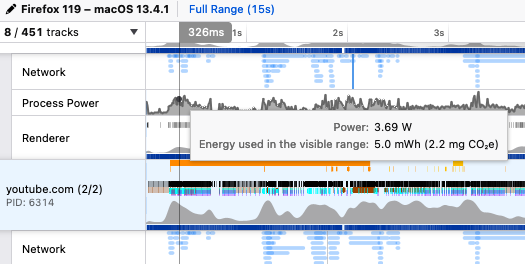
This is much better since it only looks at device CPU consumption that can actually be measured, rather than using a proxy metric to estimate power consumption.
I can’t judge how reliable it is, and Apple doesn’t provide any documentation for the API that this is based on.
What can website operators do to reduce the carbon impact of their services?
Website CO2 emissions cannot be judged from the outside without knowledge of how the website is implemented and how visitors engage with it. It’s ok to say you don’t know rather than making decisions based on flawed data.
However, there are some factors that software companies do have control over. Website owners also have more of the inside data that's necessary for more nuanced assessments than outside tools.
Data center emissions
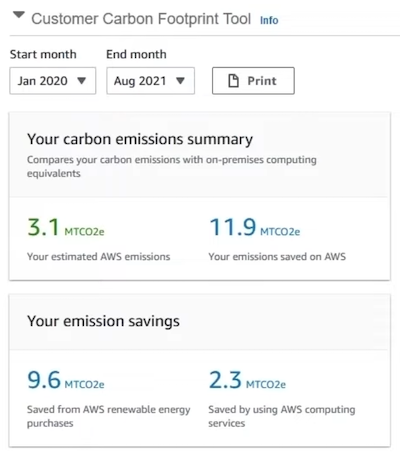
Website owners have the most control over emissions caused by data centers. The big cloud infrastructure companies all provide estimates of CO2 emissions attributable to a customer:
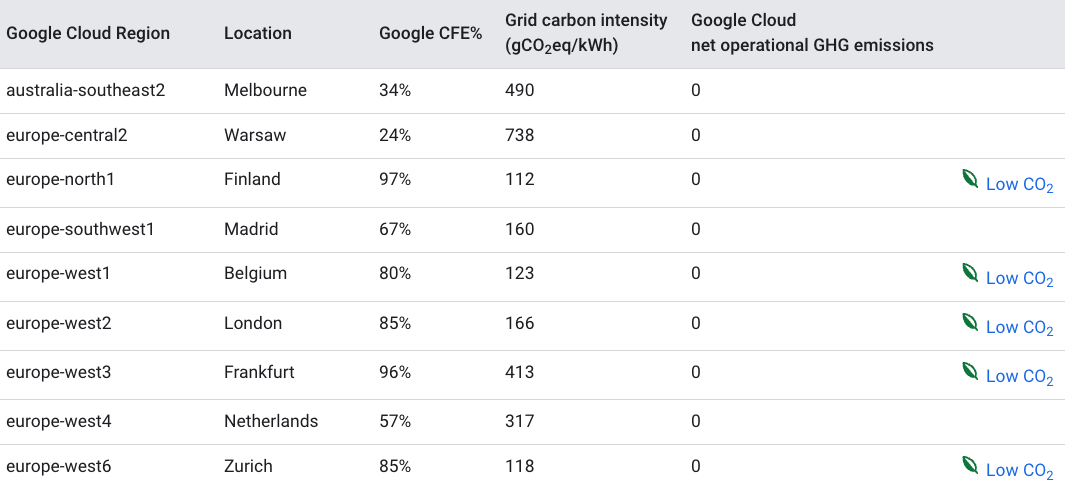
Optimizing workloads is often difficult, but emissions can be reduced for the same workload by running tasks in a low-CO2 region. For example, Google Cloud provides information on the carbon intensity of the grid in different regions.
The big cloud providers buy carbon offsets to be carbon neutral overall across all regions, which is why net emissions are always shown as zero.
The Green Web Foundation also lets you check if your website hosting uses green energy. However, keep in mind that there are many reasons why a green-energy website might show up as "probably not green" in their tool. And a high-carbon website behind a low-carbon CDN would also show up as green.
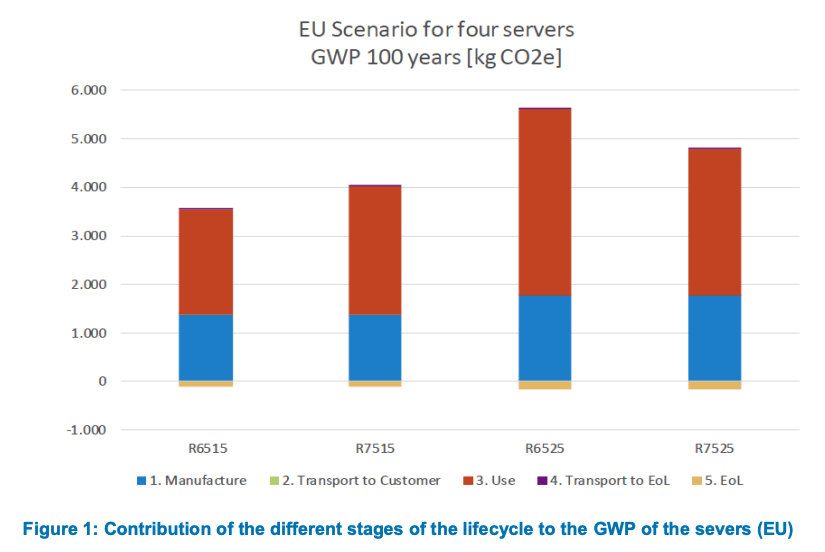
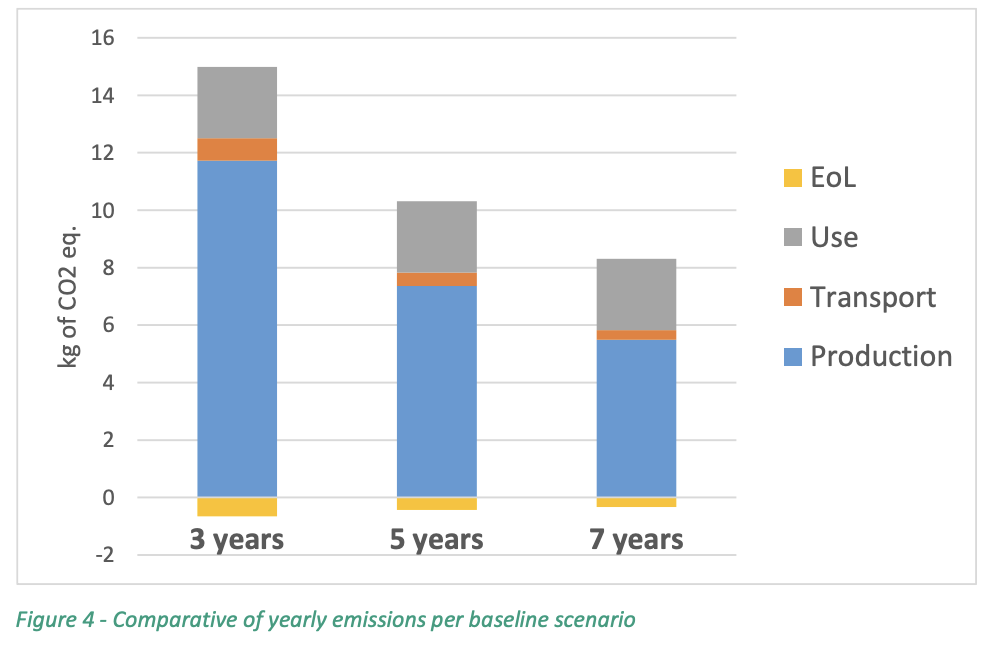
When using your own hardware you can look at carbon footprint reports as well as electricity consumption. For example, here’s a lifecycle assessment for various Dell server models.
User device emissions
End user device emissions are mostly out of the control of website operators.
A large amount of user device emissions comes from embodied emissions. Accordingly, individuals can reduce their CO2 emissions by upgrading their devices less frequently.
Thomas Broyer argues that website owners can support that decision by ensuring a good user experience on lower-end devices:
Don't be the one that will make your users change their device. This is something we won't ever be able to measure, as it depends on how people perceive the overall experience on their device, but it boils down to perceived performance.
Perceived performance can be measured with page speed metrics like Google’s Core Web Vitals. Or even better, by defining custom user timing metrics that measure what’s most important on your website.
These performance metrics can be used by developers to optimize and monitor page experience. But they are not adequate proxy metrics to calculate CO2 emissions.
DIMPACT assessment
A more thoughtful manual assessment can be used to estimate the carbon impact of web services. The DIMPACT tool was created to “understand and ultimately reduce the emissions of serving digital media and entertainment products”. I’m not sure how well it applies to websites more broadly, but generally its methodology statement explains many factors that can be considered when estimating greenhouse gas emissions.
For example, they suggest estimating end user energy consumption and emissions based on the amount of time the service is used rather than data transfer volume.
Interesting insight on network energy consumption
DIMPACT provides some interesting insights on the network component of internet power consumption. For example, it points out that much more energy is used to operate mobile infrastructure than for broadband.
| kWh / GB | |
| Fixed-line broadband | 0.006 |
| Mobile data | 0.1 |
When working with these numbers DIMPACT seems generally quite thoughtful. For example, it explains that “kWh/GB intensity figures are not suitable for estimating the future or instantaneous change in energy consumption of internet network transmission”:
Using an intensity metric based on data volumes (kWh/GB) can only be used to attribute the product or service’s share of the internet’s energy consumption over a defined period in the past using actual estimated (not hypothetical) data volumes, such as for GHG accounting and reporting. Therefore, the intensity figures presented in this section cannot be used to speculate on hypothetical and/or future energy consumption as a result of changing data consumption, especially for high-bitrate activities.
That’s because data and power measurements are historical averages that can’t be used to predict the impact of changes in data volume. Also, “historic trends show network energy intensity halving every two years”, so the conversion factors change quickly.
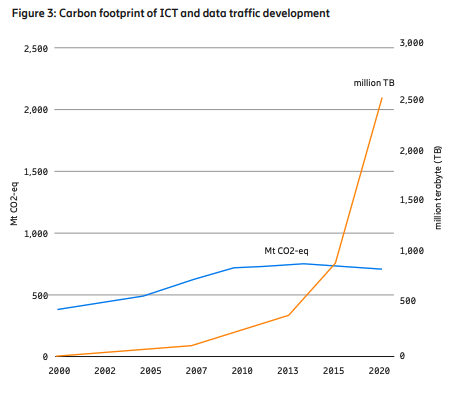
The Ericsson paper also illustrates this point. Note that this chart suggests a recent drop in ICT emissions, but more recent Ericsson data actually suggests a 5% increase between 2015 and 2020.
Overall the DIMPACT model does a good job discussing the individual processes involved in loading a website rather than providing an analysis that’s oversimplified and misleading.
Conclusion
The internet is responsible for a significant amount of greenhouse gas emissions. However, they cannot be estimated for specific websites using online calculators.
To reduce emissions, individuals can upgrade to new devices less frequently. Where significant compute resources are used to serve a website, website owners can use green hosting options and use cloud provider tools to measure their emissions.
Electricity consumption accounts for the majority of emissions from the ICT sector, so a general reduction in the carbon intensity of the electricity grid could reduce emissions. The Ericsson report suggests this may lead to reductions by over 80%, though my sense right now is that this number may be quite uncertain.
Fast websites deliver a better user experience and can also deliver other benefits. However, page speed tools need to be careful to report metrics that users can rely on.