We've been working on improving our real user monitoring product and have integrated LCP subparts from Google's CrUX report.
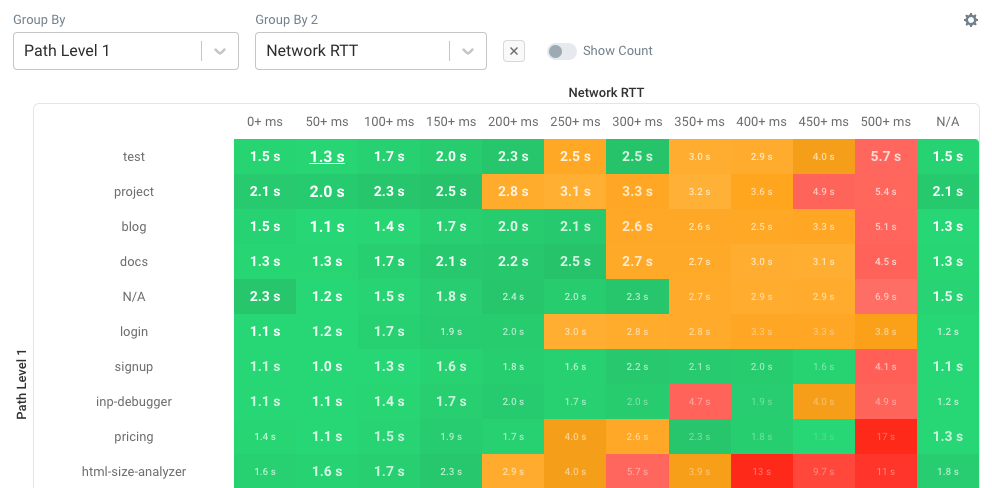
RUM Heatmap tables
Want to know how LCP scores are impacted by network latency and bandwidth? What CLS selectors on what pages cause poor CLS? The heatmap tables feature lets you see how two properties correlate with a performance metric.
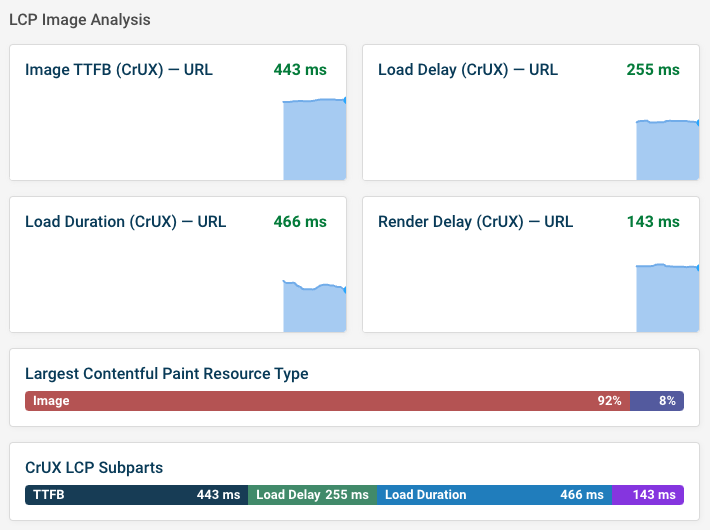
LCP subparts data from CrUX
Google has started to report LCP subparts in the Chrome User Experience Report. DebugBear shows this data in the Web Vitals tab of your lab test results.
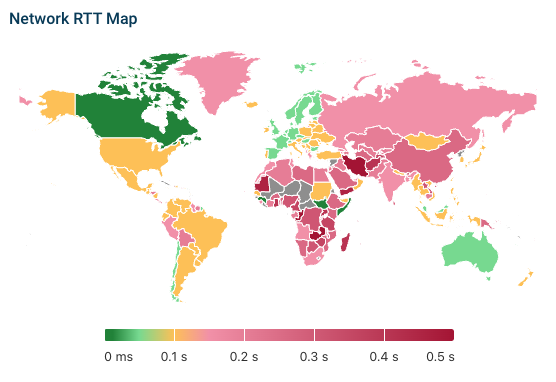
New RUM metrics: network speed and window size
Network latency, bandwidth, window size, and window width are now metrics that you can filter by and that come with their own dashboards.
For example, you can see the network round trip time of your visitors by country!
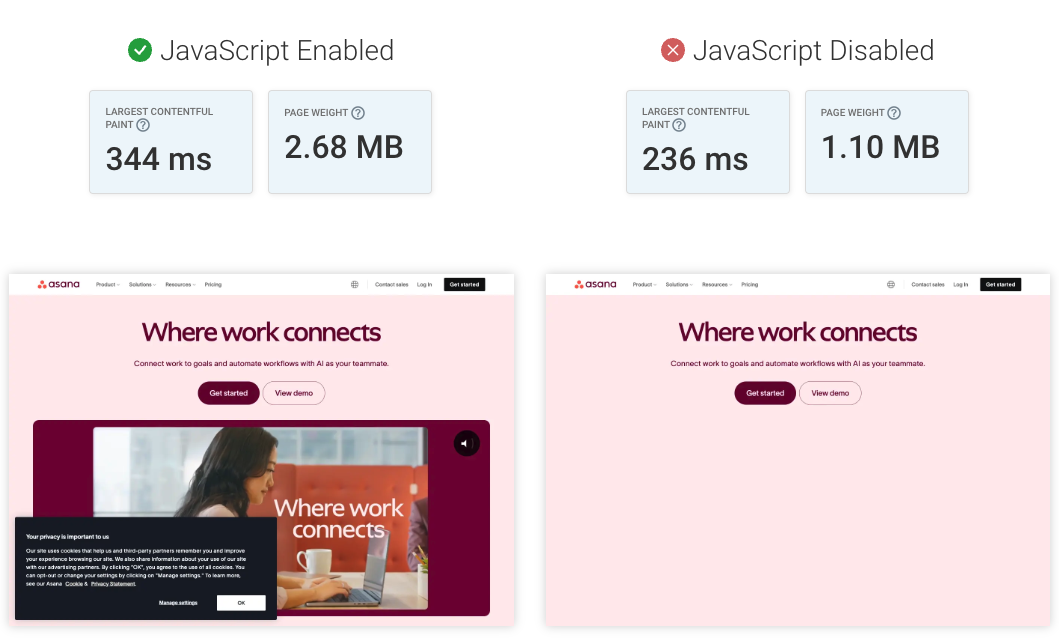
Free NoScript testing tool
Not sure if your website requires JavaScript to load? Use our free NoScript test to find out.
It shows a screenshot of your site with and without JavaScript, as well as reporting LCP and page weight for both test results.
New ecommerce case study
We talked to Blick Art Materials to learn more about how they use DebugBear to deliver the fastest website in their industry.
New articles to improve your website speed
We've published a bunch of new articles to help you improve visitor experience. For example:
- How To Speed Up Your Wordpress Site: a step-by-step guide to improve Wordpress performance
- A Guide to Chrome DevTools: get started with Chrome DevTools and discover some less well-known features
- Preload Web Fonts For Better Web Vitals: learn how font preloading can make your website load faster
- Understand the Critical Rendering Path: identify the key resources needed to render content on your website and what you can do to optimize them
New Youtube videos
We've been putting more effort into publishing videos to explain web perf issues in more detail: