More alerting options, improved design, and new Lighthouse insights audits.
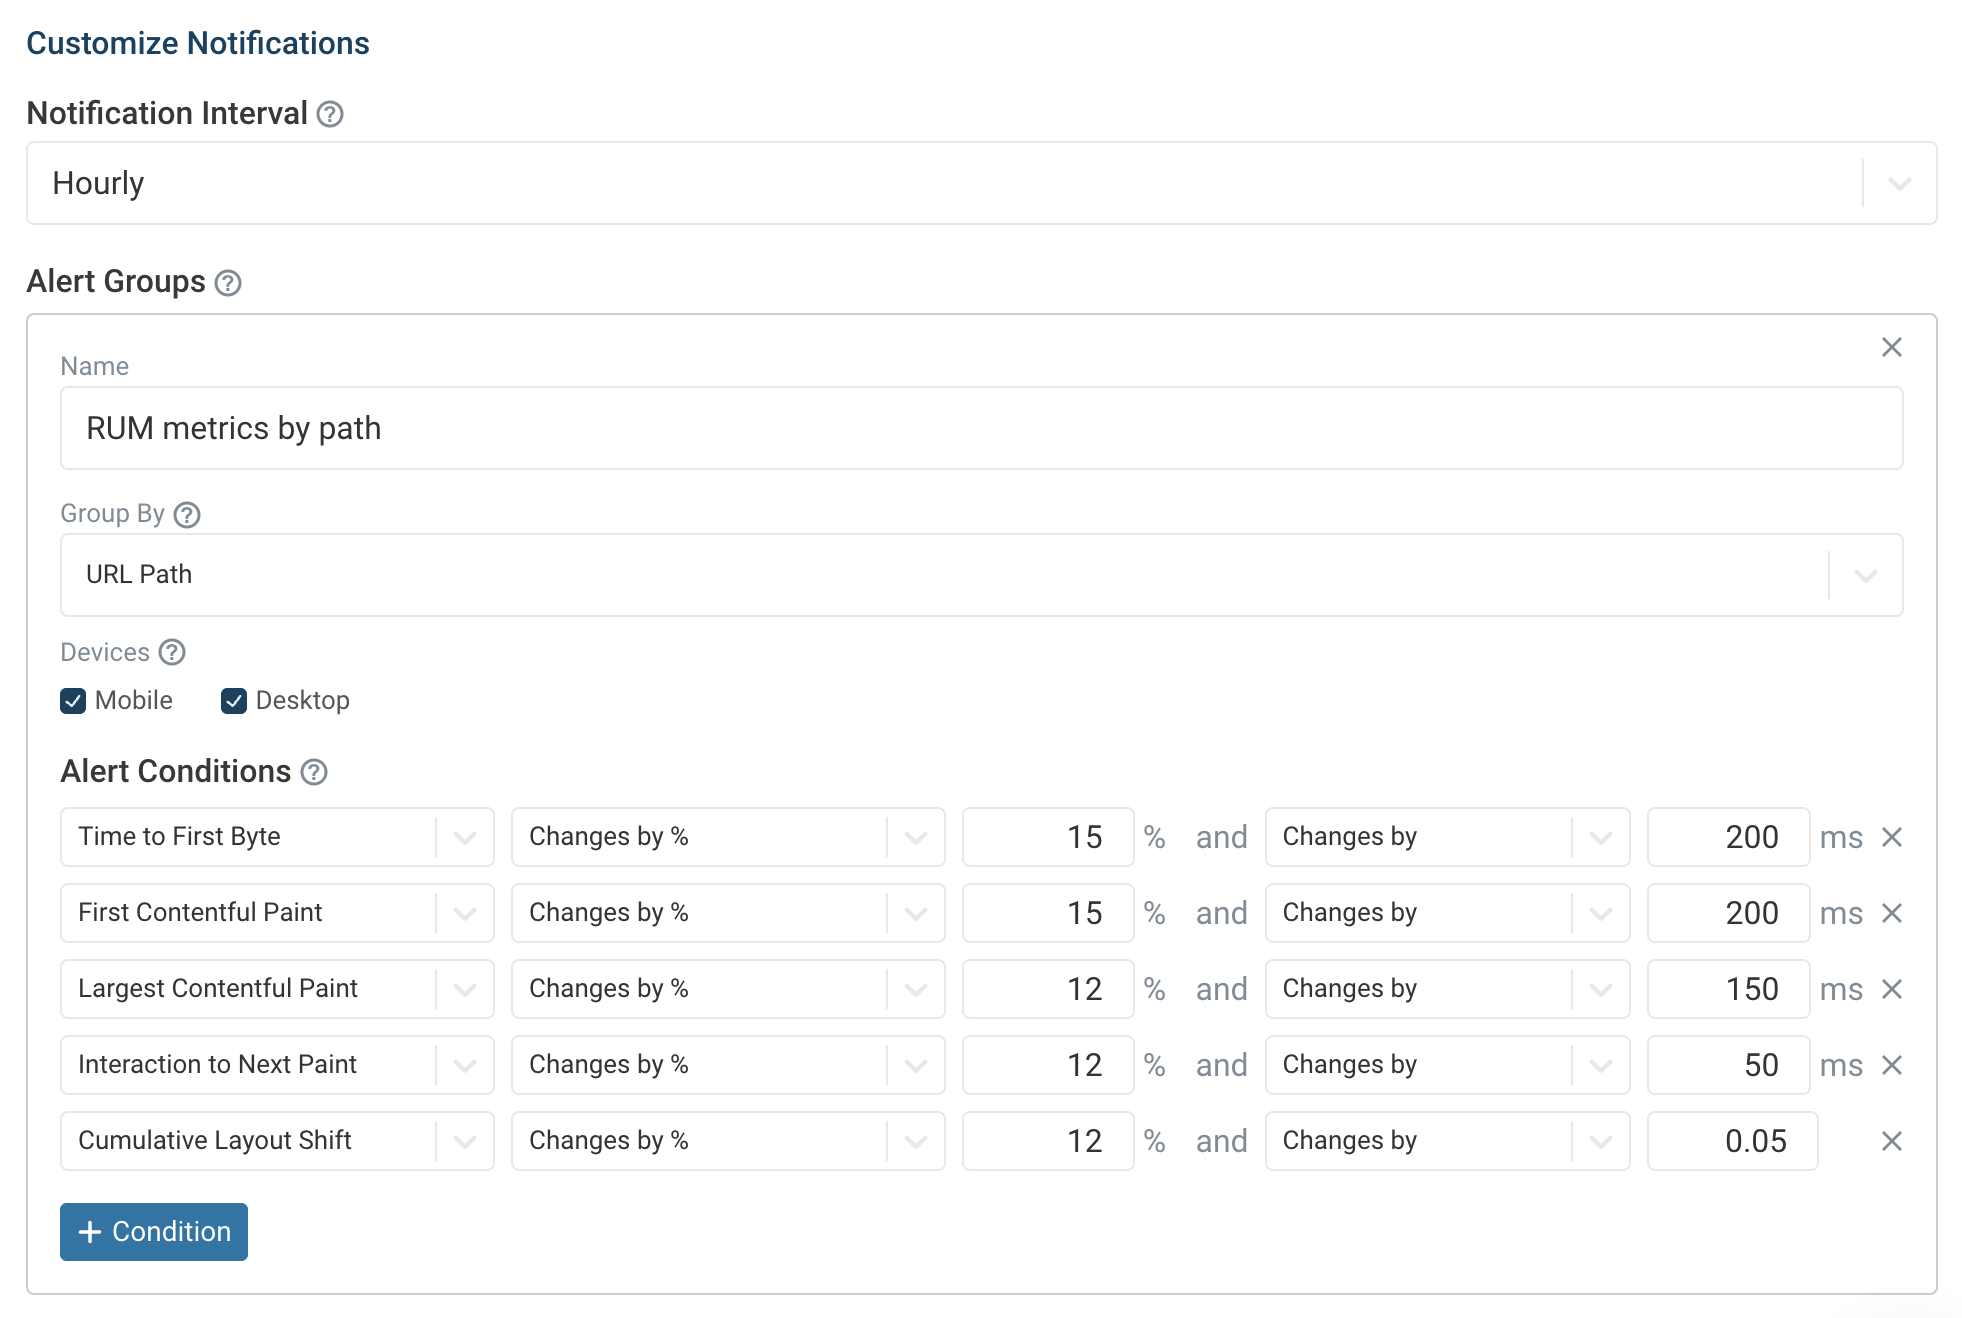
Customize RUM alerts
You can now set custom alert thresholds for real user monitoring data.
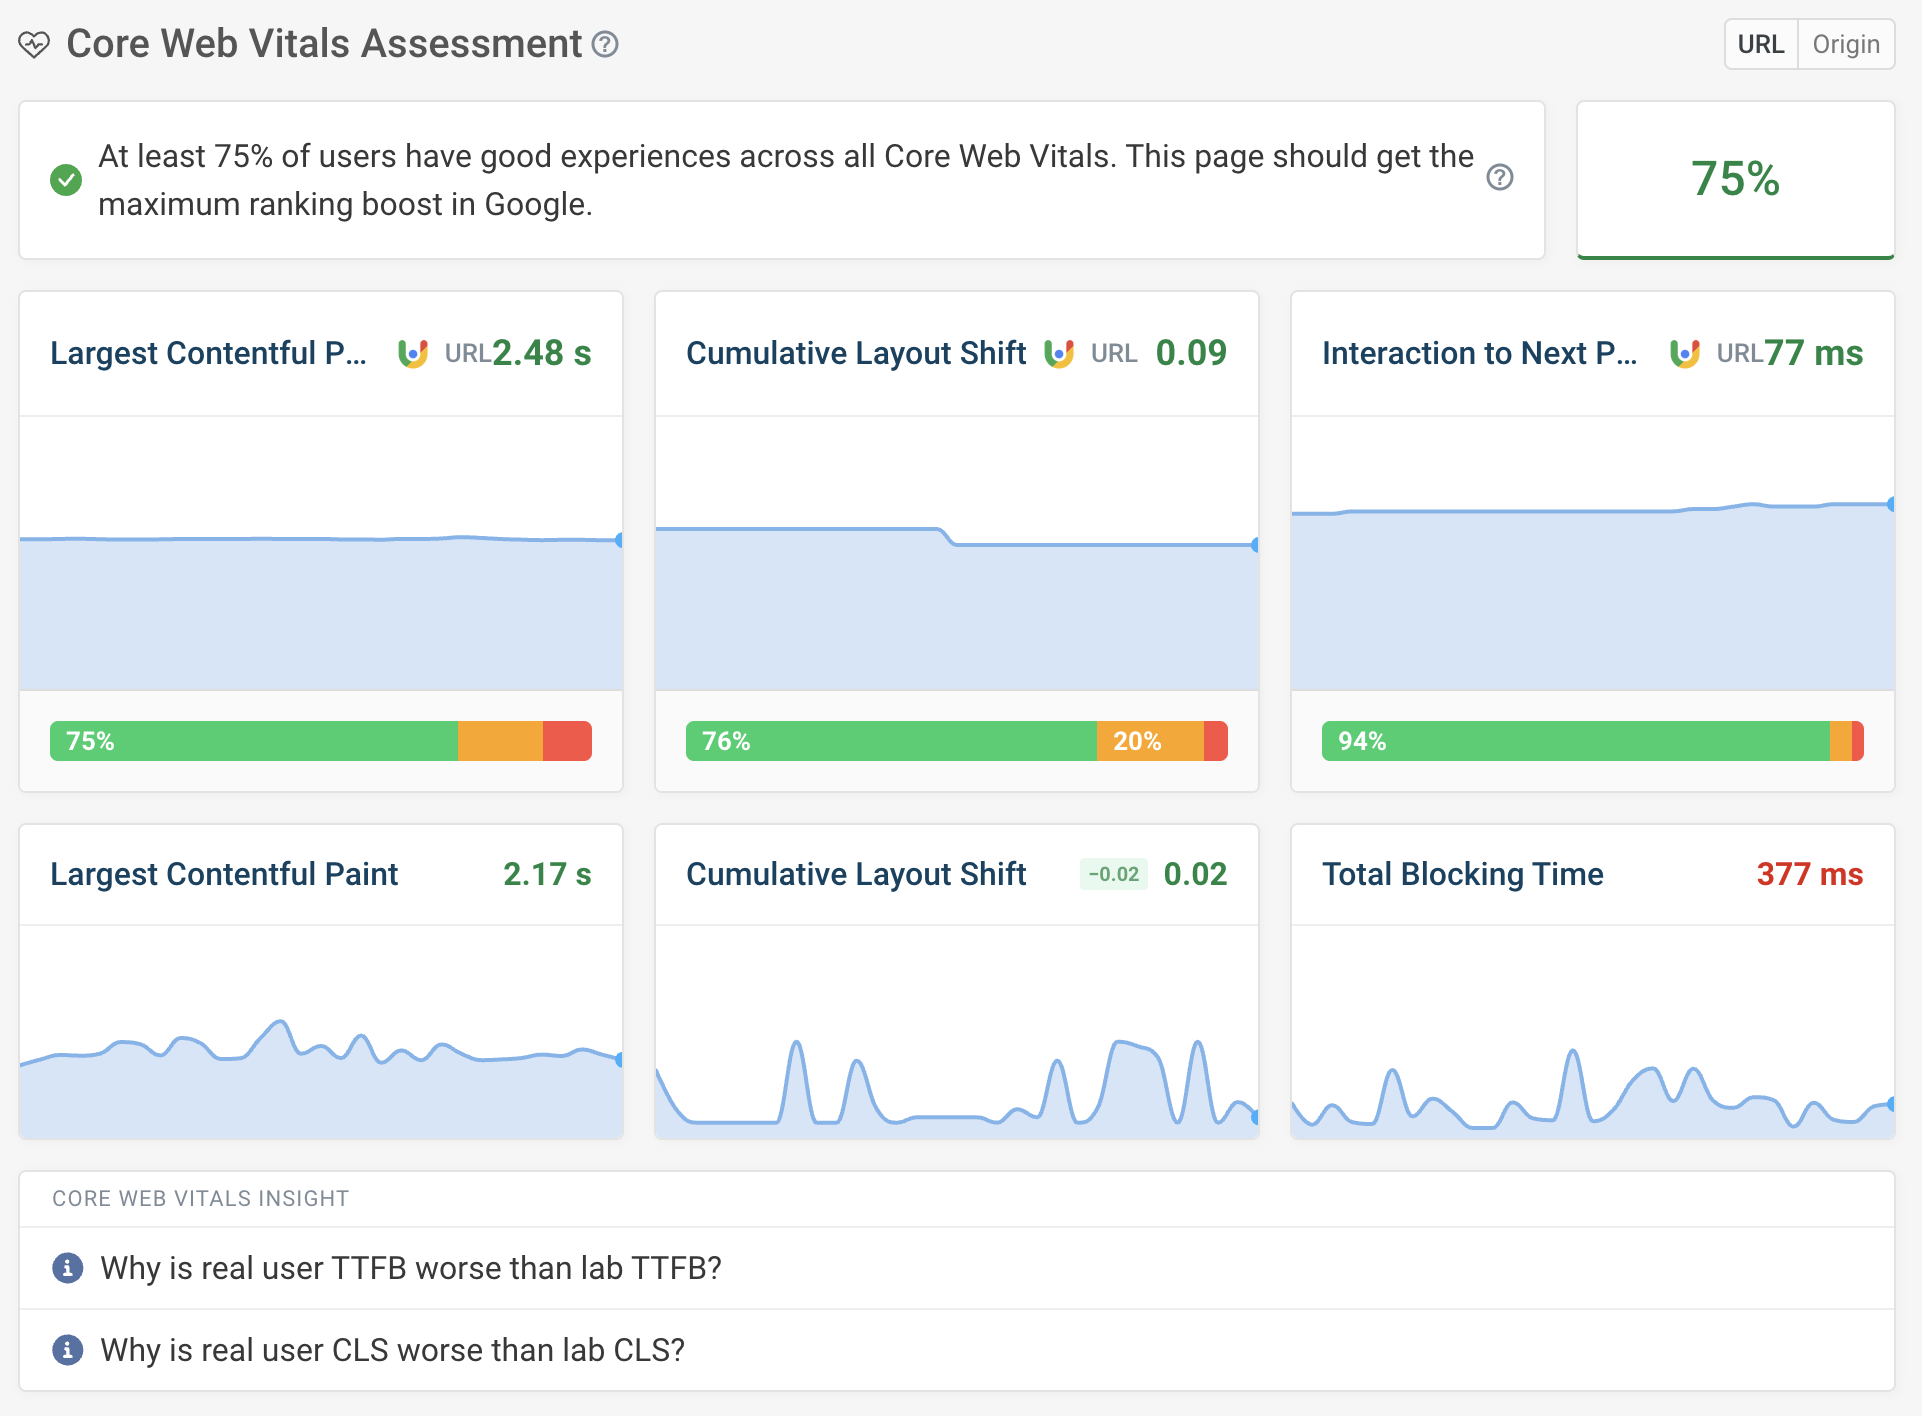
Design updates
We've tidied up our application to make it easier to find the most important information. In particular, the Web Vitals tab has a new structure separating the overall Core Web Vitals assessment from metric-specific debug data.
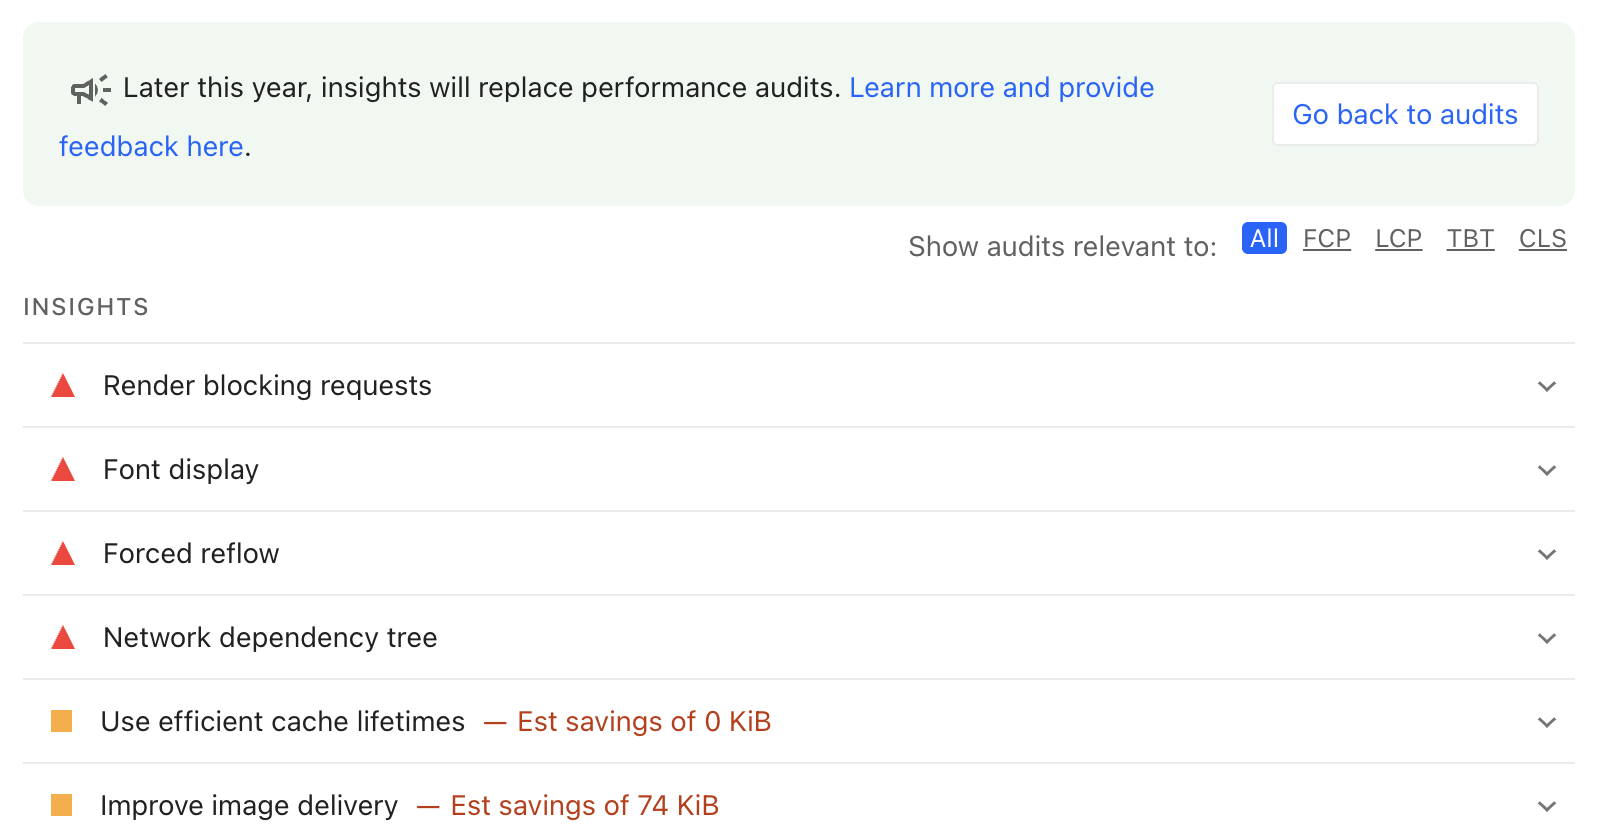
Lighthouse upgrade
We've upgraded Lighthouse to version 12.6.0, which includes the Lighthouse performance insights audits!
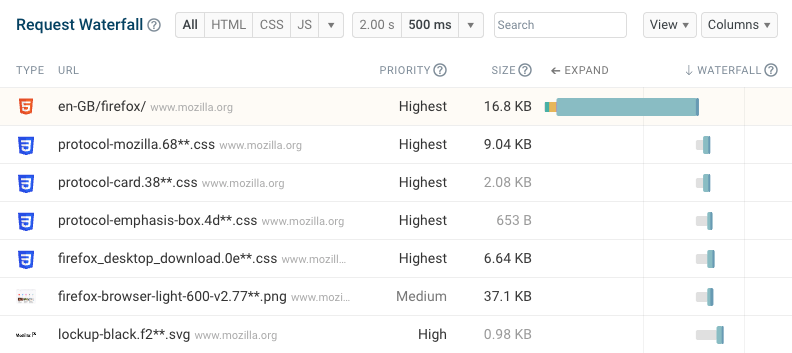
New free tool: view HAR file request waterfalls
HTTP Archive files record what resources a browser loads when loading a website. Our new free HAR file analyzer lets you visualize HAR files using the DebugBear request waterfall.
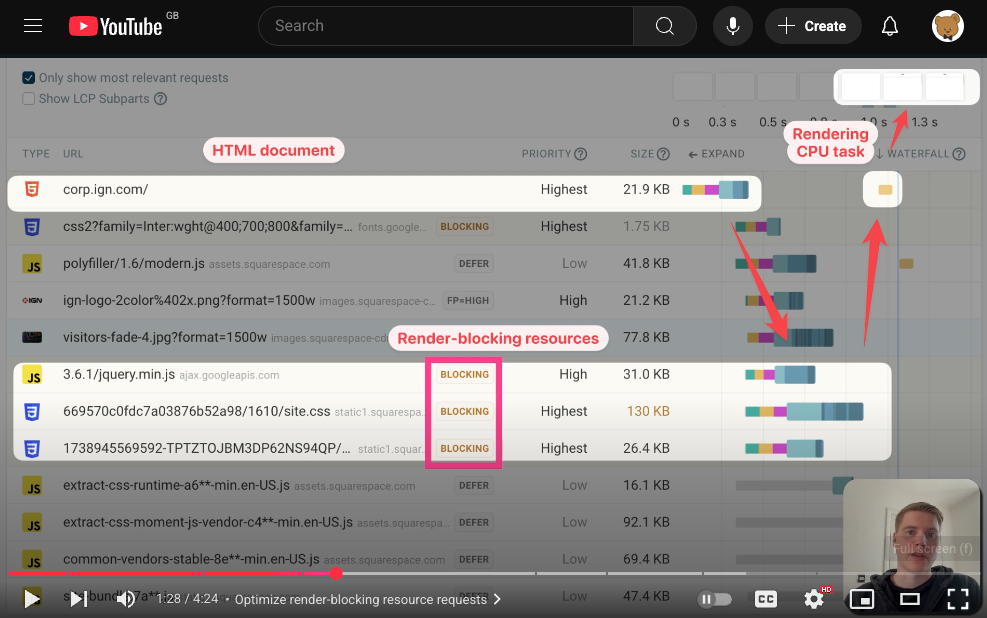
New video: how to improve website performance
We've published a Youtube video explaining how to improve website performance by identifying and fixing common page speed issues.
New on the blog:
- Why can I still load a blocked website? - how Google uses speculation rules and proxies for better performance.
- How to Improve Image Delivery on Your Website - learn how to optimize image size for better LCP scores.
- How To Optimize Document Request Latency - techniques to reduce load time for the HTML document