
With website speed a critical ingredient for SEO success, developers and digital marketers need reliable tools to monitor their Core Web Vitals.
Google's Chrome User Experience Report (CrUX) Dashboard has long been a go-to solution for tracking real-world user experience data. But it's now deprecated, so you'll need an alternative solution to track your Core Web Vitals.
In this article, we'll take a look at Google's current CrUX Dashboard as well as some useful alternate options for reporting site speed, SEO and, ultimately, user experience.
What is Google's CrUX Report Dashboard?
Well-known to SEO and technical professionals, Google's CrUX dashboard is a simple Looker Studio report that can be run against millions of URLs from the public internet.
On 9 September 2025, Google announced that the CrUX Dashboard is deprecated. It will stop working at the end of November 2025.
You'll get back colorful bar charts illustrating the page's month-by-month performance for the three Core Web Vitals – Largest Contentful Paint, Interaction to Next Paint and Cumulative Layout Shift – as well as other supporting data points such as Time to First Byte, First Paint and so on.
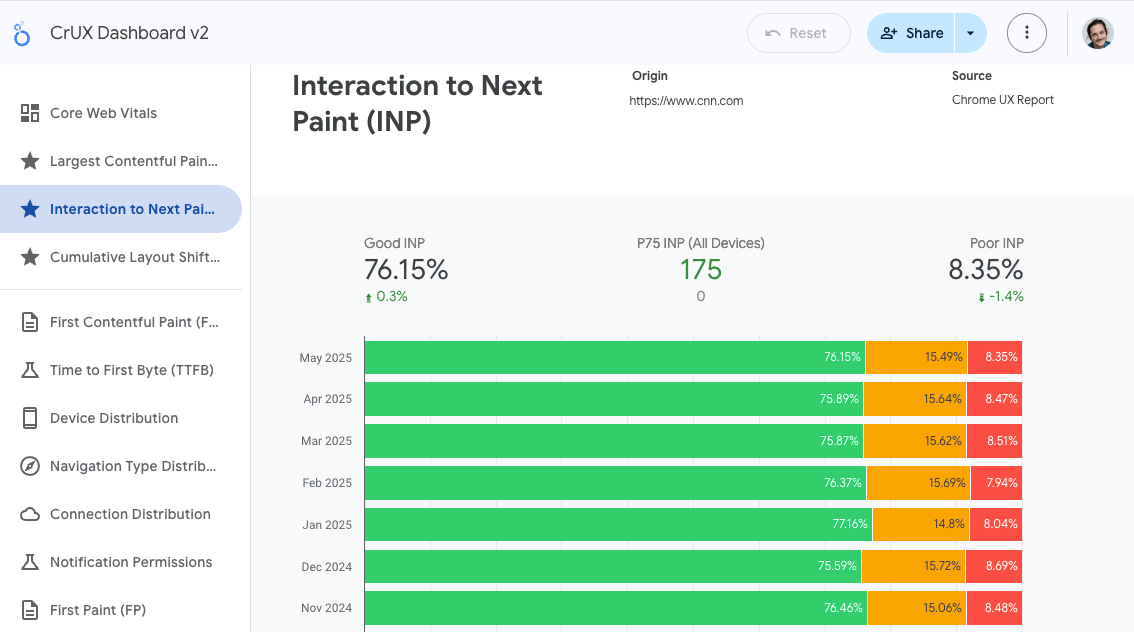
It's as simple to run a competitor's URL through this tool as it is one of your own, but you can only examine data for one page at a time, which isn't ideal if you have a wide variety of pages to monitor.
If you aren't seeing the information you'd expect, ensure you're entering the URL exactly as it appears in the browser. For instance, 'cnn.com' comes up empty, but 'www.cnn.com' provides the correct data.
Alternatives to Google's CrUX Report Dashboard
If the CrUX dashboard doesn't meet your needs, consider one of these alternatives for monitoring your Core Web Vitals:
- DebugBear monitoring
- Google's new CrUX Vis tool
- PageSpeed Insights
- General-purpose SEO tools like Ahrefs or SEMrush
1. DebugBear: the most comprehensive alternative
If you need comprehensive Core Web Vitals insights, a performance-focused tool like DebugBear could be the way to go.
Not only will you find all of Google's CrUX data, along with guidance from PageSpeed Insights, you'll also get access to custom site testing, and real-user monitoring of every page on your site – not just those with enough traffic to populate the CrUX report.
DebugBear also makes it easy to benchmark your website within your industry using CrUX data.
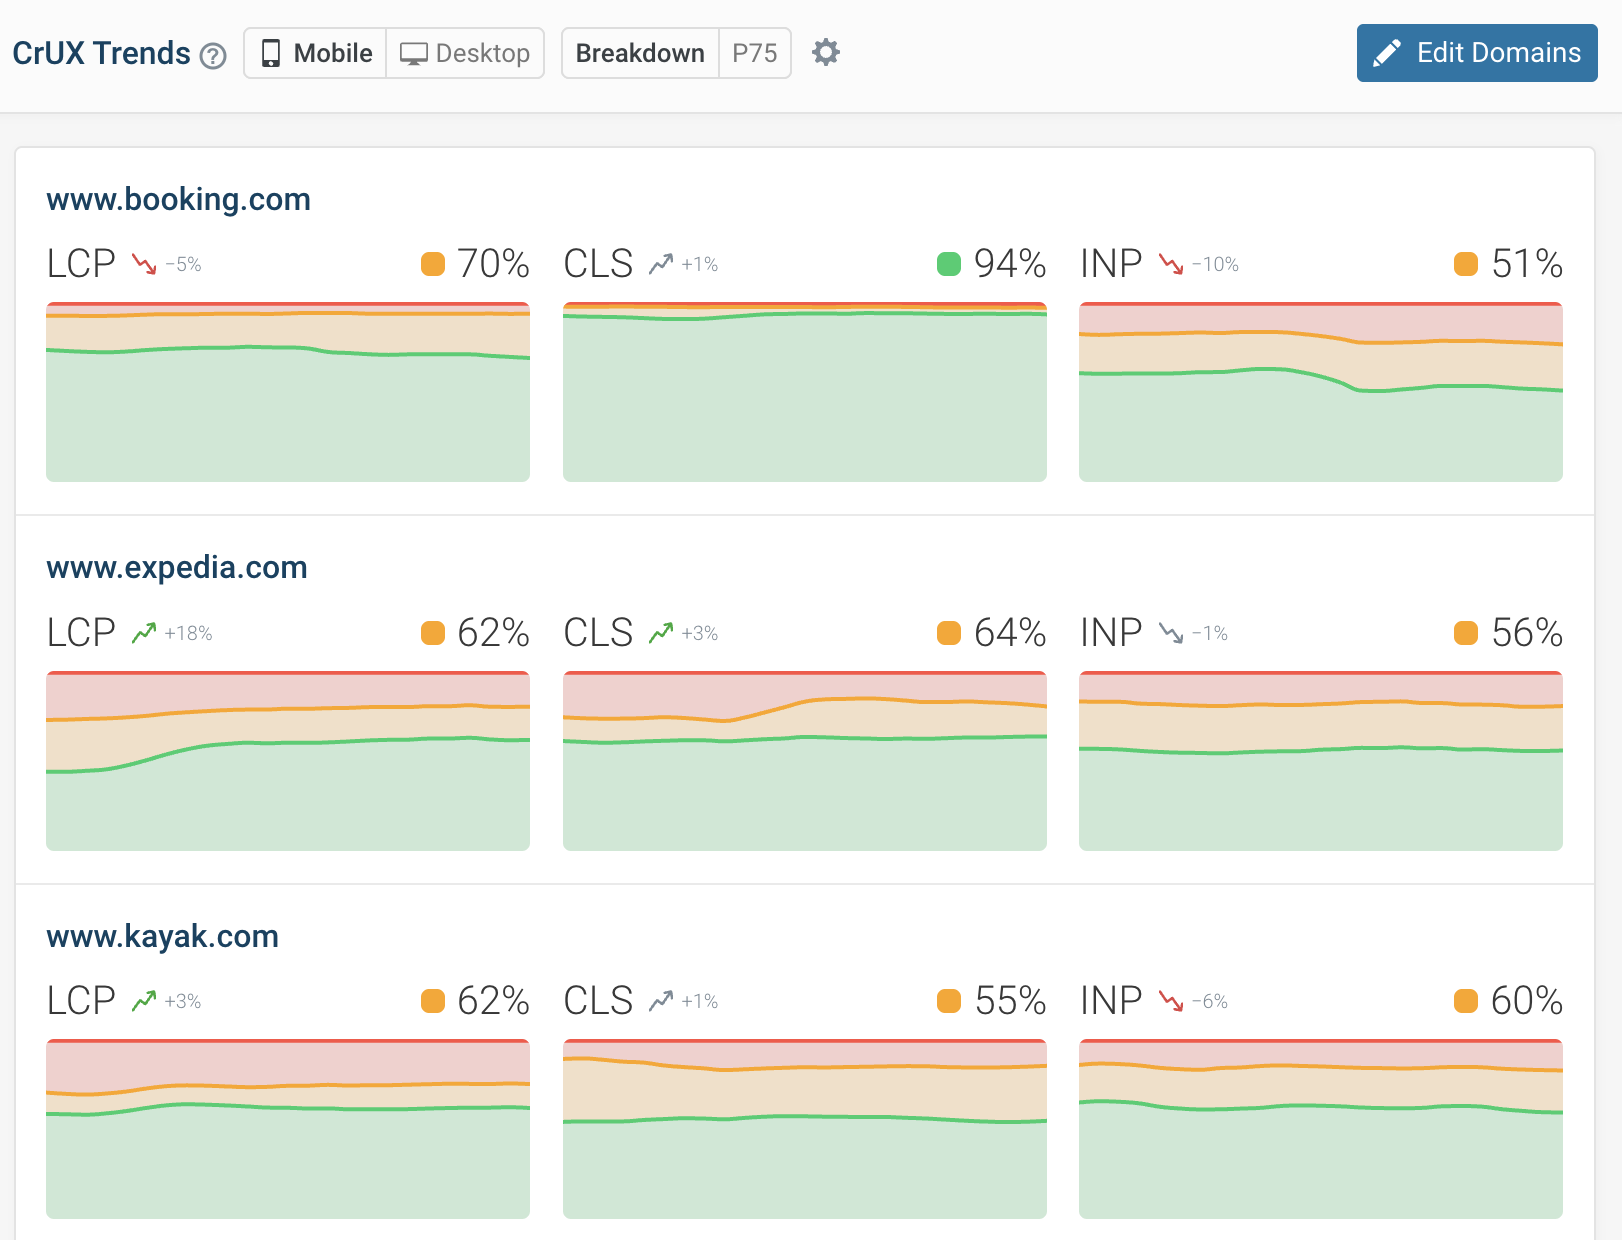
The real user monitoring feature lets you collect real-time web vitals data on your website. You can spot trends across your website or dive into specific visitor experiences to see how you can improve them.
In contrast, CrUX data has a 28-day update delay and doesn't support detailed analysis to fix problems on your website.
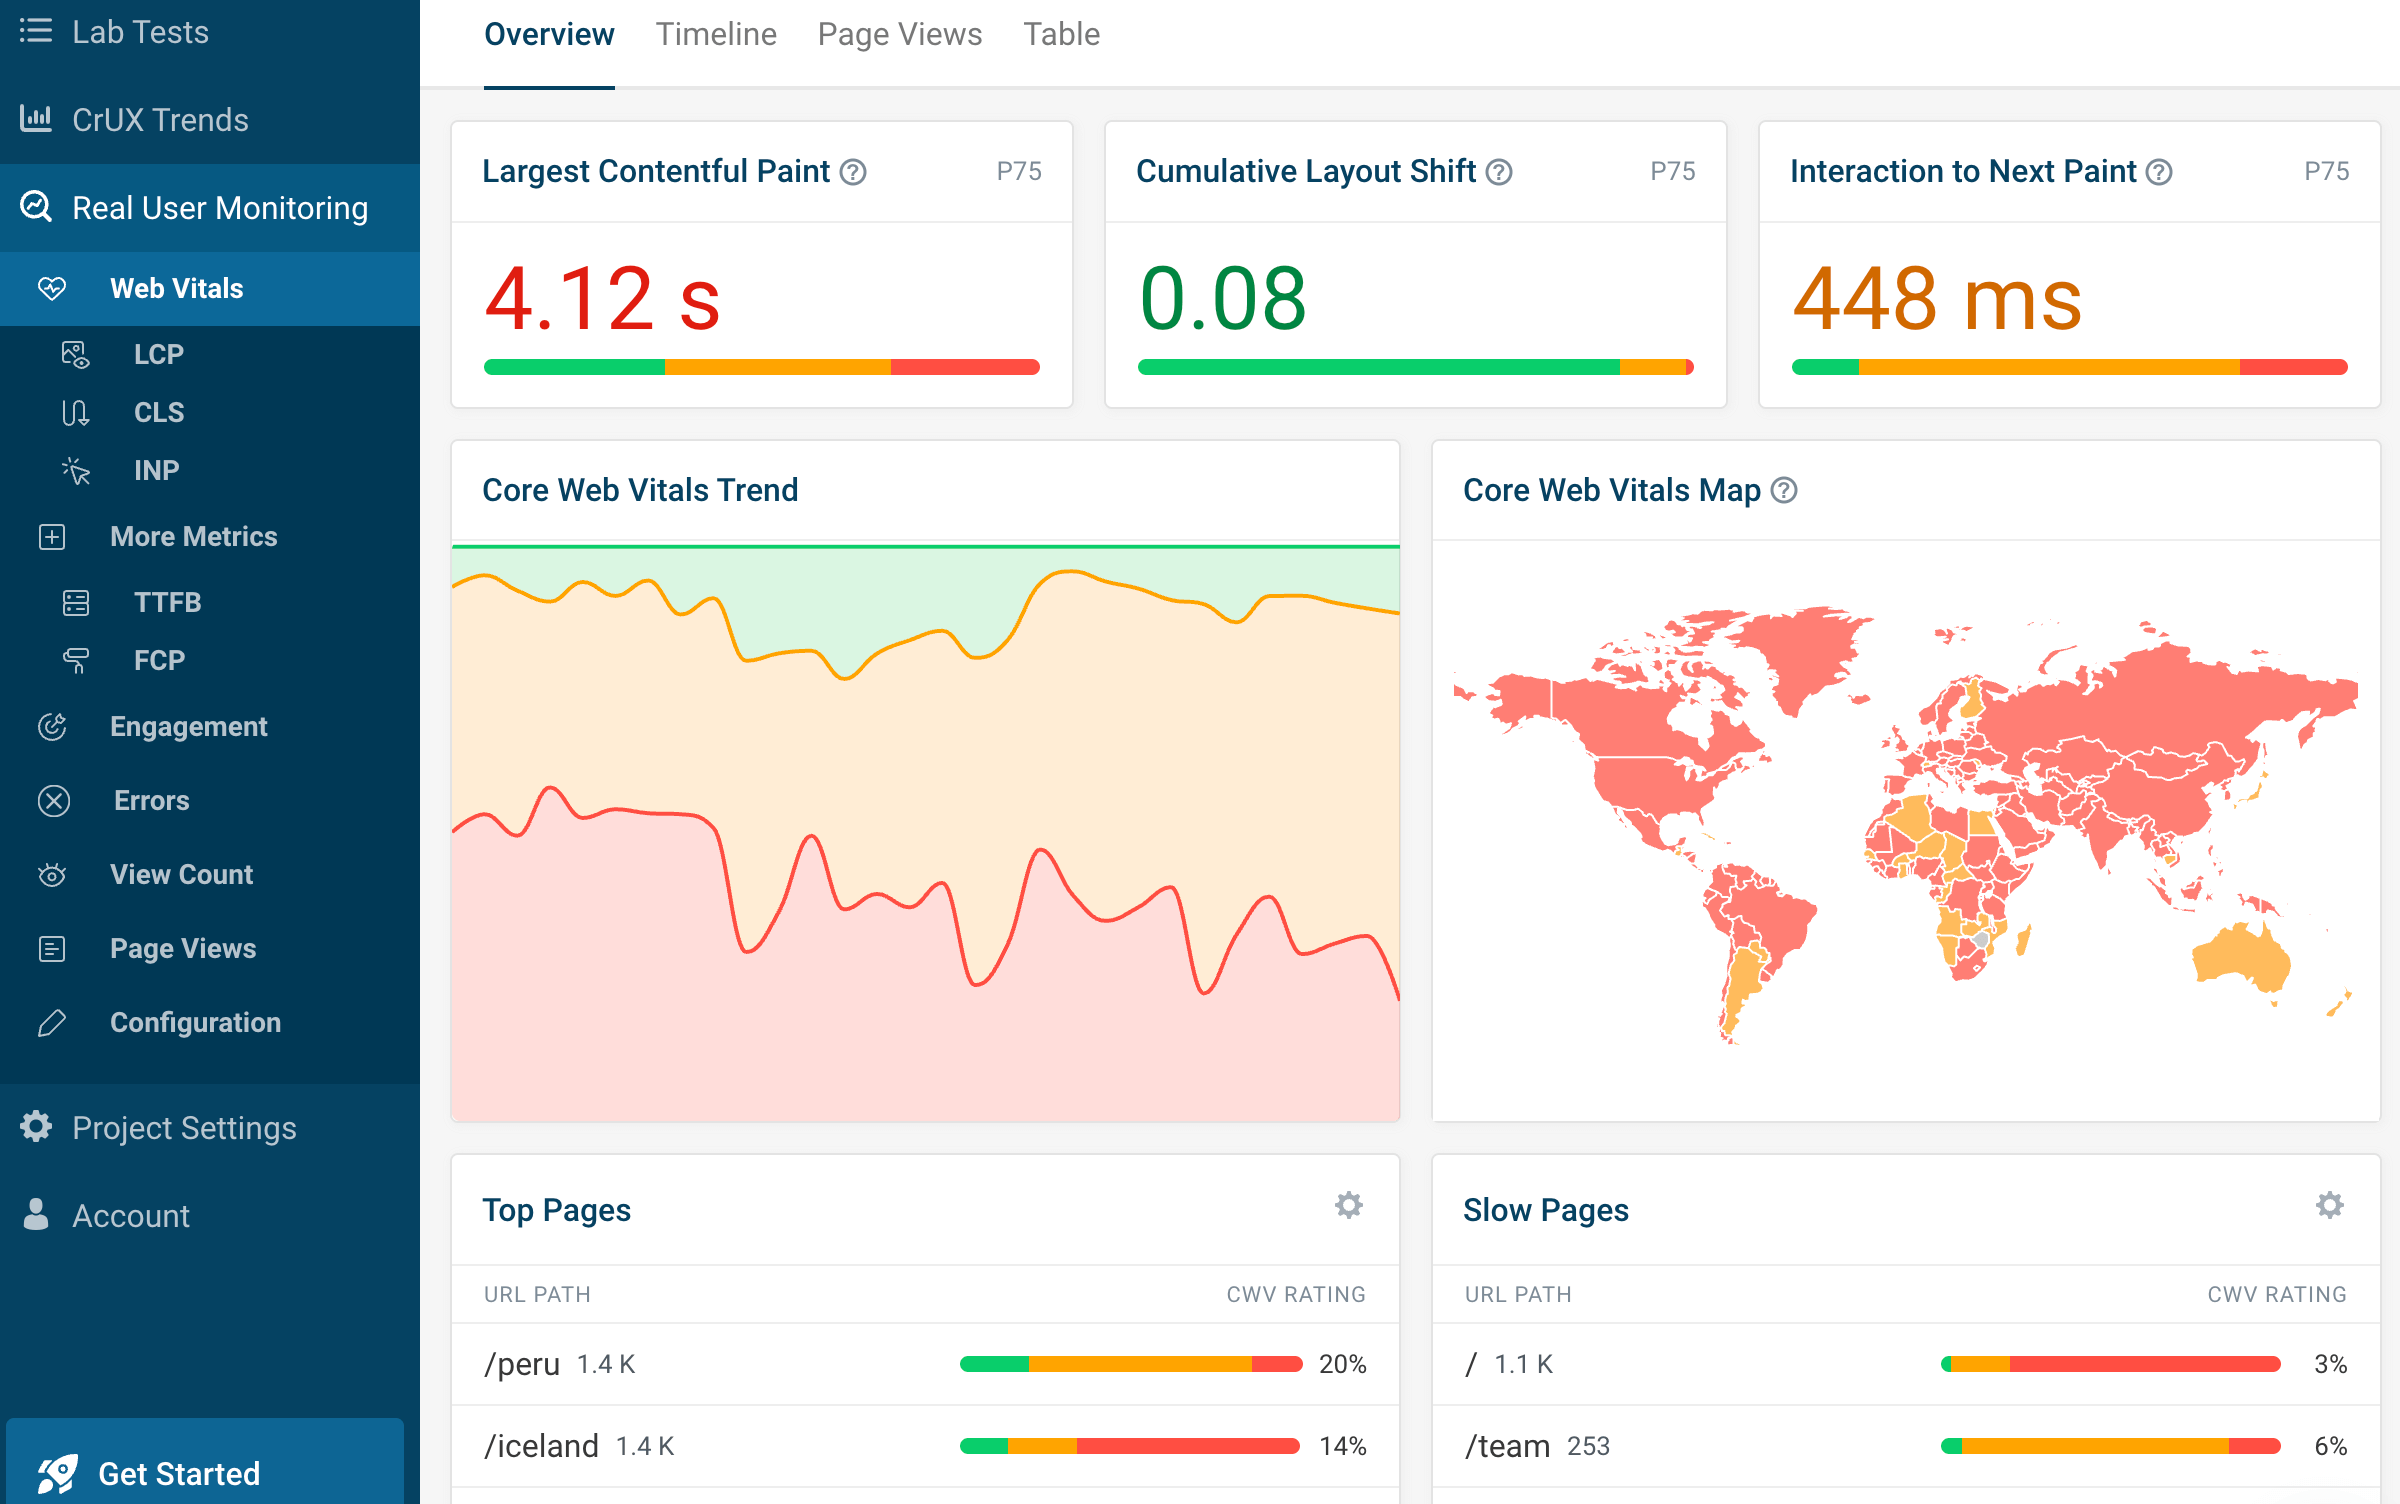
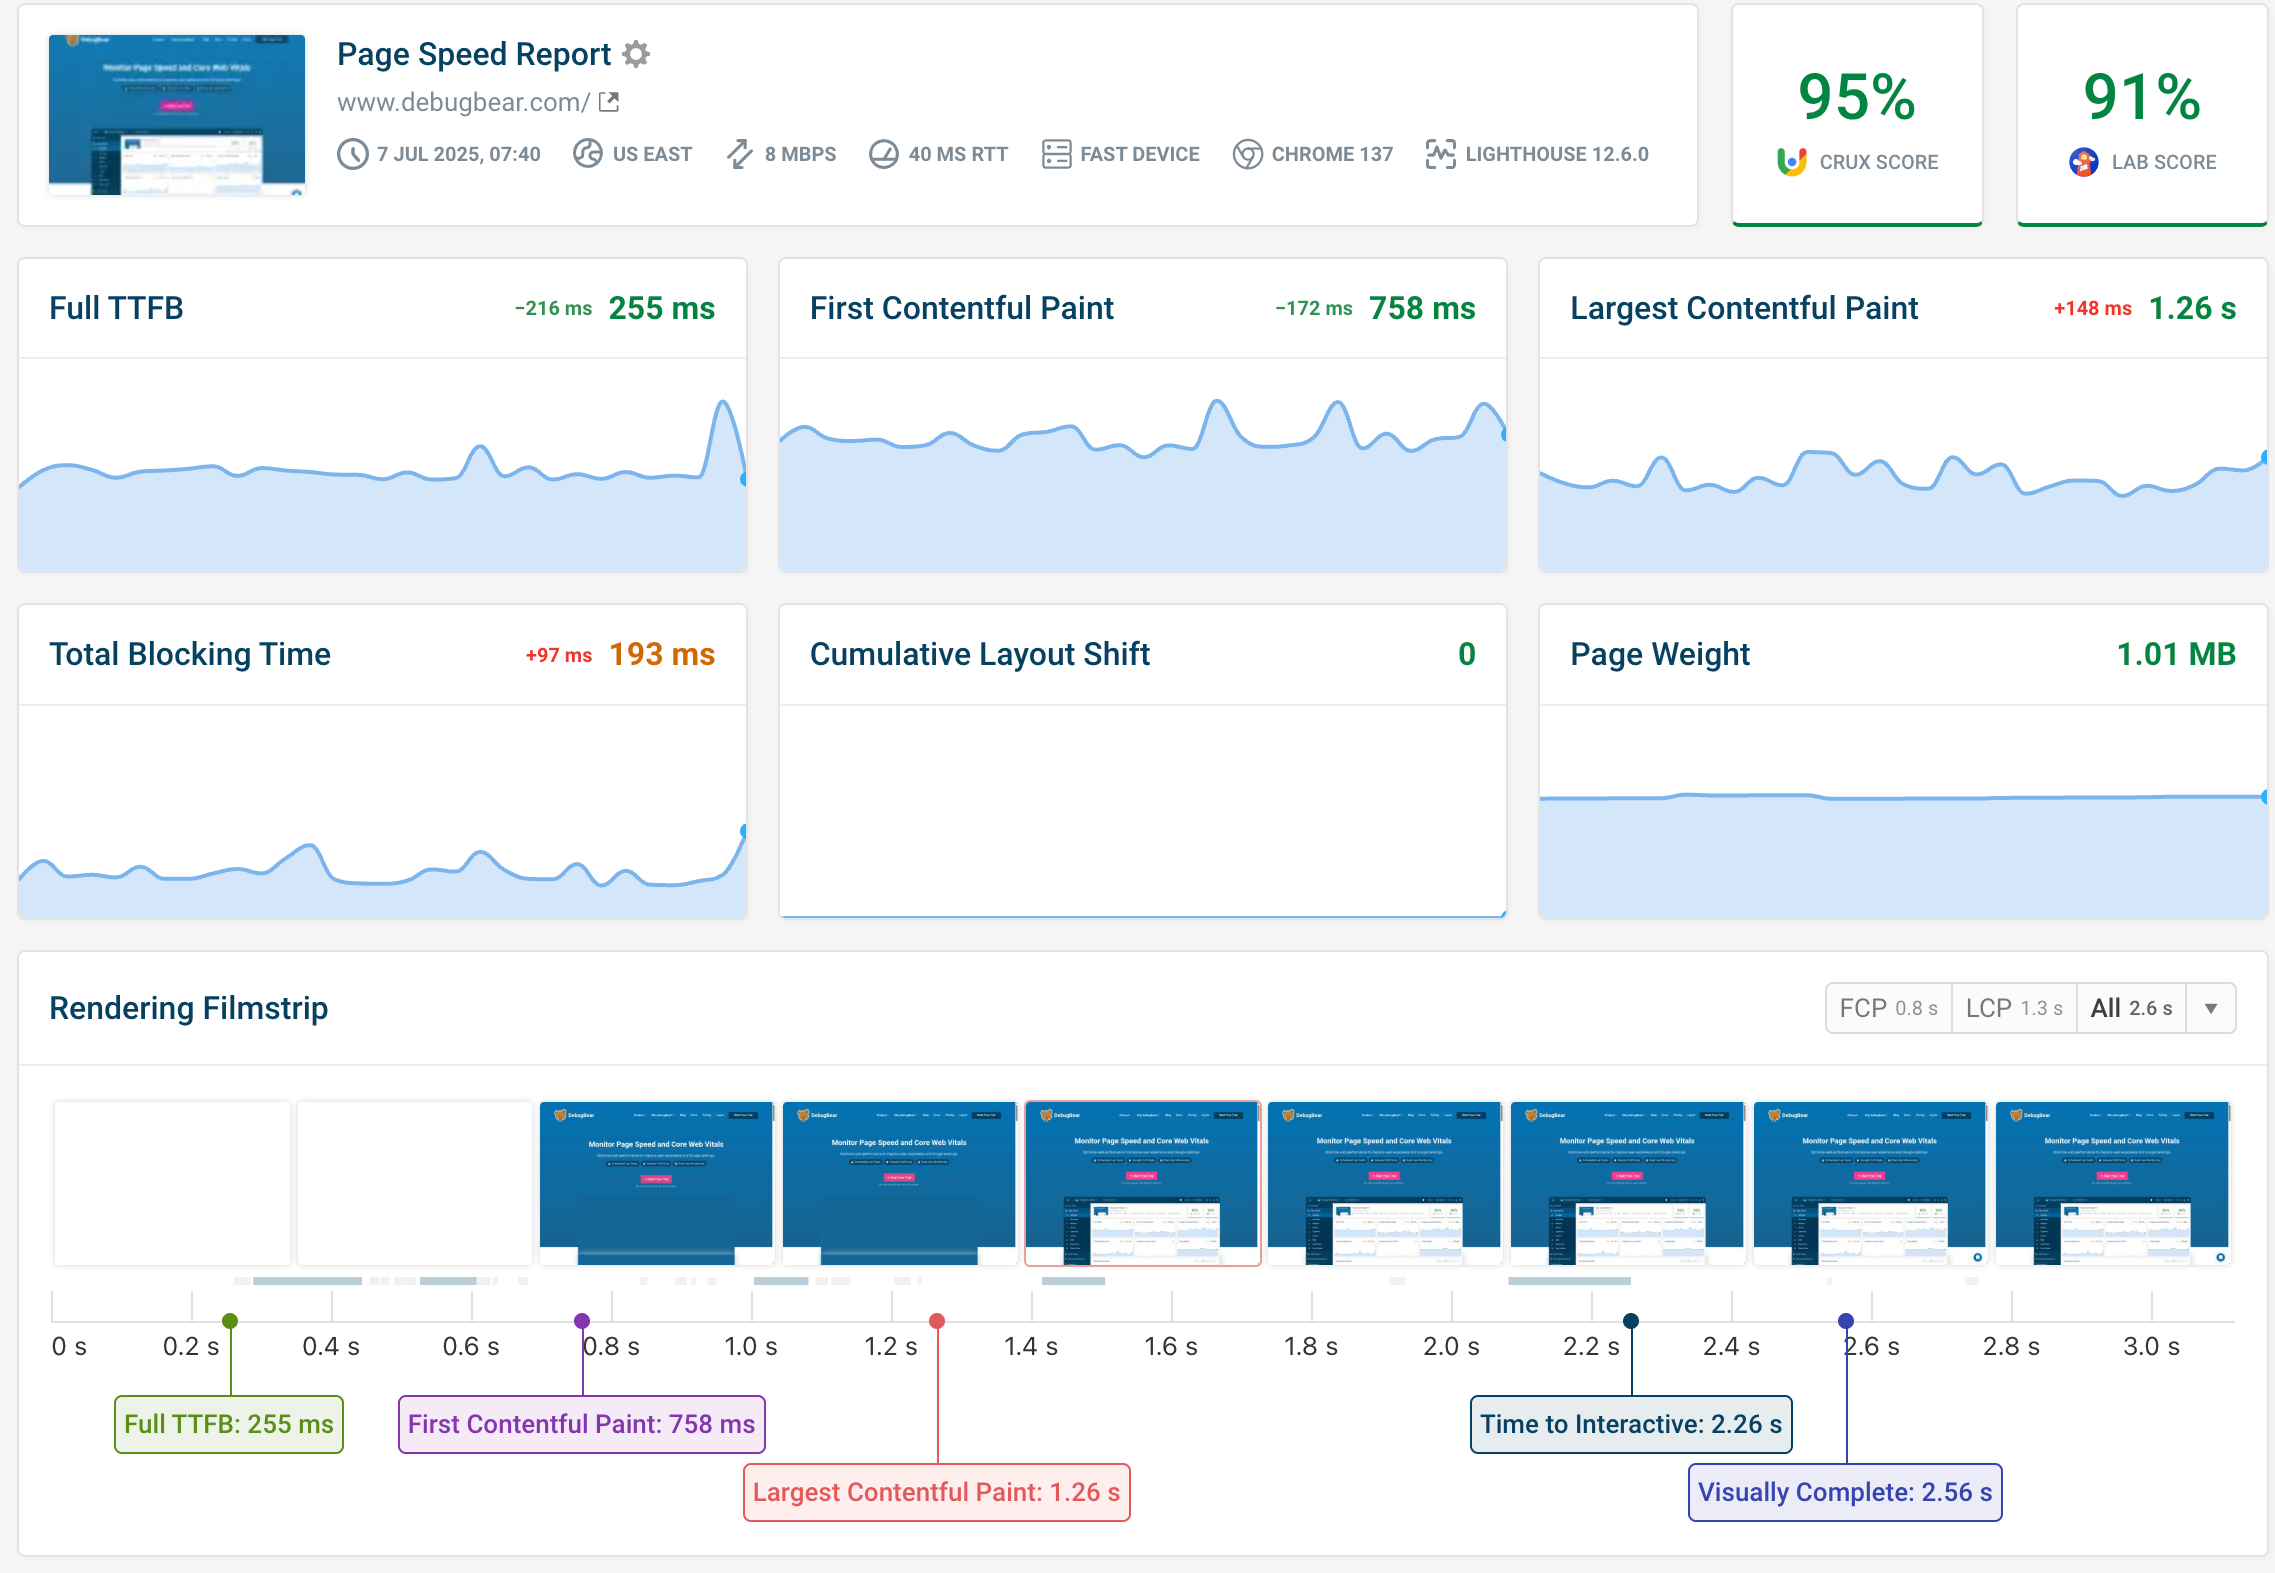
Scheduled synthetic tests provide additional page load time reporting along with detailed visualizations of every request a user's browser makes to render a page. This helps technical teams drill down into the precise issues that are slowing down your website.
Best of all, you can try it for free for 14 days, no credit card required!
Advantages of DebugBear
- All the detailed CrUX data on your site's pages, fresh from Google's API
- Dashboards let you easily track dozens of pages at once
- Real user monitoring gives you real-world data even for low-traffic pages that Google doesn't have data for
- Real-time testing reveals problems and bugs much faster than CrUX data (and before it has an SEO impact)
- Custom alerting system proactively flags up declines in performance
- Historical data trends, unlike other tools that only show current snapshots
- Detailed page loading analyses help you diagnose exactly what's slowing down your website
- The best choice for any team that needs in-depth performance data across their whole website
2. CrUX Vis: Google's new visualization tool
CrUX Vis is an alternative free tool from Google to explore your site's web vitals, which they're increasingly promoting as the preferred alternative to the old CrUX dashboard.
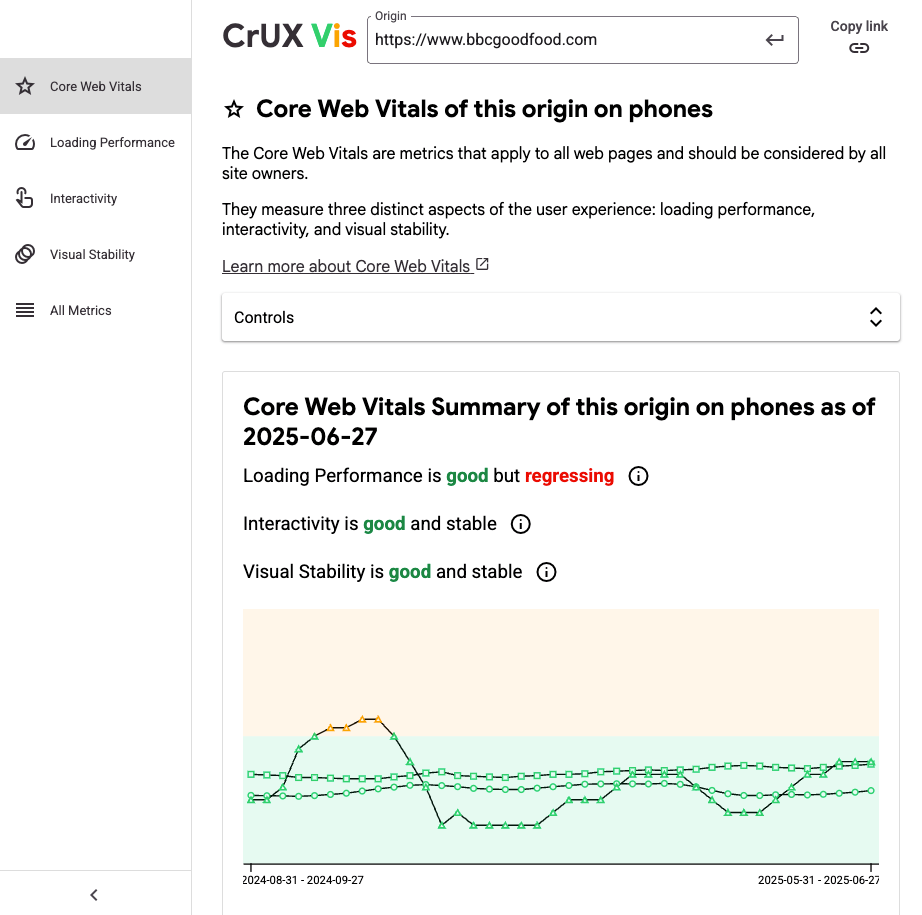
Compared to the CrUX dashboard, the data is more granular (with a new datapoint every 7 days, each representing the previous 28-day period).
The charts and descriptions make it easy to see how the metrics for any given URL are shifting over time – but the weekly breakdown can make it harder to see how your site is doing at a glance.
Like the CrUX dashboard itself, though, you can still only query one page at a time, making it somewhat underpowered if you need to manage a large website with many different page types.
Advantages of CrUX Vis
- Timeline stats: it's easier to view changes to your page's Core Web Vitals over time
- The new solution: this tool is likely to receive more updates in the future, compared to the legacy dashboard
- Supports URL-level data and LCP subparts
3. PageSpeed Insights
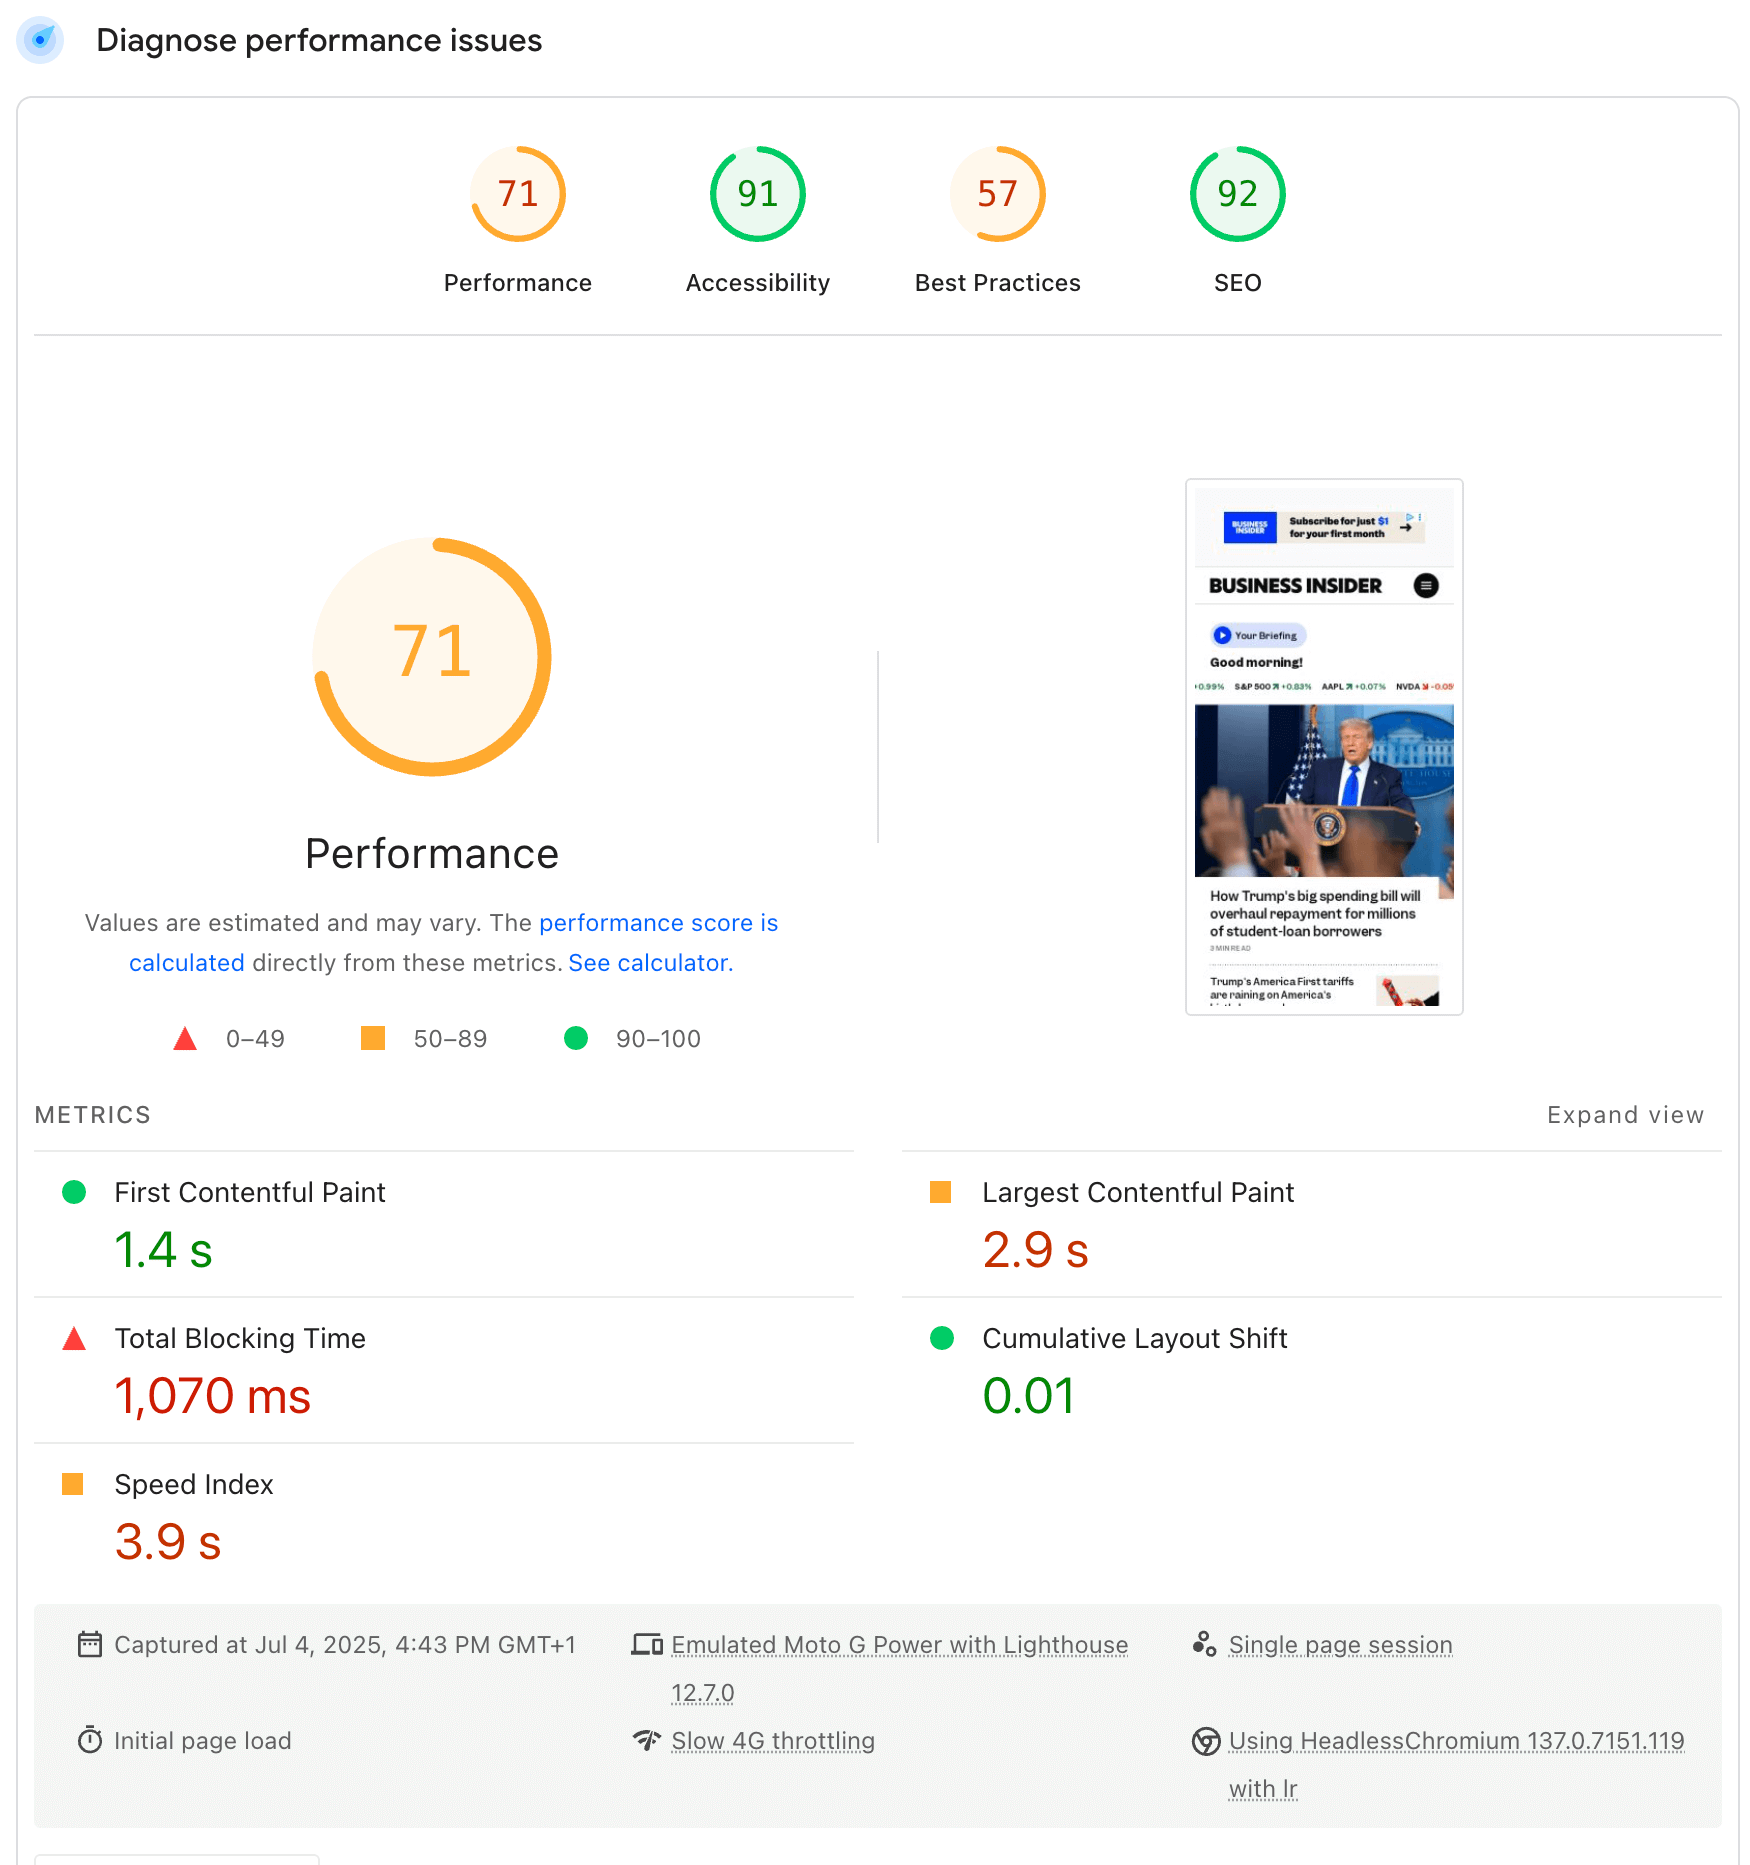
Another classic free tool from Google, PageSpeed Insights takes a deep dive into any URL, surfacing real-world CrUX data where available or running a synthetic or 'lab' speed test where it isn't. Not only does it reveal those all-important Core Web Vitals scores, it also looks at the structure of the page and associated resources to suggest how performance might be most meaningfully improved.
Advantages of PageSpeed Insights
- Offers a host of practical suggestions on how to speed up any URL
- Also covers issues that affect accessibility and SEO
4. General-purpose SEO tools
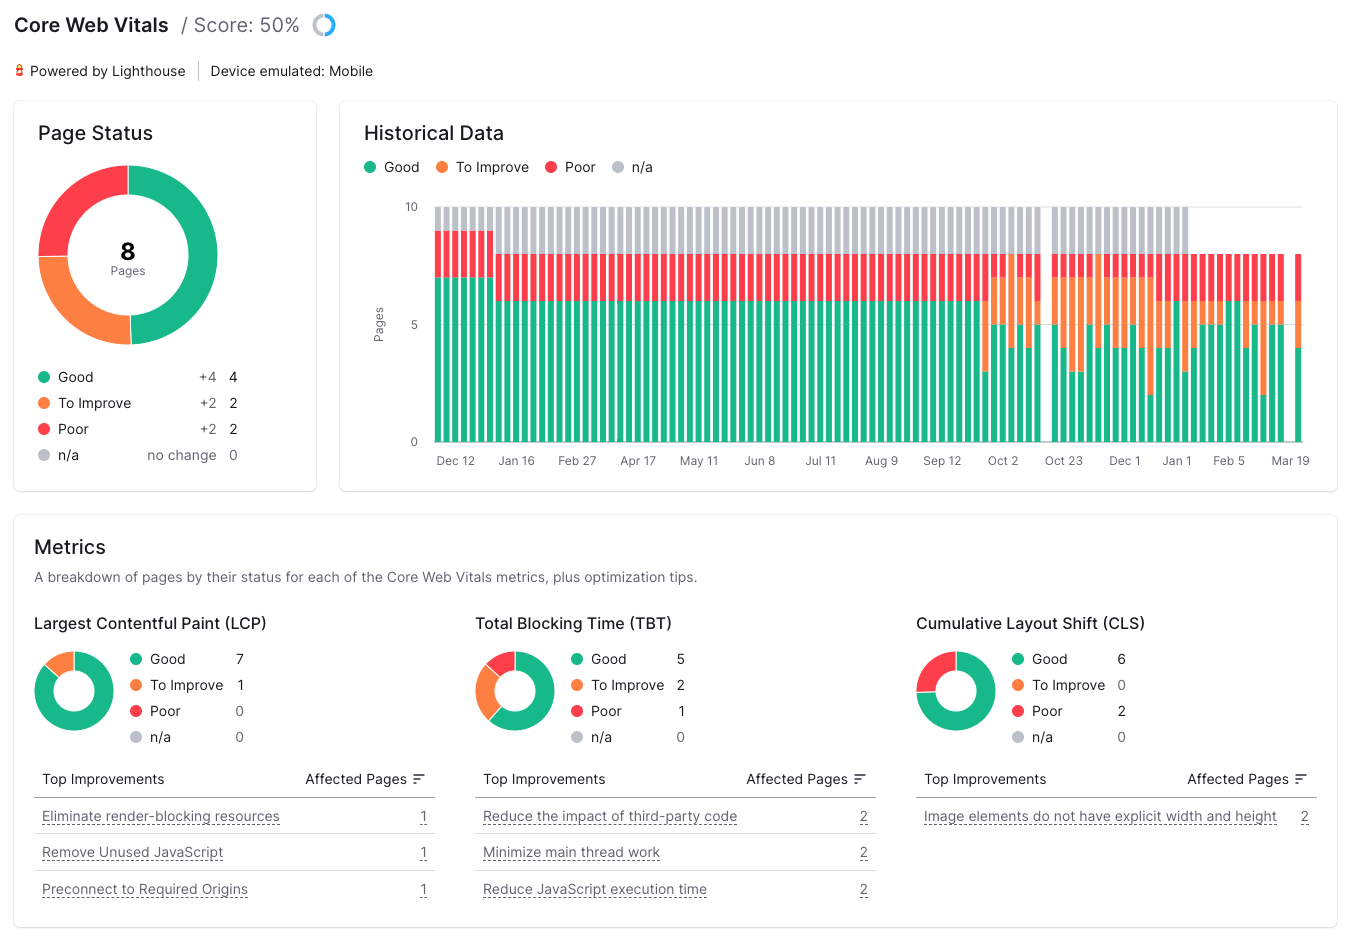
Because Google offers its huge repository of CrUX data via a public API, you might be able to access your site's CrUX data in a third-party service you already use. For example, both SEMrush and Ahrefs can include data on Core Web Vitals in their respective site audit tools.
These tools rarely offer the super-granular data on page loading that you might get from a performance-oriented tool like DebugBear, but they might help keep page speed top-of-mind for SEO and content folks.
Advantages of SEMrush/Ahrefs
- Data is accessible alongside other SEO data
- Could facilitate deeper analysis, such as how CrUX scores are impacting SERPs
In conclusion...
Thanks to Google's massive amounts of data from Chrome users, there are more ways than ever to keep an eye on your site's Core Web Vitals. While their free CrUX Dashboard has been an easy way to peek at how a website is performing overall, you can also find these metrics in other developer tools:
- CrUX Vis is great to get an overview for your site and how your stats are trending
- PageSpeed Insights combines real user data with concrete tips to make your site faster
- SEO tools often contain these metrics alongside other stats on search performance
But if you're keen to improve your website speed, consider an all-in-one web performance platform like DebugBear, that combines Google's CrUX data with custom lab speed tests and real user monitoring, to help you identify and fix performance issues as they occur.


Monitor Page Speed & Core Web Vitals
DebugBear monitoring includes:
- In-depth Page Speed Reports
- Automated Recommendations
- Real User Analytics Data