
If you're running a website or app, you know how crucial it is to keep your users happy. But you can't improve what you don't measure. That's where digital experience monitoring tools come in, and they're important platforms for understanding how your users actually interact with your digital products.
Digital experience monitoring is all about caring about every single user who visits your site, and automatically checking they're having the experience you want them to have, without bothering them or asking endless survey questions.
What is Digital Experience Monitoring?
Digital experience monitoring (DEM) is your way of keeping tabs on how people use your websites, apps, and digital services. You can continuously track uptime, traffic levels, and the quality of the experience your end users are actually having.
A solid DEM strategy means tracking things like how fast your pages load, where users get stuck, what makes them frustrated, and what keeps them engaged.
You'll want to monitor technical performance issues (like slow loading times) alongside user behavior patterns (like where people click and how they navigate). This combination helps you and your team make smarter decisions about where to focus your optimization efforts.
The building blocks of Digital Experience Monitoring
Let's take a look at what data digital experience monitoring tools collect and how it matters to end user experience.
Understanding your users' real experience
The heart of digital experience monitoring is figuring out what your users actually experience when they visit your site. Are your pages loading quickly for them? Or are they getting frustrated and leaving?
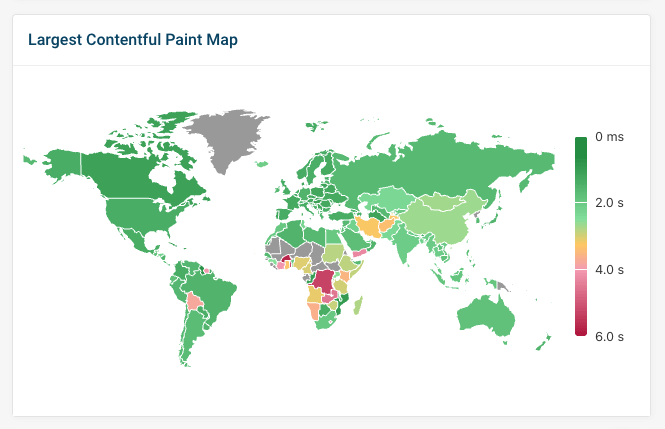
To do this, you need to collect data from real interactions. You want to know if someone in Australia has a different experience than someone in New York, or if mobile users are struggling more than desktop users.
Two ways to monitor: real users vs synthetic tests
There are two main approaches to gathering this data, and both are valuable:
Real User Monitoring (RUM) collects data from actual visitors as they use your site. It's like having a camera crew following every user around, except they don't know they're being watched. You get authentic insights into how your site performs under real-world conditions.
Synthetic monitoring is more like running rehearsals. You simulate user interactions such as loading pages in different environments, on-demand, to get consistent baseline measurements. This approach is perfect for catching problems before real users encounter them.
At DebugBear, we proudly offer both.
Core Web Vitals: Google's report card
Google has given us a pretty clear rubric for what makes a good user experience through something called Core Web Vitals. These are three key metrics that Google actually uses to help rank websites:
- Largest Contentful Paint (LCP) - How fast your main content loads
- Interaction to Next Paint (INP) - How quickly your site responds when users interact with it
- Cumulative Layout Shift (CLS) - Whether your page jumps around while loading
Unlike traditional performance metrics, the web vitals don't focus on technical page load milestones. Instead, they look at how quickly the user can see important content or what delays they experience when interacting with the page.
Why you should implement Digital Experience Monitoring
Monitoring user experience in your digital products lets you catch issues and optimize your website, helping you stay ahead of the competition. It also ensures that you'll get alerted when new issues arise.
Happy users = better business
When users have a better experience on your site, they're more likely to stick around, buy something, or visit again in the future.
By monitoring the digital experience you offer in real-time, you can spot problems before they become expensive mistakes. Maybe you'll discover that a slow checkout process is costing you sales, or that a huge hero image is affecting your SEO.
Staying ahead of the competition
Your competitors are probably already monitoring their digital experiences. If you're not, you're essentially flying blind while they're using GPS. Monitoring tools help you benchmark against your rivals and see how you compare.
Catching problems early
Instead of waiting for angry customer emails or support tickets, monitoring tools act like an early warning system. They can alert you to performance issues before they impact a significant number of users. Setting up your own monitoring with DebugBear reveals slowdowns right away, whereas Google's Chrome User Experience Report (CrUX) only slowly reflects issues over a 28-day period.
What to look for in a Digital Experience Monitoring tool
- Comprehensive data collection: You'll want a set of tools that can track a wide variety of metrics covering different aspects of user experience. The more data points you can collect, the better you'll understand what's really happening on your site.
- Clear, actionable insights: Raw data is pretty useless if you can't understand what it means. Look for tools that not only show you what's happening but also explain why it matters and what you should do about it.
- Smart alerting: You don't want to be bombarded with notifications every time something minor happens. Good monitoring tools are smart about when to alert you.
- Easy collaboration: Digital experience optimization works best when the whole team is involved. You need tools that make it easy to share insights with your team and work together on solutions.
How we approach Digital Experience Monitoring at DebugBear
At DebugBear, we've built our platform specifically to help teams monitor their Core Web Vitals and overall website performance. Here's how we think about solving these challenges:
Focused on key metrics
We're laser-focused on the metrics that actually impact your users and search rankings. Our platform helps you optimize website speed and your Core Web Vitals scores to get more organic traffic, because we know that's often the biggest lever you can pull for better business results.
Detailed visitor insights
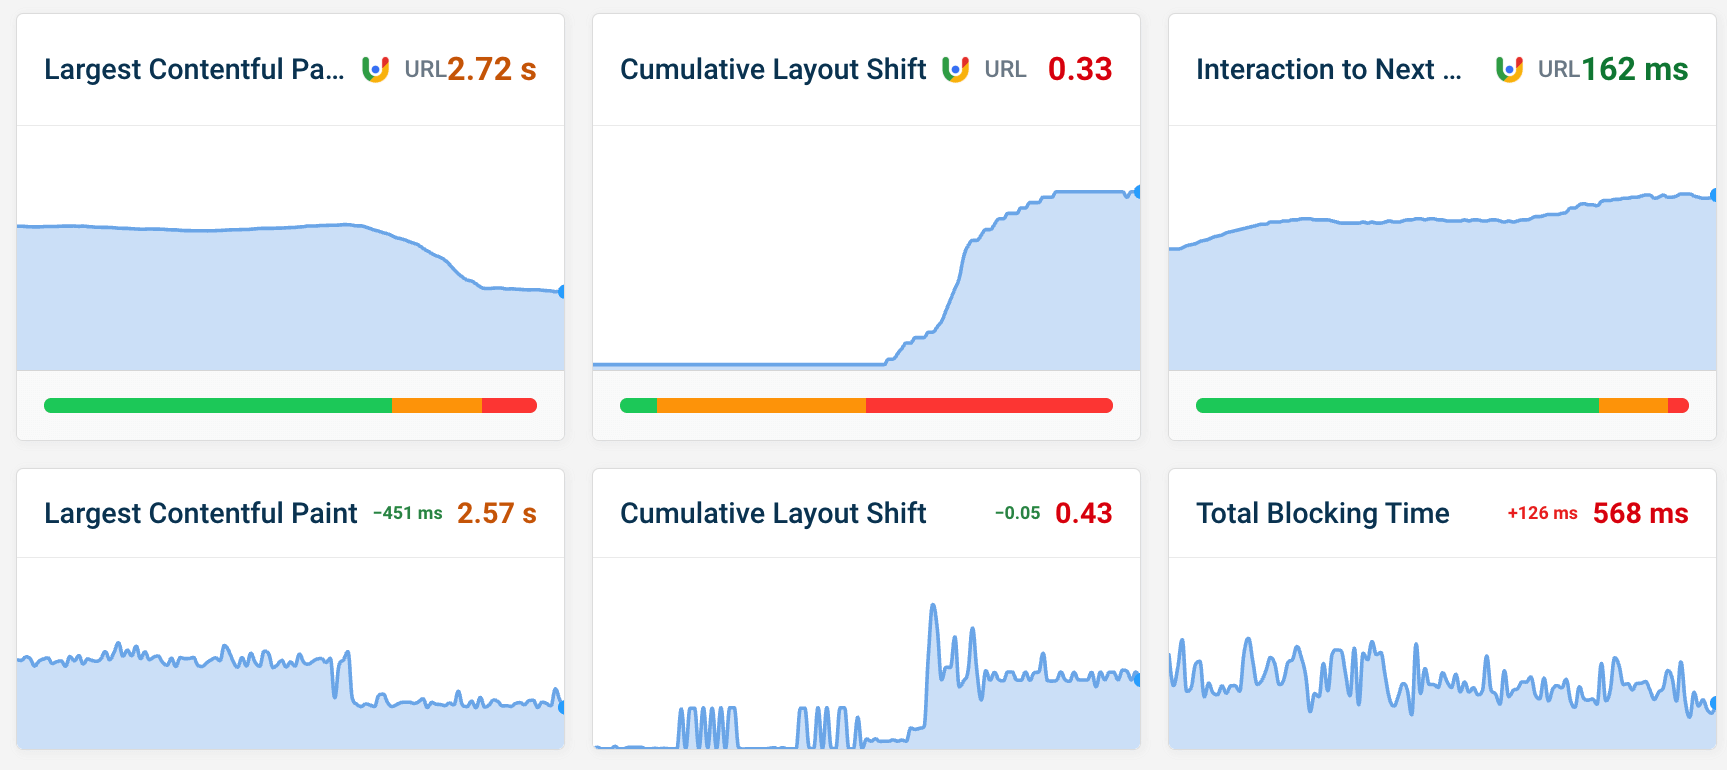
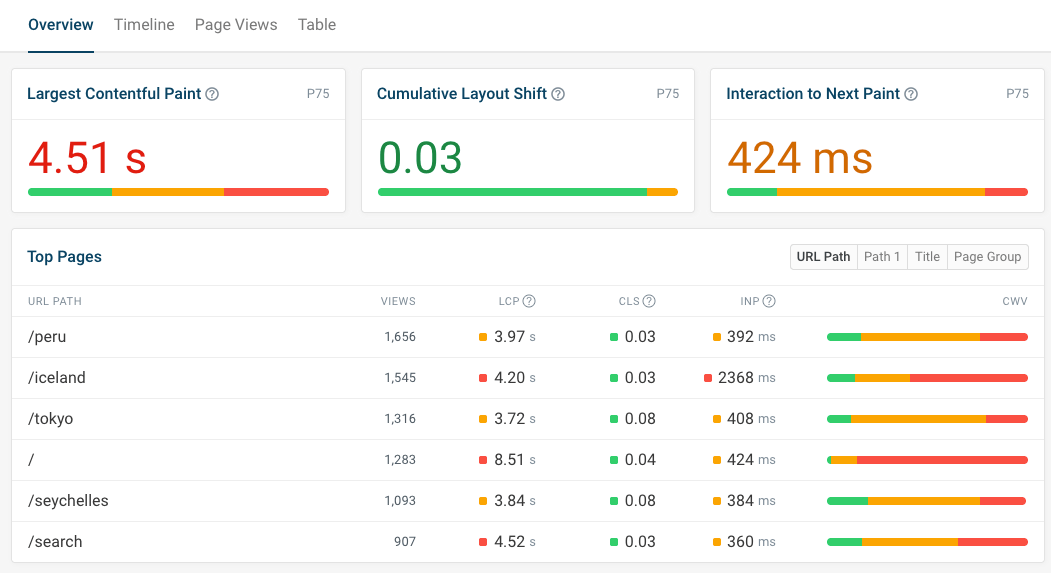
DebugBear gives you detailed insights into Core Web Vitals and other performance metrics.
You can see how digital experience varies across different pages, device types, and usage scenarios. Unlike with synthetic tests, real user monitoring shows you the full distribution of visitor experiences, so you can identify specific segments of users who might be having a worse experience than others.
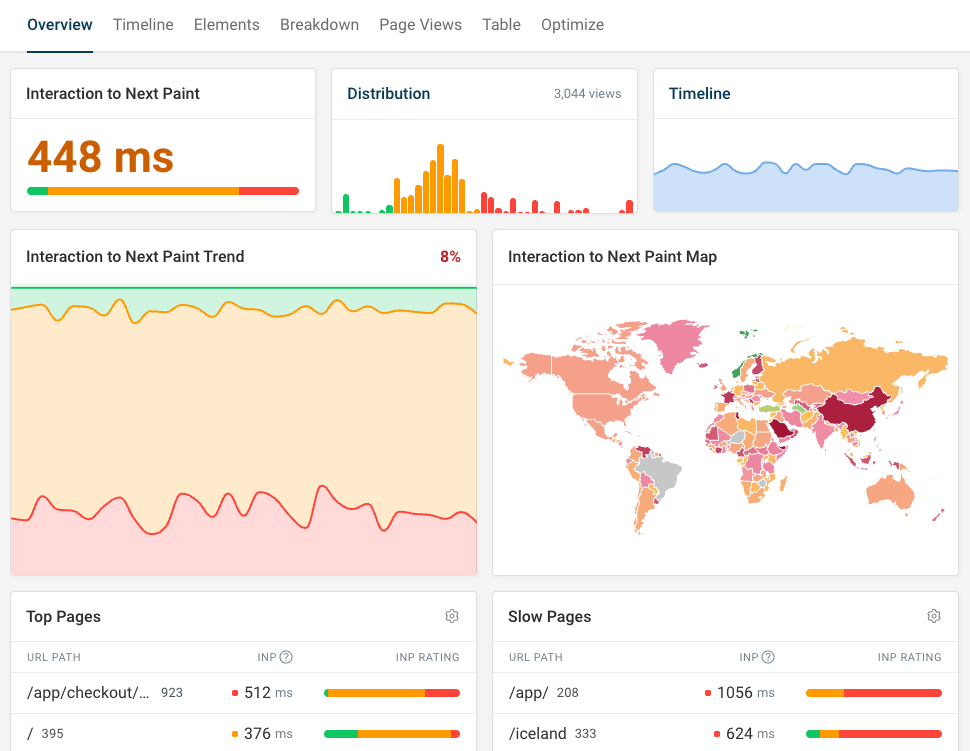
From this high-level view you can then deep dive into specific page visits. How did the user navigate through the page? What delayed the page load? What scripts were responsible for slow interactions?
This data gives your development team the insights they need to fix performance issues on your website.
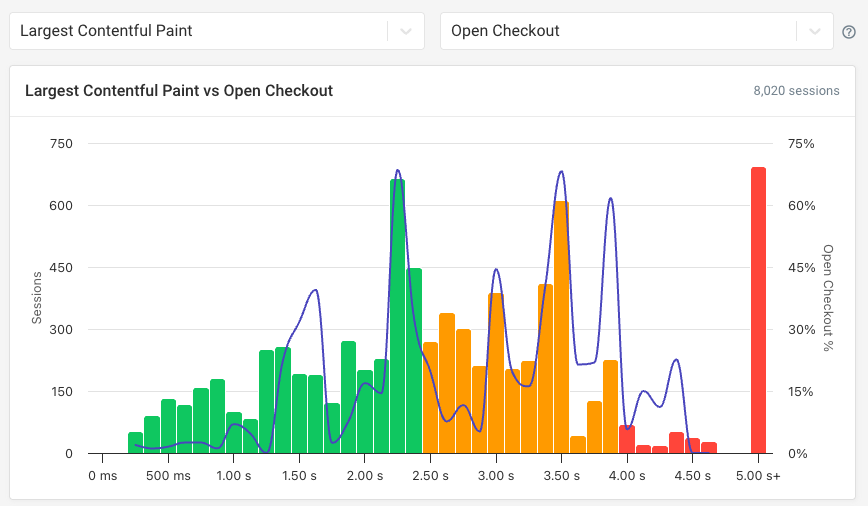
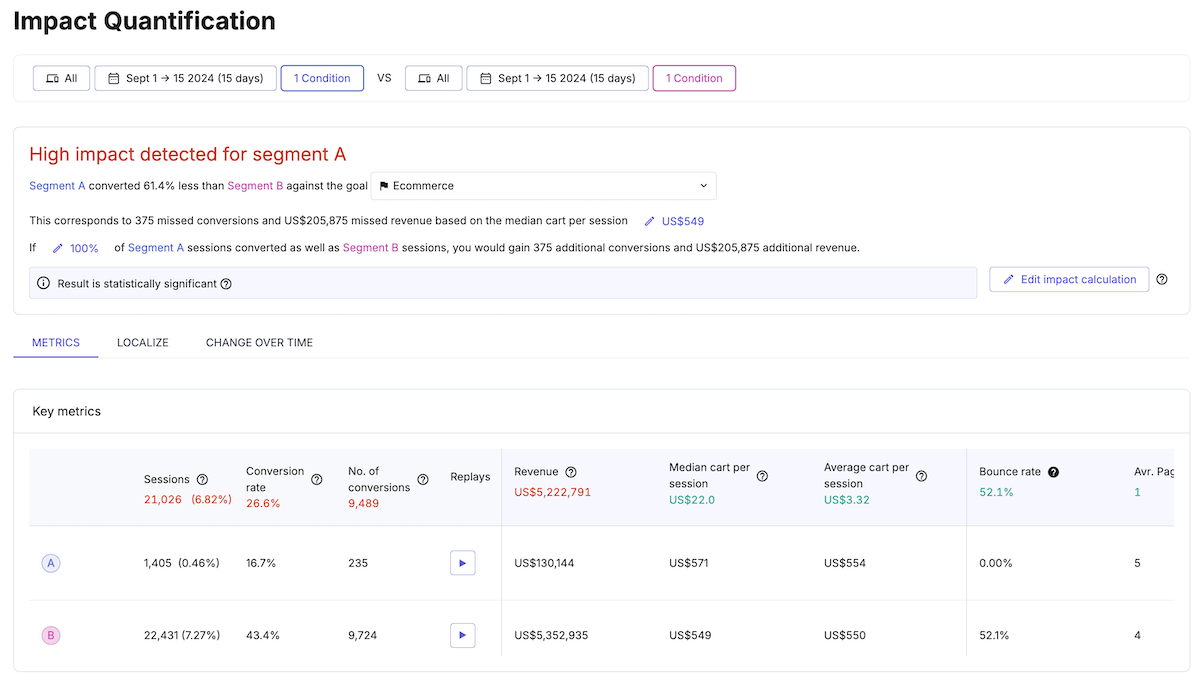
You can also see how performance correlates with bounce and conversion rates. This way you can see where optimizing Core Web Vitals makes a difference to your business, and prioritize optimizations accordingly.
Global testing for international businesses
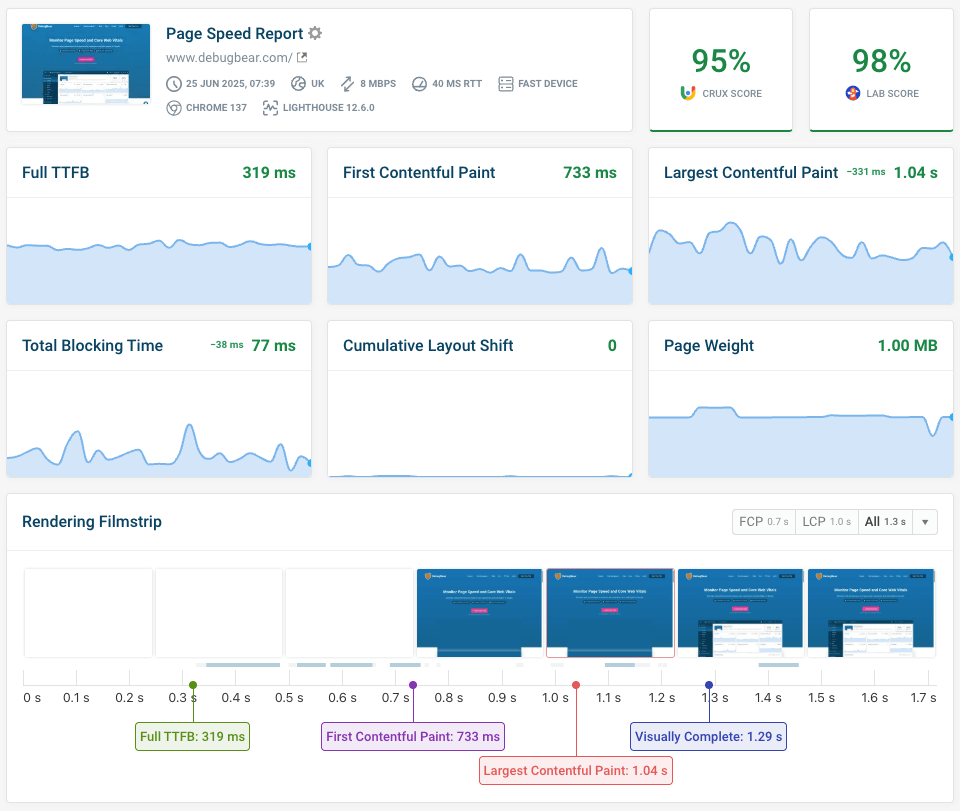
We run front-end performance tests by loading your whole page in the browser on a realistic connection and generating in-depth reports. This way you'll get scores for overall website performance as well as diagnostic data to help you improve user experience.
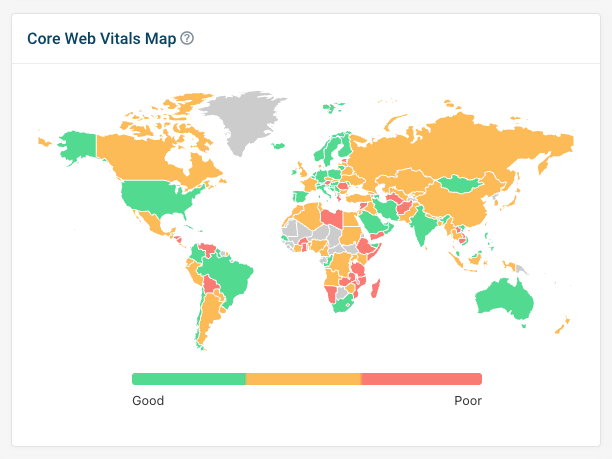
You can monitor your website from over 30 global locations, and configure custom network speeds for mobile and desktop devices. This global perspective is crucial because, although it's tempting to test your website on your office's lightning-fast fiber connection, users in other parts of the world can have vastly different experiences. With DebugBear, you can make sure your lab test results are a close fit for the location, device and network speed your customers most frequently connect with.
Visual debugging that makes sense
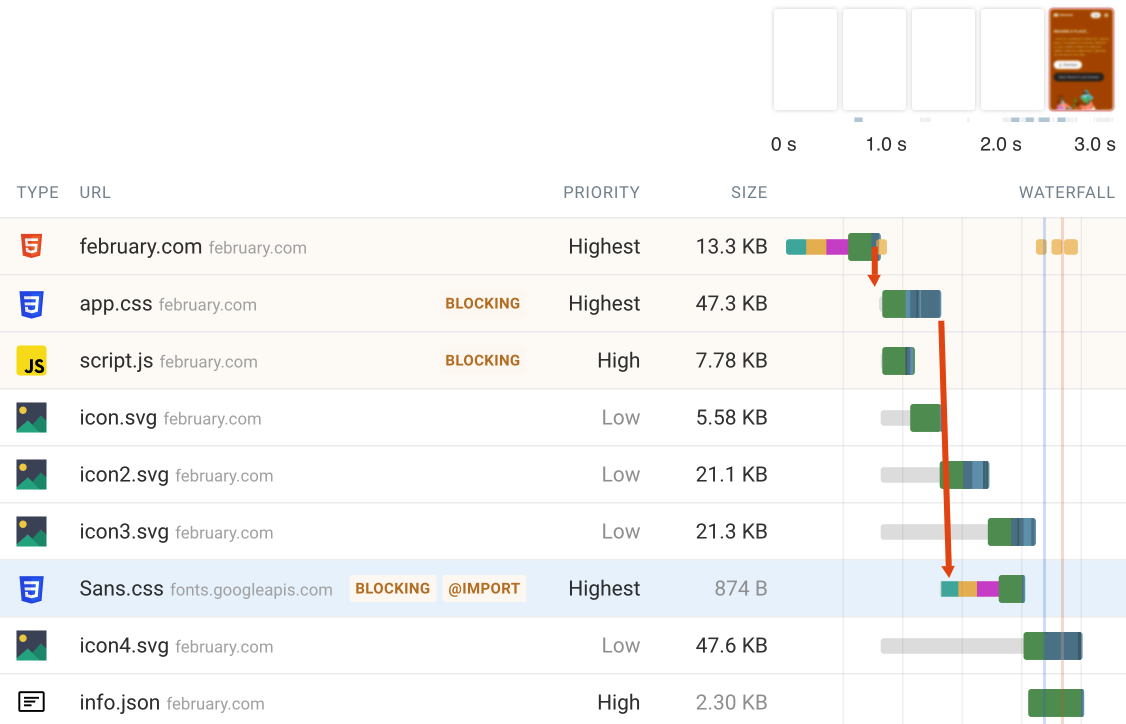
We feature detailed waterfall views of network requests, which are vital for debugging website performance issues. You can visually correlate what resources are loading with what users actually see on their screens, making it much easier to identify bottlenecks.
Real user web vitals monitoring
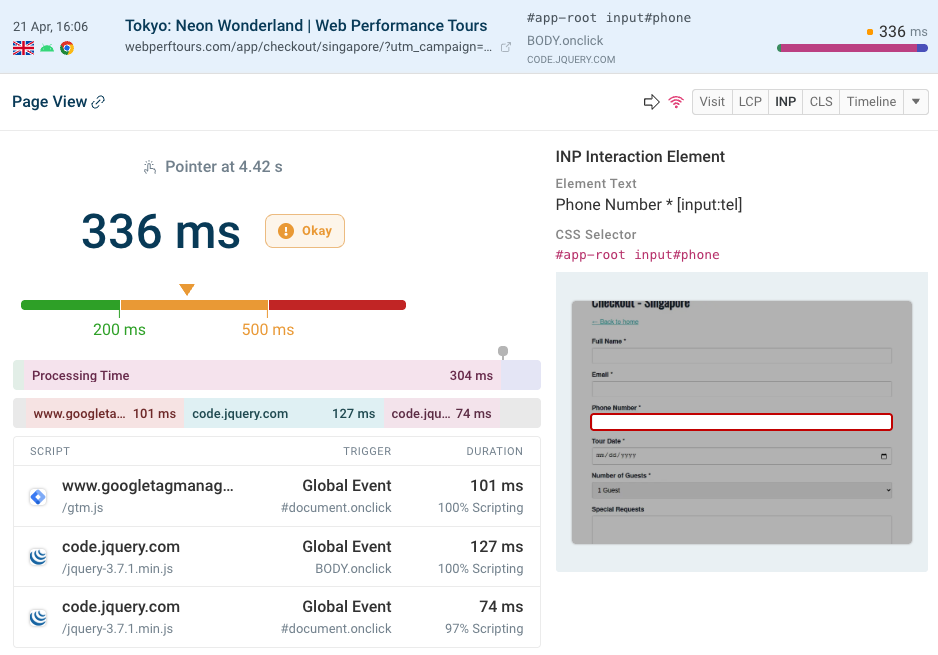
Our real user monitoring is built specifically for Core Web Vitals debugging, helping you identify poorly performing pages and what's slowing them down. When users have slow interactions, we tell you exactly which scripts are causing the delays.
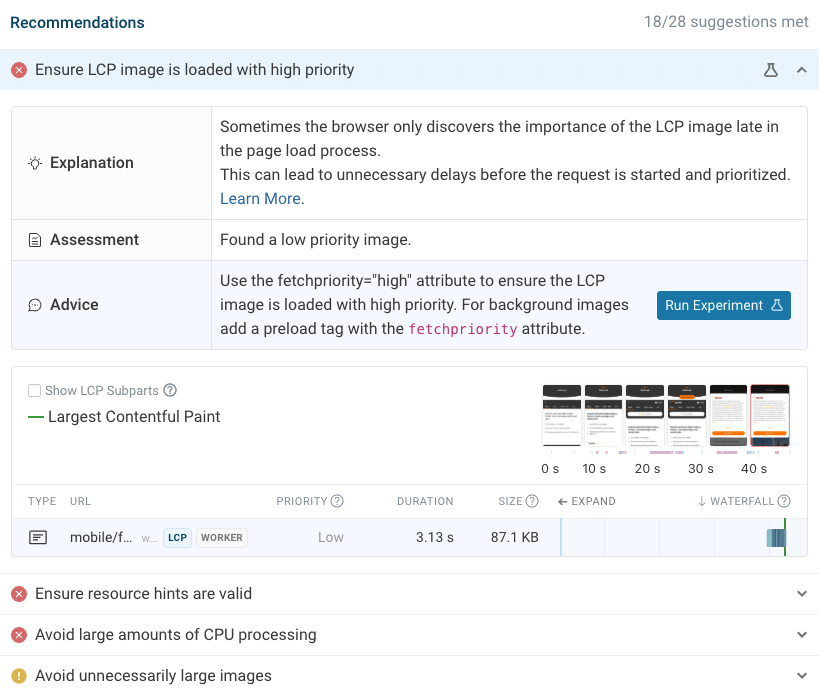
Actionable recommendations, not just data
Our custom recommendations are based on an analysis of your website, and in many cases you can even run automated experiments to test changes without deploying code to production. This means you can validate optimizations before committing development resources.
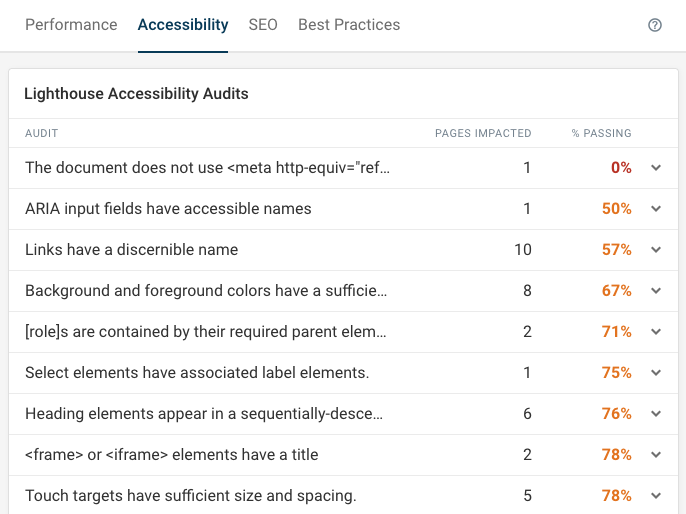
The audits view lets you identify the most common performance, accessibility, and SEO issues across your website.
Fixing problems that apply across many pages means you can deliver a big improvement in user experience with just a few changes.
Competitive intelligence
You can use synthetic tests and Google CrUX data to see how you compare to other players in your industry. Knowing where you stand relative to competitors helps you prioritize your optimization efforts.
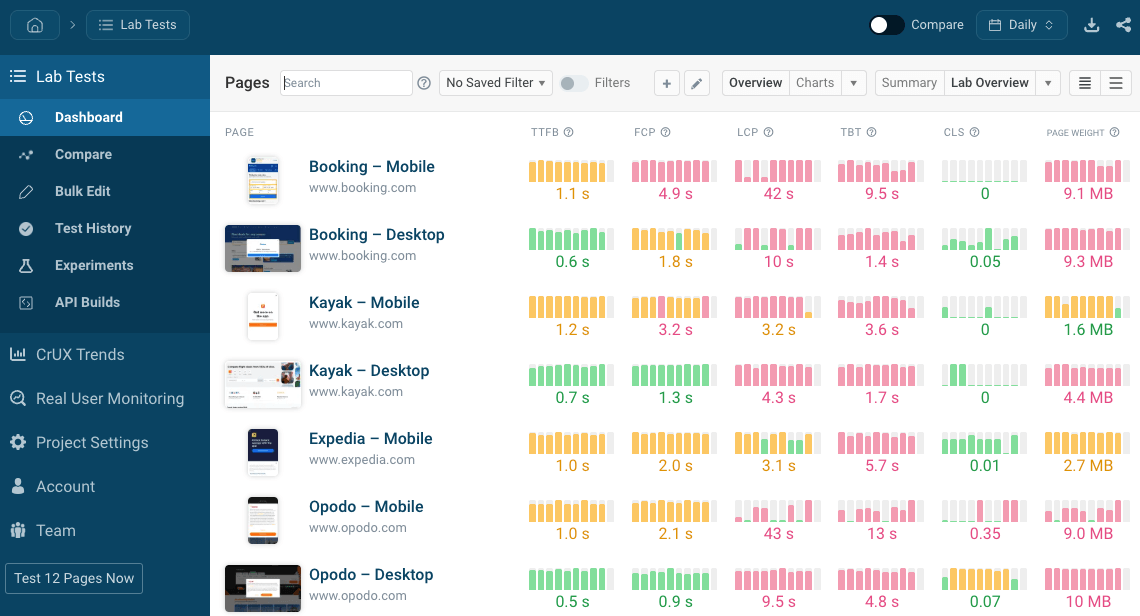
DebugBear makes it easy to create industry dashboards based on real user data from Google.
See how your website compares, and how different competitors are trending over time.
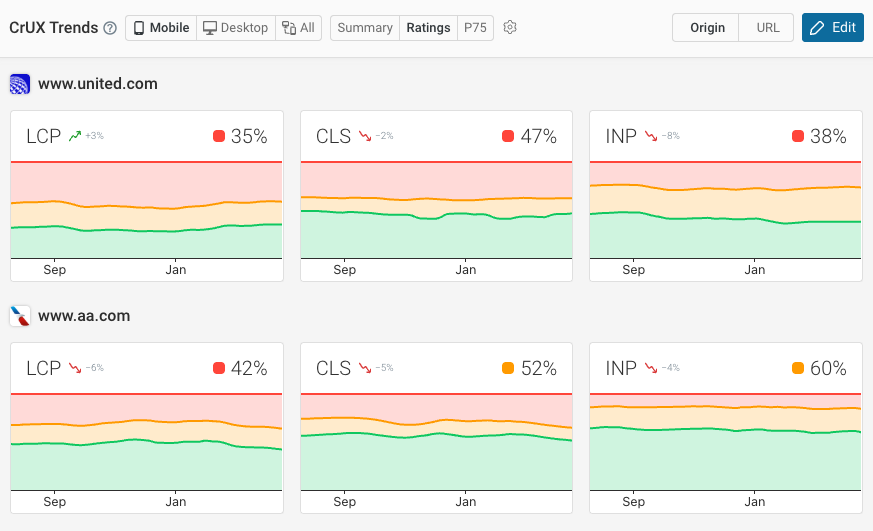
Check out our collection of pre-built industry dashboards for a number of industries.
Enterprise and specialized monitoring solutions
While we focus on web performance optimization, there are times when you might need broader monitoring capabilities or specialized features for specific use cases. Here are some alternatives worth considering:
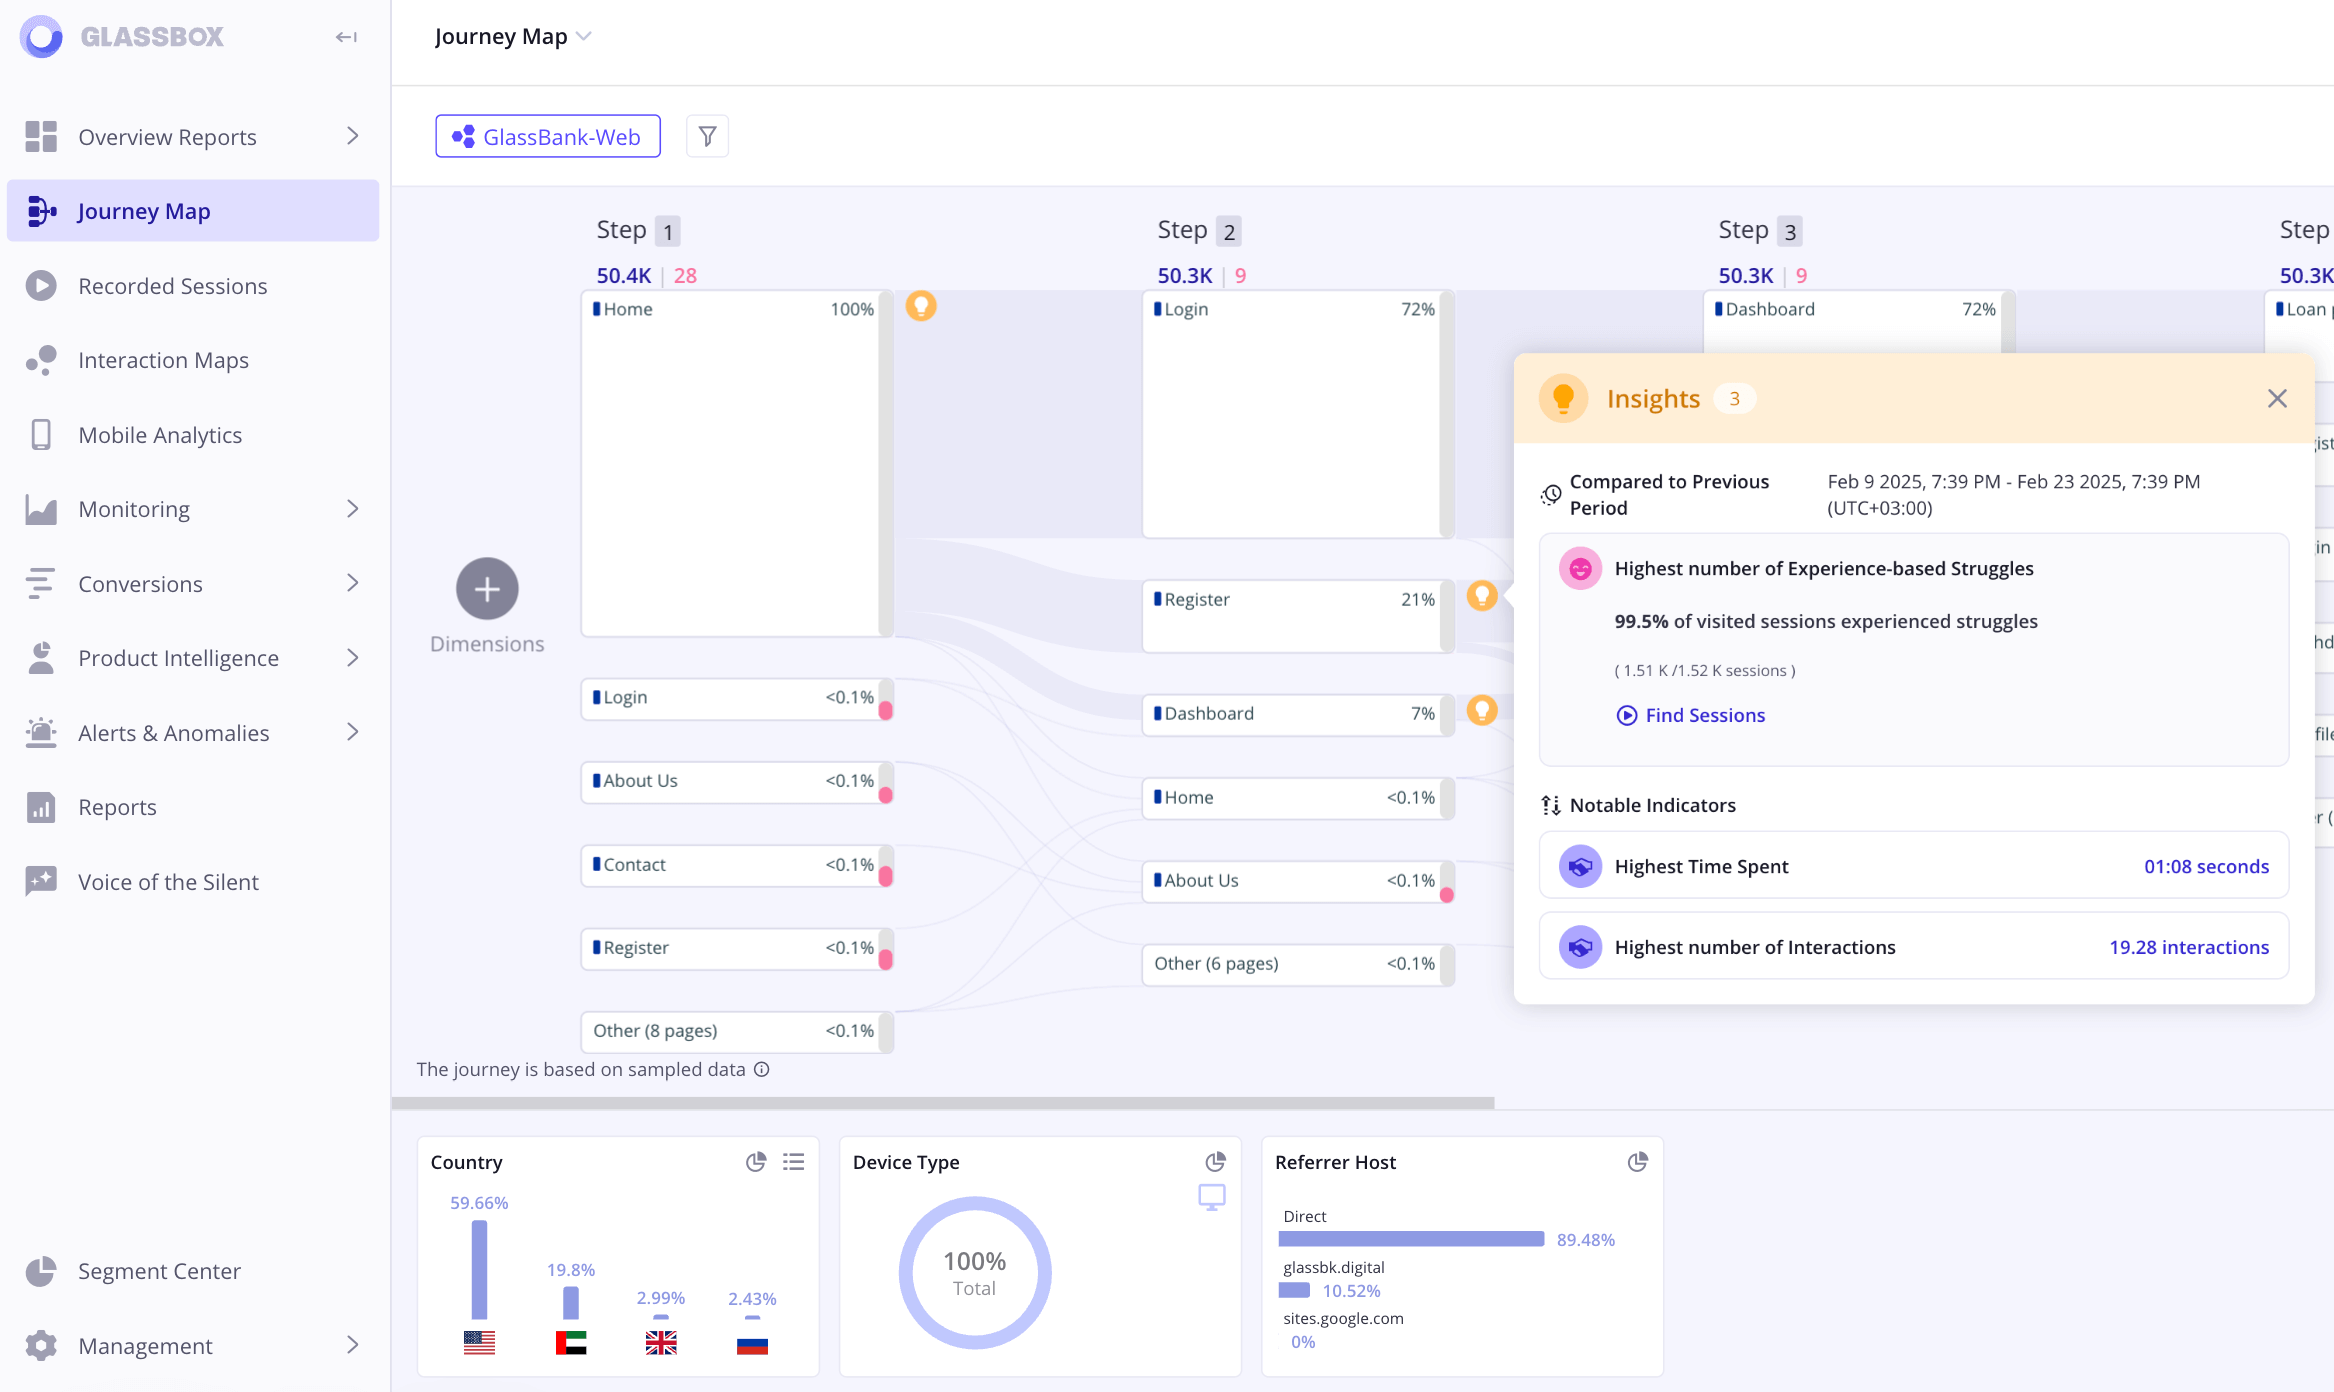
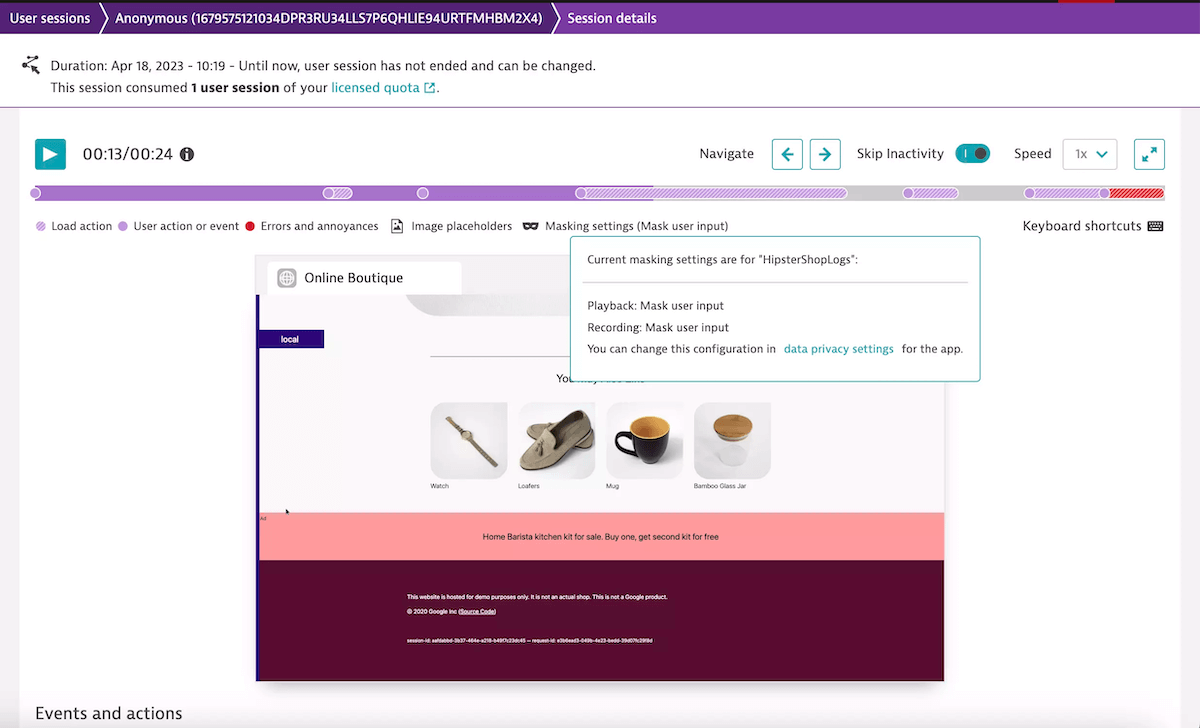
Glassbox: for comprehensive enterprise analytics
Glassbox is designed for regulated industries including Financial Services, Insurance, Government, Telecom, Airlines, and Utilities. If you're in a highly regulated environment or need comprehensive session recording capabilities, Glassbox might be a better fit.
They capture 100% of user interactions and map them across your website and mobile app with no manual tagging required. This is particularly valuable for large enterprises that need complete visibility into complex user journeys across multiple touchpoints, or fraud detection features.
Dynatrace: for full-stack Application Performance Monitoring (APM) and infrastructure
Dynatrace provides AI-driven, automated, frontend-to-backend digital experience monitoring and is particularly strong for organizations that need comprehensive application performance monitoring beyond just web performance.
Dynatrace maps your entire IT environment, from user interactions to backend databases, and spots potential problems before they affect customers. If you're managing complex infrastructure with microservices, containers, and multiple cloud providers, Dynatrace might offer the depth you need. It's a strong choice for DevOps teams who need to monitor both performance and security across complex technology stacks.
Contentsquare: for advanced UX analytics
Contentsquare's AI-powered platform includes user journey mapping, zone-based heatmaps, session replay, and AI-powered recommendations. They also connect journeys across multiple sessions, channels, and devices, whether from anonymous or known visitors. This cross-session tracking is valuable for content-heavy businesses handling complex customer journeys that span multiple touchpoints.
Getting started with Digital Experience Monitoring
Focus on your most important pages
You don't need to monitor everything at once. Begin with your homepage, key landing pages, and conversion funnels. These are the pages that matter most to your business, so focus your initial efforts there.
Set up both synthetic and real-user monitoring
A combined approach using both synthetic monitoring and RUM is most effective. Use synthetic monitoring to catch regressions early and validate optimizations, while leveraging real user monitoring to understand how actual users experience your application.
Establish performance budgets
Once you have baseline measurements, set performance budgets that define acceptable thresholds for key metrics. These act as guardrails for your development team and help maintain performance standards as your site evolves.
Make data accessible to your team
Digital experience monitoring isn't just for developers. Make sure your marketing, product, and business teams can access and understand the data. The best optimizations often come from cross-functional collaboration. (DebugBear offers seats for 10 users on our Startup plan, or up to 50 users on our Team plan.)
Embedding Digital Experience Monitoring in your culture
Integrate monitoring into your workflow
The most successful teams treat performance monitoring as part of their regular development process, not an afterthought. With DebugBear, you can integrate our tool into GitHub or Vercel to automatically test deployments for performance before they go into production. Plus, you can set up alerts that notify you when performance degrades.
Connect improved performance to business wins
Help your team understand how performance improvements translate to business results. When you can show that a faster loading time led to more conversions or better search rankings, performance optimization becomes a business priority, not just a technical nice-to-have.
Celebrate wins and learn from problems
When you achieve performance improvements, share the success with your team and stakeholders. Our tool lets you create shareable links to performance reports for your colleagues who haven't signed up, or automatically export data to include in your own internal dashboards. When issues arise, use them as learning opportunities to improve your monitoring and response processes.
Conclusion
Digital experience monitoring is about seeing your product through your users' eyes so you can give them a smoother, snappier experience. Whether you choose our platform at DebugBear for web performance optimization, or one of the more comprehensive enterprise solutions, the important thing is to start measuring and improving.
Your users might not always tell you when they're frustrated with your site, but they'll definitely show you through their behavior. Digital experience monitoring gives you the insights to see what they're really experiencing and the tools to make it better.


Monitor Page Speed & Core Web Vitals
DebugBear monitoring includes:
- In-depth Page Speed Reports
- Automated Recommendations
- Real User Analytics Data