
Google's Interaction to Next Paint (INP) metric measures how quickly a website responds to user input. In this article we'll discuss how INP can vary depending on the loading progress of the website.
How does the loading progress of a website impact Interaction to Next Paint?
INP considers user interactions through the lifetime of a page. With DebugBear RUM we can break the website loading process into 4 stages and see how INP varies:
- Starting: The earliest page interactions while the browser is parsing the document HTML, running inline scripts, and rendering the page.
- DOMContentLoaded: Interactions after the document has been parsed but before other resources like images or
asyncscripts have been loaded. - Loaded: Interactions after the page load event has fired.
- 5s+ After Loaded: Interactions after the initial load of the page. We add 5 seconds to account for data loading and rendering that happens after the initial set of website scripts are loaded.
You'll often find that interactions that happen during the early loading stages of a page are slower than ones that happen later.
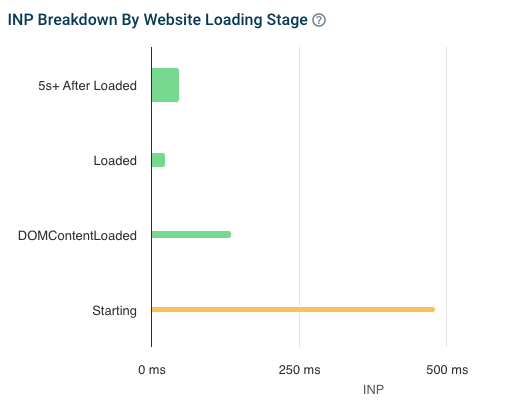
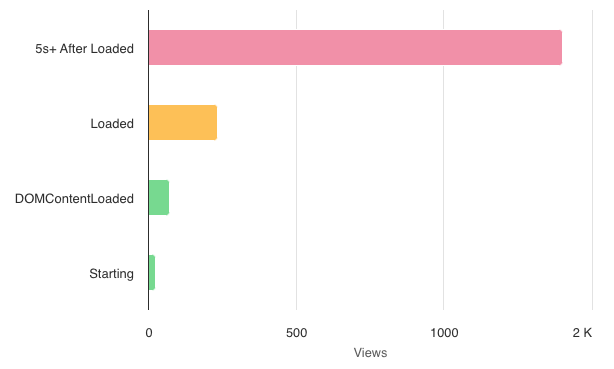
In addition to showing the INP value, this chart also uses the height of the bars to indicate the frequency of interactions during each loading stage. While interactions during the "Starting" stage are the slowest, they are also fairly rare.
Why is INP often higher during the initial loading stages of a website?
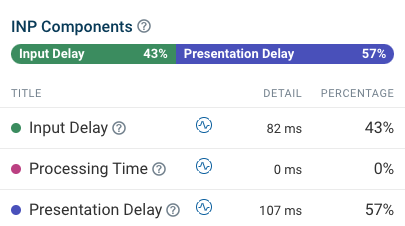
To understand what causes high INP during the initial load we can look at the INP component breakdown. We can see that processing time handling the user interaction is not actually contributing very much to the overall INP score.
Instead, running website code and third-party scripts is causing Input Delay. When the browser main thread is busy running these scripts it needs to delay handling the event.
As parts of the page are still rendering there's also a large Presentation Delay component as the browser needs time to render the page.
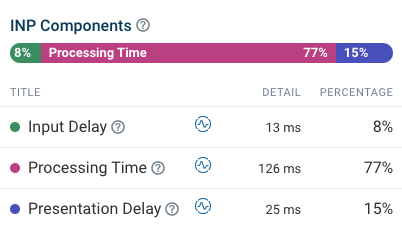
In contrast, if we look at only the latest stage we can see that background activity and rendering are not slowing down the interaction very much. Instead, actually processing the input event is what's delaying the next render of the page.
Use real user data to understand INP on your website
Interaction to Next Paint can be tricky to improve, as you need to know what page elements users are interacting with and what code is causing delays. A real user monitoring (RUM) service like DebugBear RUM can provide this data to you. Sign up for a free 14-day trial!


Monitor Page Speed & Core Web Vitals
DebugBear monitoring includes:
- In-depth Page Speed Reports
- Automated Recommendations
- Real User Analytics Data