
How fast is the average website, and how much does website speed vary? Are websites getting faster? And where in the world do pages load faster or slower?
This report looks into these questions based on the Google CrUX dataset which collects page speed data for millions of websites from real Chrome users.
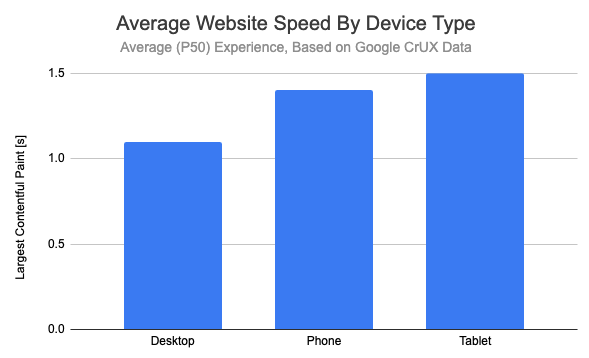
How long does it take to show the main page content?
The average website takes 1.3 seconds to load the main page content for an average visit. To measure this we’re using the Largest Contentful Paint (LCP) metric which identifies how soon after opening a page the largest content element becomes visible.
Desktop sites load faster with 1.1 seconds compared to mobile website visits with an LCP load time of 1.4 seconds.
A typical visit to a typical website is fast, but:
- You likely visit many website each day, some slow and some fast
- Even on a fast website some percentage of page views will be slow
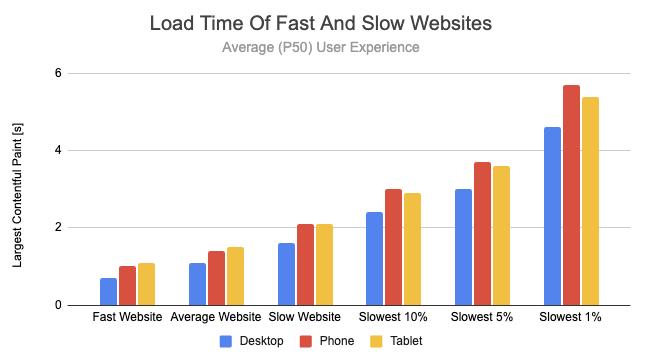
How does loading speed vary between websites?
On 25% of mobile websites you can expect to wait longer than 2.1 seconds for each page to load. For one in a hundred websites even an average page load takes more than 5.7 seconds.
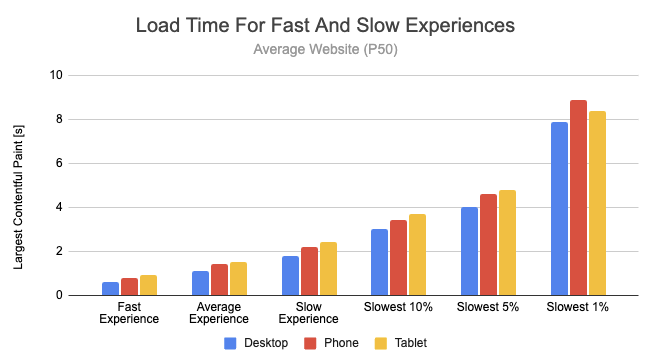
How does loading speed vary between different user experiences?
Visitor experiences don’t just vary by what website they visit but also by other factors like page is viewed or how fast the visitor’s network connection is.
So far we’ve looked at an average user experience, or the 50th percentile. If the 50th percentile (or P50) is 2.1 seconds it means pages load within 2.1 seconds or less 50% of the time. But it also means that half of page views will be slower than 2.1 seconds. And a small fraction, maybe one percent or 10%, will be significantly slower.
While the typical load time on mobile is 1.4 seconds, faster load times are also common. Most websites will display the main content in less than a second at least 25% of the time.
But even an average website will also leave visitors waiting over 3 to 4 seconds 10% of the time. And you can expect 1% of page loads to take 8 seconds or longer.
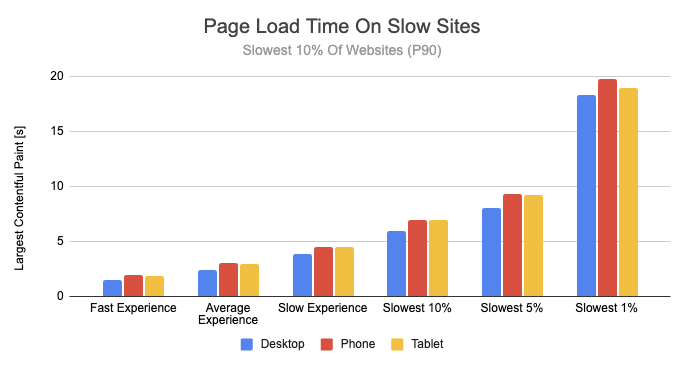
What if we look at the slowest 10% of websites instead of the average website?
Here over 10% of visitors wait over 5 seconds. Almost 1% wait for almost 20 seconds for the main page content to appear.
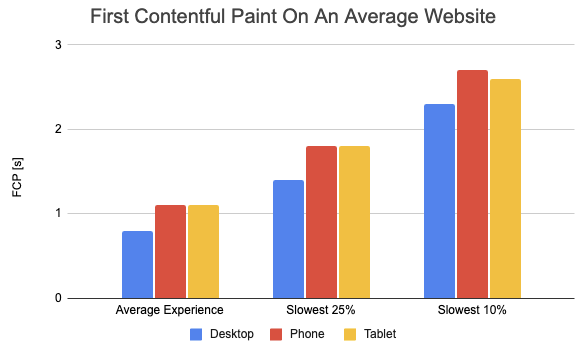
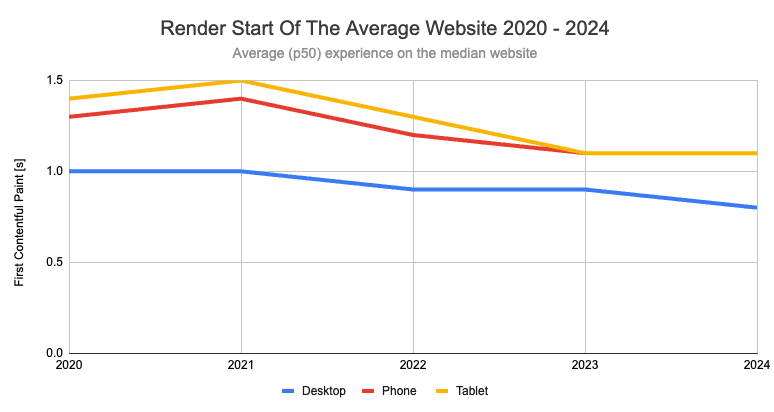
How soon does content start showing up?
While the LCP metric looks at the largest content element that appears on the page, the First Contentful Paint (FCP) metric marks the point when page content first starts appearing.
On desktop the median FCP value for the average website is 800 milliseconds, compared to 900 milliseconds on phones.
How long does a typical server response take?
Loading the HTML document is the first step when navigating to any website. The Time to First Byte (TTFB) metric measures how much time elapses between opening the website and when the first byte of the HTML response is received by the client.
A typical TTFB value is around 0.4 to 0.5 seconds. On the slowests 10% of websites visitors wait over one second just to load the initial document.
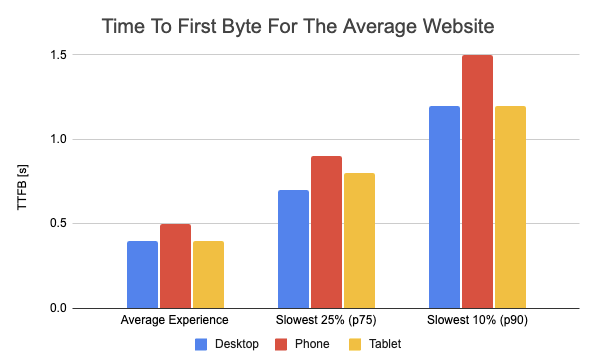
Given that this metric mostly measures server response time, why is it still worse on phones than on desktop devices?
That’s because the TTFB value here also includes time spent on establishing a server connection, which takes several network round trips between the client and the server. Mobile network latency is higher, which means establishing the connection and making the document request takes longer.
Are websites getting faster or slower?
If we look at data for the Largest Contentful Paint metric from 2020 to 2024 we can see that page speed has consistently improved.
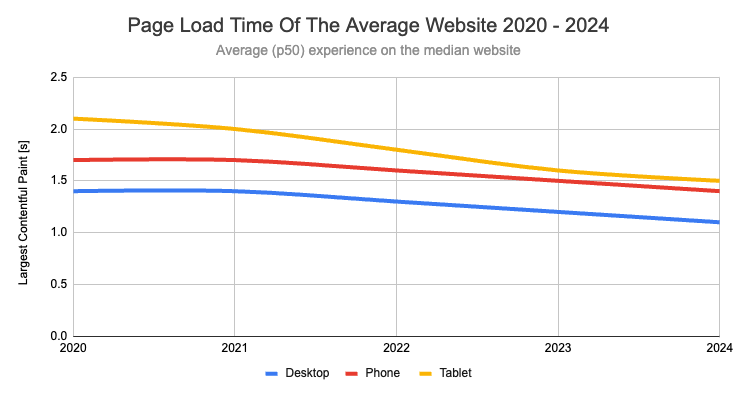
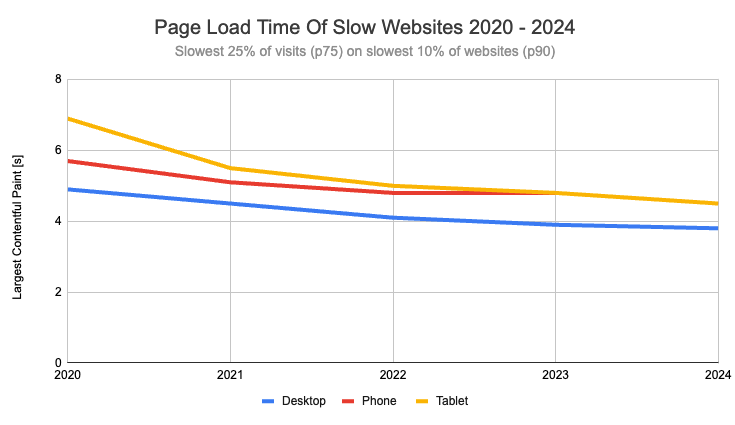
The chart above looks at average user experiences on average websites. Have slower experiences on slower websites also improved? The chart below shows that page speed has improved across all three device types.
Why might the web be getting faster?
What could this data tell us? There are multiple ways to explain the improvement in the LCP metric:
- Visitors have faster devices and network connections
- Websites are more optimized for performance
- The Chrome browser has been optimized more
- There could have been changes to the Largest Contentful Paint definition
It could also be that different websites are now included in the CrUX dataset.
While changes to the LCP definition may have impacted the data, the First Contentful Paint metric – which is more stable and well-defined - has also improved.
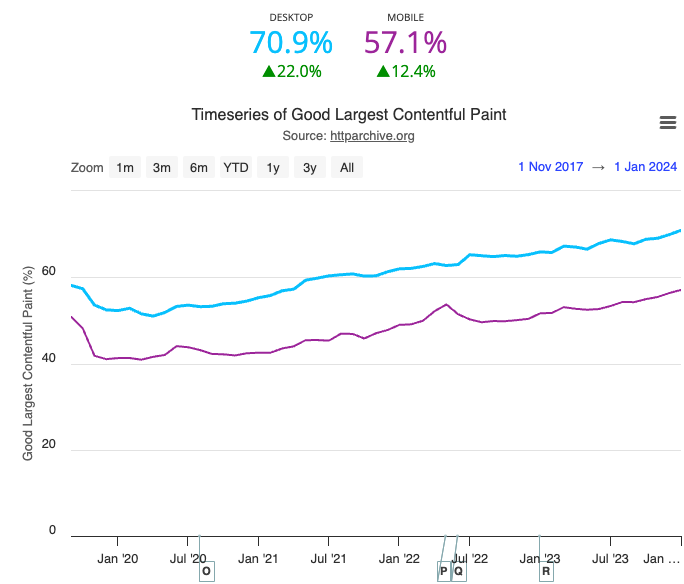
The HTTP Archive also shows that more websites have received a “Good” rating on the Largest Contentful Paint metric. A good score means an LCP value below 2.5 seconds.
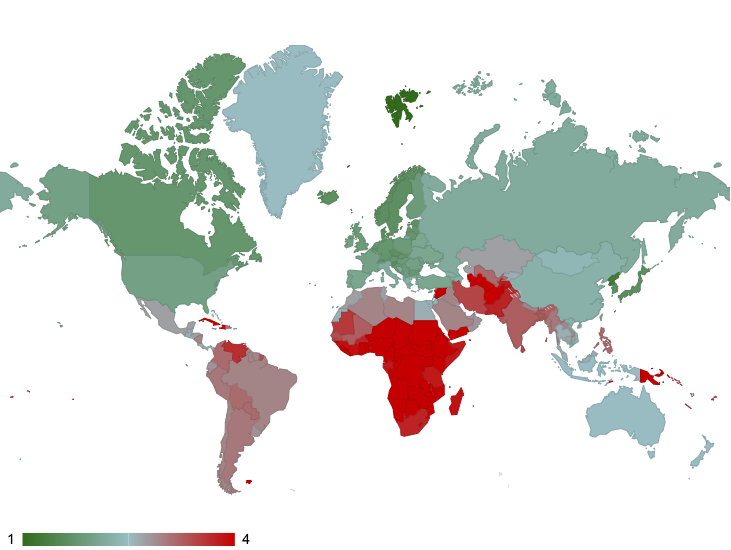
How does page load time vary by country?
Differences in the available network connections and device CPU speed mean that visitors in different countries experience the web differently.
Here we’ll look at the 75th percentile of experience rather than the median visitor experience. For reference, the overall LCP value for the 75th percentile (or the slowest 25% of experience) is 2.3 seconds.
Several countries have mobile load times below 1.5 seconds, including Svalbard, San Marino, and Liechtenstein.
Several larger countries have load times below 1.7 seconds, including Sweden, Slovenia, Japan, and South Korea. The US comes 45th with a p75 mobile load time of 2.0 seconds.
At the other end of the scale, typical load times in the Central African Republic are 9.2 seconds. In Nigeria and Angola pages often take 4.7 seconds to load.
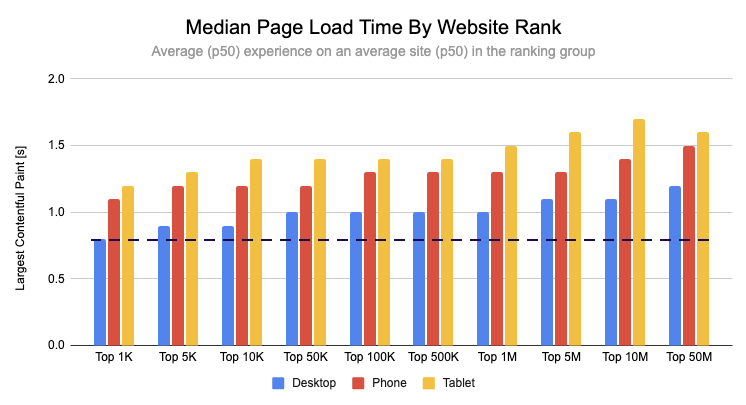
Are more popular websites faster?
Looking at the average website isn’t necessarily all that meaningful since the most popular websites are where visitors spend most of their time.
By comparing page speed by website rank we can see that bigger websites do tend to be faster. For example, a typical mobile load time on Top 1000 website is 1.1 seconds compared to a load time of 1.4 seconds on a Top 10 million site.
How was this data collected?
Google collects data from real website visitors who are logged into their Google account and have analytics reporting enabled. This data is then published on as a BigQuery dataset that shows an experience distribution for each website.
We then queried this dataset like this, first finding the percentile score for each website and then aggregating the data across websites. Thanks to Rick Viscomi from Google for helping with these queries!
WITH medians AS (
SELECT
    `chrome-ux-report`.experimental.PERCENTILE(ARRAY_AGG(lcp_bin), 50)
       AS p50_lcp
FROM
    `chrome-ux-report.country_us.202402`,
    UNNEST(largest_contentful_paint.histogram.bin) AS lcp_bin
    GROUP BY origin
)
SELECT
    APPROX_QUANTILES(p50_lcp, 1000)[OFFSET(500)] AS p50_p50_lcp,
FROM
    medians
Want to improve your site speed?
BigQuery data can give you monthly data for pretty much any website, but if you want to improve your website you need a dedicated monitoring tool.
DebugBear provides synthetic testing and real user monitoring, making sure you instantly become aware of changes on your website. It also provides an in-depth analysis with suggestions to help you optimize page speed and Google Core Web Vitals.


Monitor Page Speed & Core Web Vitals
DebugBear monitoring includes:
- In-depth Page Speed Reports
- Automated Recommendations
- Real User Analytics Data