
The load event was never built to measure page load time, but it was there when developers needed it and saw widespread adoption to measure page speed. Today more modern metrics like the Largest Contentful Paint are available and should usually be preferred over the Load event timing.
This article looks at when the load event fires and how useful it is as a metric today.
When does the Load event fire?
The window load event in JavaScript fires when all immediate dependent resources on a page have loaded. This includes:
- CSS stylesheets
- JavaScript code (whether async or not)
- Images
- Iframes
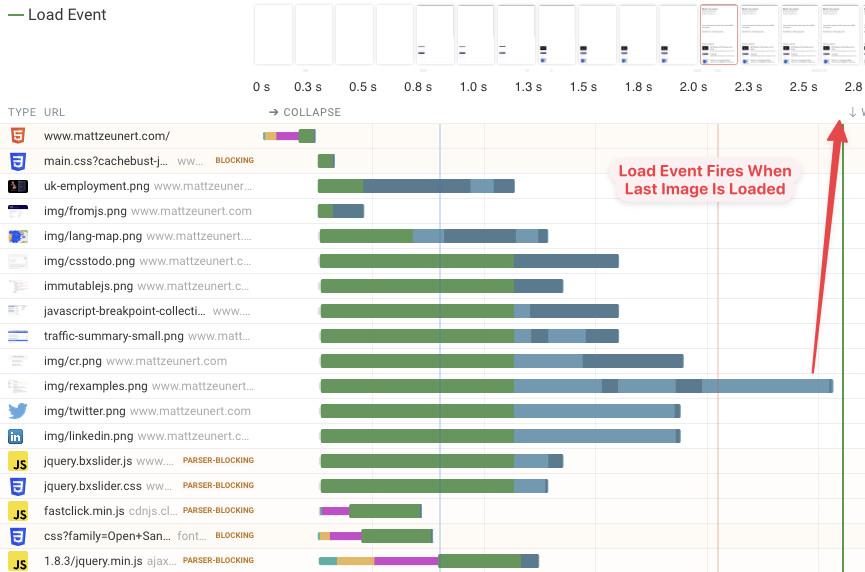
The time between the start of the navigation and when the load event occurs is often used to measure page speed.
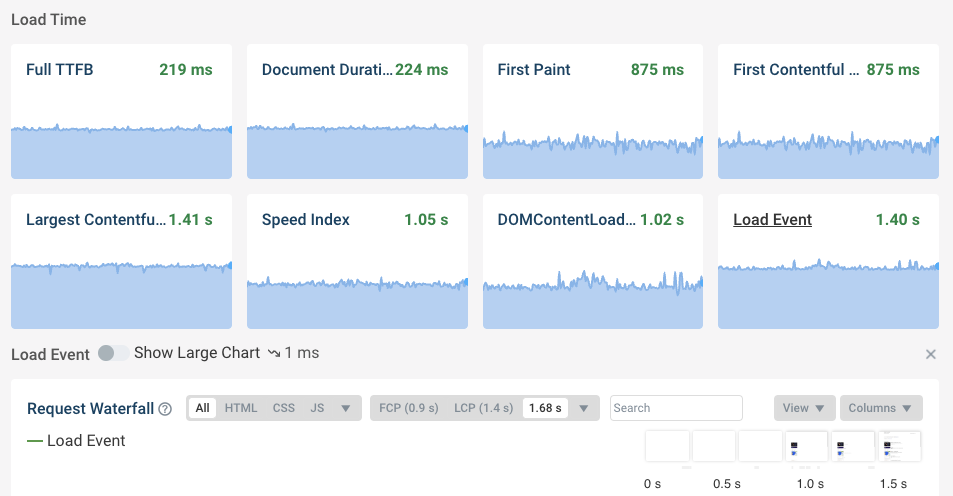
This screenshot shows a request waterfall with the Load event indicated by the green line. The load event fires immediately after the last image has finished downloading. You can see the download time of the image by looking at the blue box.
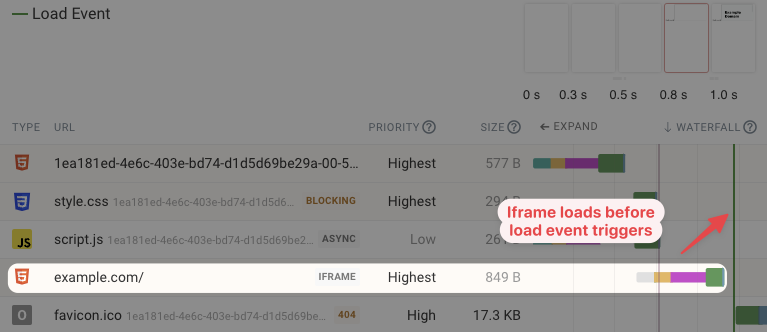
Similarly, here is an example of a website that's embedding another page as an iframe. The load event of the parent frame only fires when the iframe has also finished loading.
Is the Load event milestone a good page speed metric?
The Load event is a purely technical metric, similar to the Time to First Byte. Just because it fires that doesn't mean that there's any content for the user to see. Likewise, the user may have started happily reading content and interacting with the page long before the load event fires.
When measuring page speed it's usually best to focus on modern user-centric metrics like the Core Web Vitals.
However, there are a few advantages of looking at the Load event:
- It has effectively universal browser support
- A slow Load time can suggest that some page content loads slowly, even if the main above-the-fold content loads quickly
- Comparing the Load time to other metrics can lead to insights on a site's loading behavior, for example if the FCP happens after the Load event that might be because all page content is JavaScript-generated
How to measure the load event timing using browser APIs
You can measure the Load event timing by looking at the loadEventStart property of the PerformanceNavigationTiming.
performance.getEntriesByType("navigation")[0].loadEventStart;
// 9431 (milliseconds)
The duration property also reports when the load event fired.
Run A Free Page Speed Test
Test Your Website:
- Automated Recommendations
- Detailed Request Waterfall
- Web Vitals Assessment
How to view the load event time in Chrome DevTools
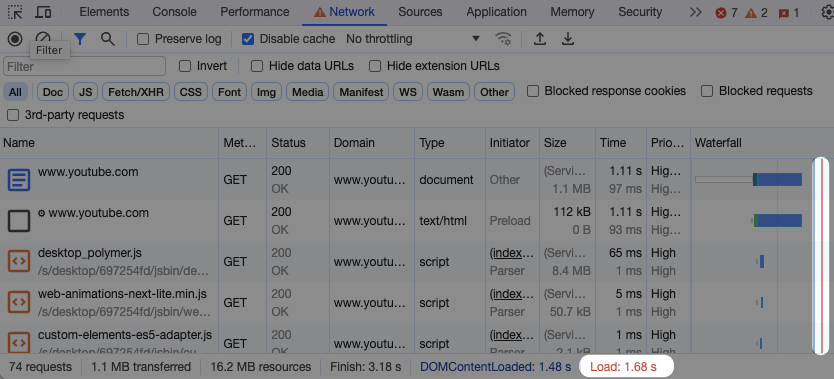
You can see the page Load time at bottom of the DevTools Network tab. It's also marked by a red line in the waterfall.
How to view the load event time in DebugBear
You can find the Load metric in the Metrics tab of your test results. Click the chart title to see more details, including the request waterfall leading up to the page load event.
How has the average Load event time changed over time?
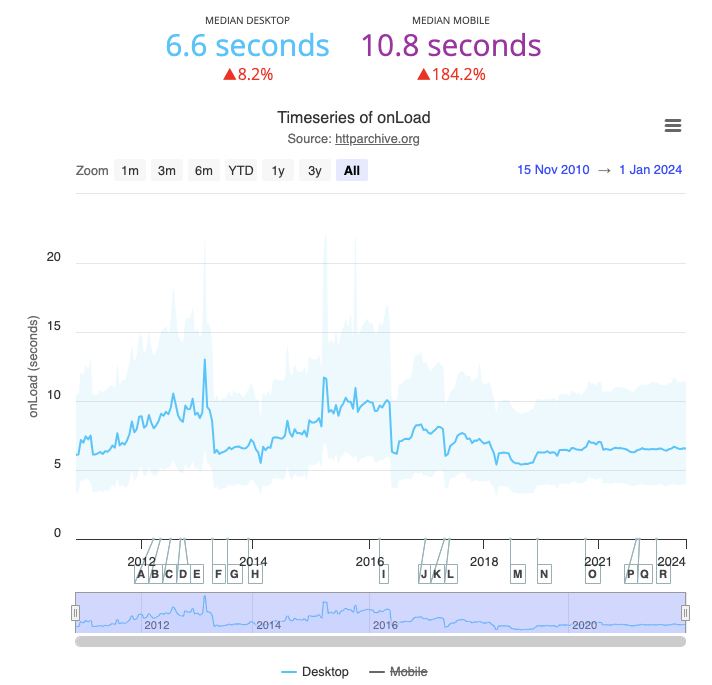
The HTTP Archive has run website tests since 2010 and tracked the Load event since then.
As of January 2024 the average Load time on desktop is 6.6 seconds and 10.8 on mobile on a throttled connection. Overall the Load event time has remained relatively stable over time.
I've hidden the mobile chart in the screenshot below as the mobile test settings have changed significantly over time, resulting in big jumps in the chart.
It can be hard to interpret the HTTP archive data due to the changes to the test environment over time. We've written a blog post all about that and whether the web is getting slower.
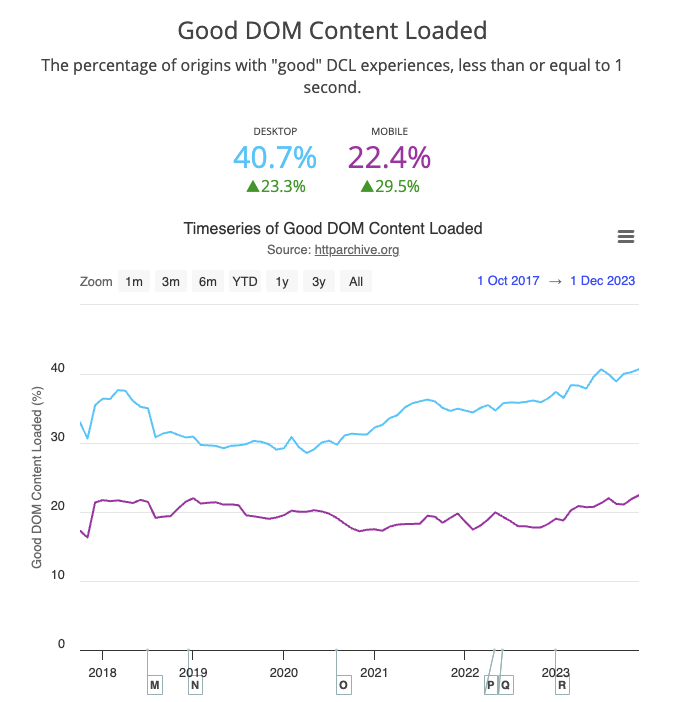
This HTTP Archive data comes from synthetic tests, but Google has also been releasing real user onLoad data since 2018.
Google is reporting the percentage of user experiences with a load time below one second. This data comes from the Chrome User Experience Report.
Here we can see that the Load event has become faster over time. The chart says that only 22% of mobile onLoad experiences were good, but this is due to a very aggressive load time threshold of one second to count as good.
Monitor page load and modern metrics
DebugBear is a page speed testing tool that helps you keep track of your website performance in the lab and with real-user analytics.
Start your free 14-day trial.


Monitor Page Speed & Core Web Vitals
DebugBear monitoring includes:
- In-depth Page Speed Reports
- Automated Recommendations
- Real User Analytics Data