Measure And Optimize Interaction to Next Paint (INP)
Interaction to Next Paint (INP) is a website performance metric that measures how fast pages respond to user interactions.
It's one of Google's three Core Web Vitals (CWV) metrics that impact your search result rankings, along with Largest Contentful Paint and Cumulative Layout Shift.
This article takes a look at what INP measures and what you can do to optimize it.
What is Interaction to Next Paint?
Interaction to Next Paint (INP) is a web performance metric that measures how quickly a website responds to user interactions like clicks or key presses.
Specifically, it measures how much time elapses between a user interaction and the next time the user sees a visual update on the page.
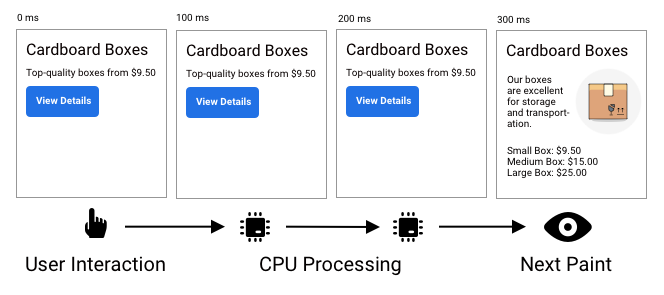
Even if no visual update occurs after a user interaction, you'll still get an INP score measuring how long the browser was busy processing the interaction.
INP scores aren't just measured on buttons and text fields, but also "non-interactive" page elements like headings or images.
How is Interaction to Next Paint measured?
INP measures the responsiveness of your website by tracking the time between user input and UI updates. It can be subdivided into three contributing components:
- Input Delay: waiting for background tasks on the page that prevent the event handler from running
- Processing Time: running event handlers in JavaScript
- Presentation Delay: handling other queued up interactions, recalculating the page layout, and painting page content
This diagram shows an example timeline of different CPU tasks, and how they add up to INP activity. Interaction to Next Paint spans the entire time frame from the mouse, touch, or keyboard input up to the point when the next frame is rendered by the browser.
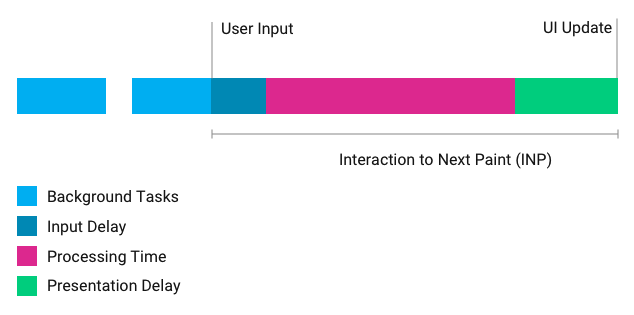
The processing time can be made up of multiple event handlers, for example keydown and keyup events.
What's a good Interaction to Next Paint value?
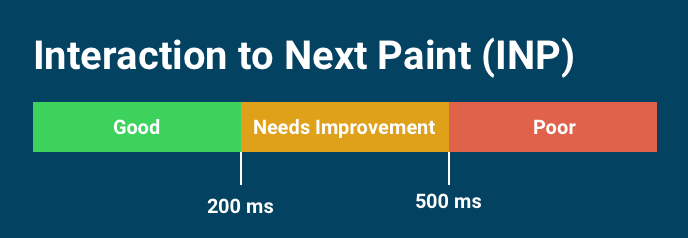
A good INP score is less than 200 milliseconds, while an INP over 500 milliseconds is considered poor and may negatively impact your search rankings.
Interaction to Next Paint became one of the Core Web Vitals metrics in March 2024 and therefore is a Google ranking factor.
How to optimize Interaction to Next Paint
Follow these steps to optimize your INP scores:
- Identify what's causing slow interactions
- Collect additional performance data
- Identify high-impact optimizations and apply them to your code
Identify the element that caused poor INP
A big challenge when faced with poor INP scores is that you don't know what page elements are responsible. Users might be interacting with any number of page elements. Those elements might not even be visible initially, for example a shopping cart that appears after the user has selected a product.
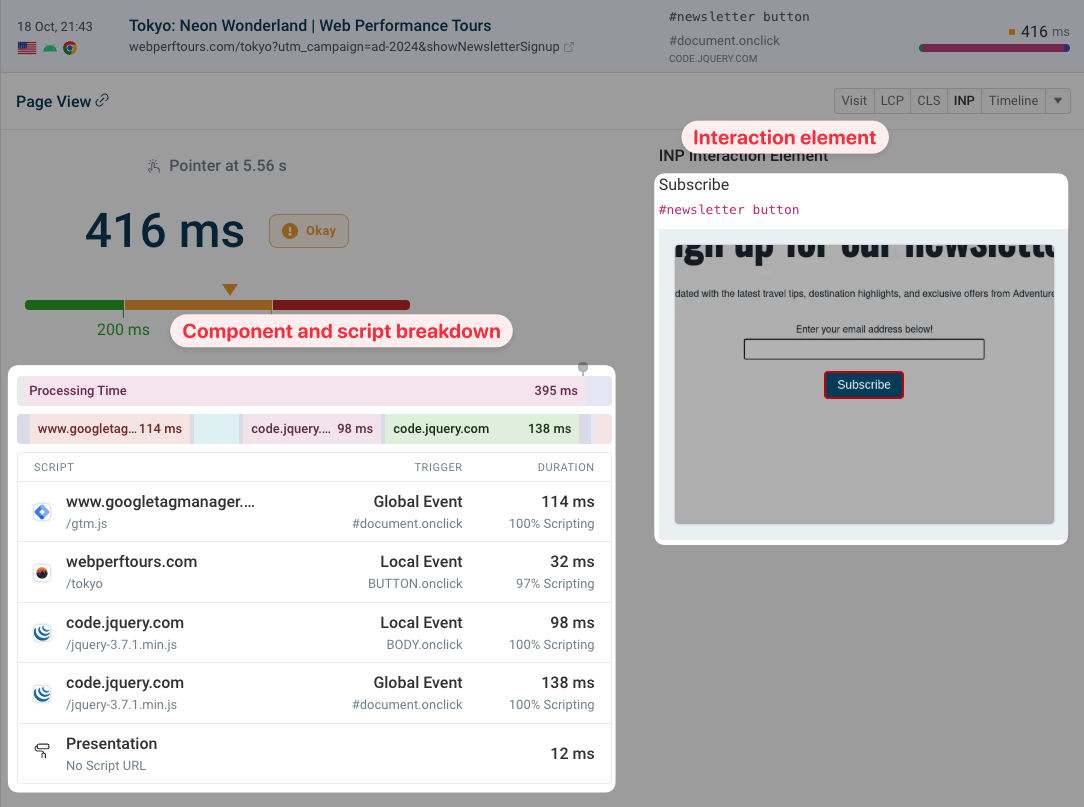
Ideally you need real user monitoring data so you can track what elements cause poor performance and how often. For example DebugBear can collect this data and show how common certain interactions are and what a typical INP delay looks like for them.
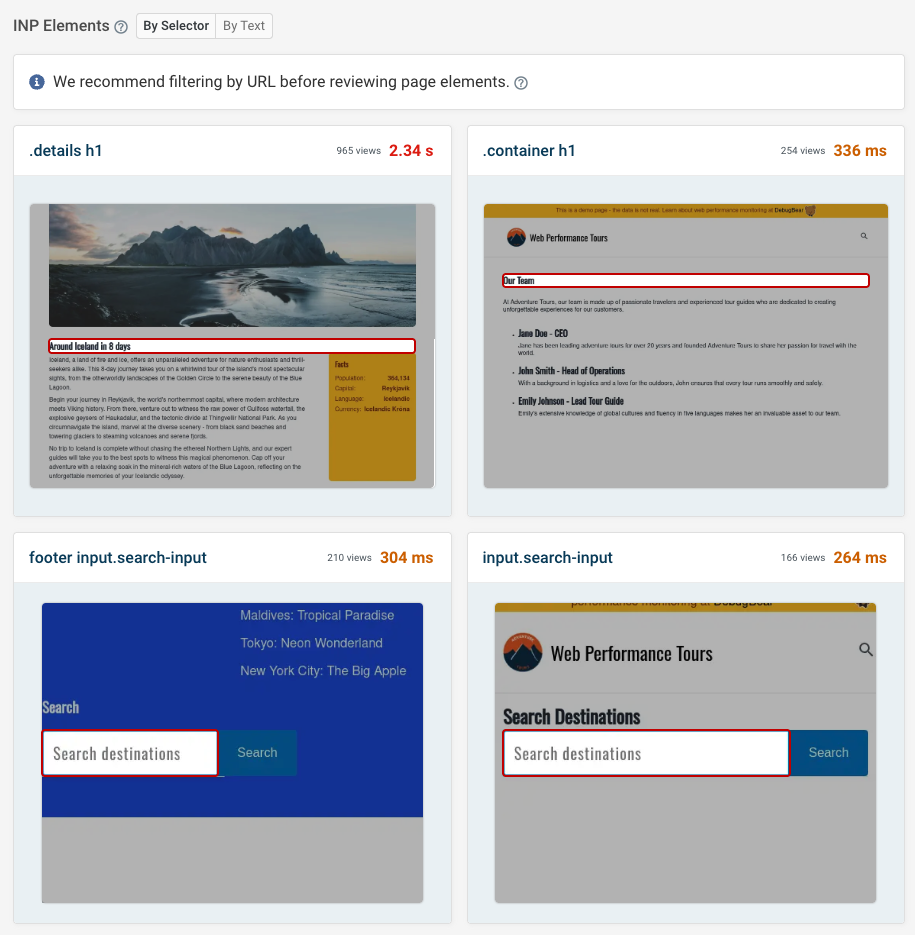
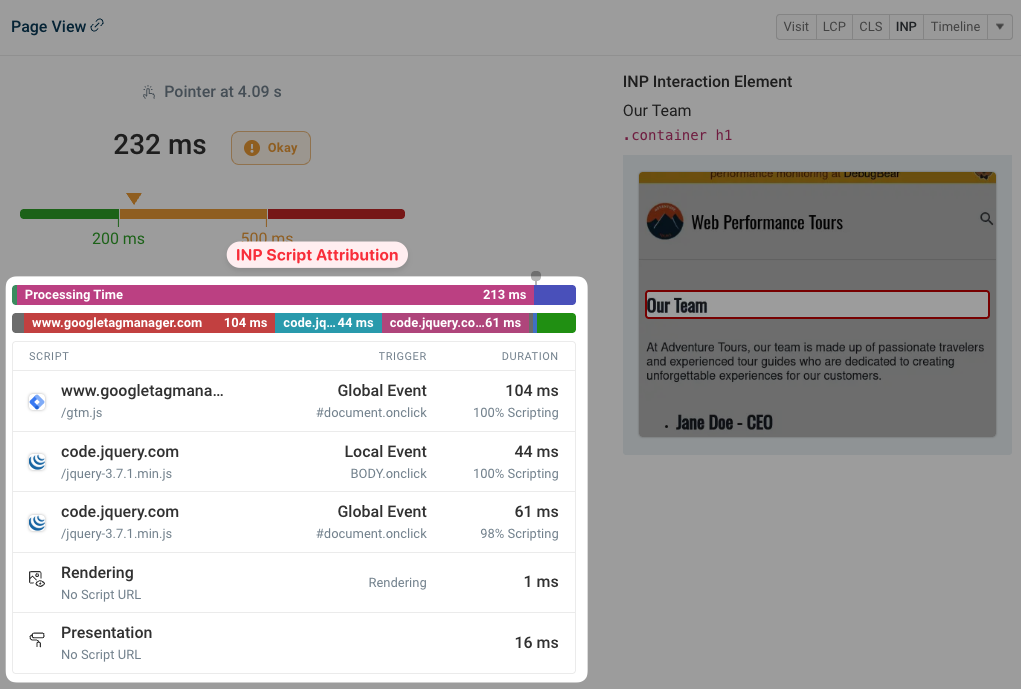
You can then look at an example page view for a slow interaction to view additional data on what's slowing it down, like the component breakdown and specific scripts that ran in response to the interaction.
Replicate the interaction and record it with Chrome DevTools
Sometimes the real user script data already tells you what's slowing down your page. But the Chrome DevTools performance recording can provide much deeper insights.
Here's how to collect a performance profile:
- Right-click on the page and select Inspect to open the developer tools
- Switch to the Performance tab
- Open settings for the recording by clicking on the top right gear icon in the second row
- If you're on a fast device, enable CPU throttling by selecting 4x slowdown
- Click on Record in the Performance tab
- Perform the interaction you want to debug
- Click Stop and wait for the analysis to load
You don't need to enable CPU throttling, but it's helpful to replicate what performance would be like on a slower device like a phone.
The Interaction lane now shows when the user input happened. Hover over it to view the component breakdown.

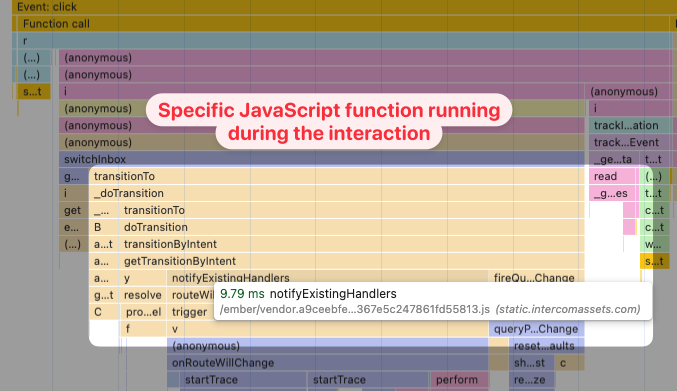
The superpower of the DevTools performance profile is that it can show you exactly what's happening on the main thread at any given point in time.
For example, the main thread view shows you what functions from your source code were running in response to the interaction. You can then check if those function calls are necessary or if their execution time can be reduced.
Reduce input delay
If input delay is high you need to reduce CPU activity unrelated to the user input, to free up processing capacity for handling the interaction itself.
Break up long CPU tasks
Input delay happens when a long CPU processing task is in progress at the time when a user interacts with the page. Splitting up long tasks into shorter processing chunks reduces the delay before the browser can start handling the interaction.
The scheduler.yield browser API lets you tell the browser that you want to do more processing work, but that it's ok to wait until later if other tasks are more important. The browser's scheduler decides what tasks need to run next, but it can't pause an existing main thread task by itself.
Instead your JavaScript code can explicitly yield control to the scheduler.
async function slowTask() {
  doSomeSlowWork();

  // Allow the browser to handle any user interactions
  await scheduler.yield();

  doMoreSlowWork();
}
This way if there was a user interaction during doSomeSlowWork the browser can first handle that before blocking the main thread again to run doMoreSlowWork.
Minimize CPU processing during the initial page load
When a website first loads the CPU is often at its busiest. Different scripts are loading and page content is rendering gradually as it becomes available. As a result, input delay is often especially high if the user interacts with a page while it's still loading.
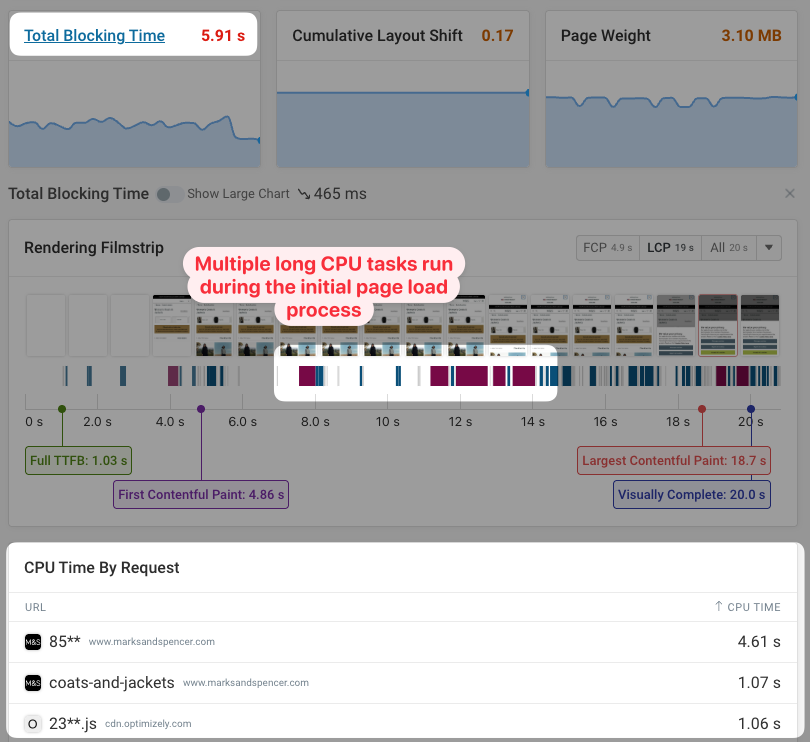
Run a page speed test and review the Total Blocking Time metric to see if there is early background activity that would block user interactions.
This way you can see what specific scripts run when the page is loading and how much they contribute to keeping the CPU busy.
Reduce third-party delays
If third-party code is responsible for background tasks, check if the code is configurable to reduce the amount of work or if it's possible to only load the third-party script when necessary.
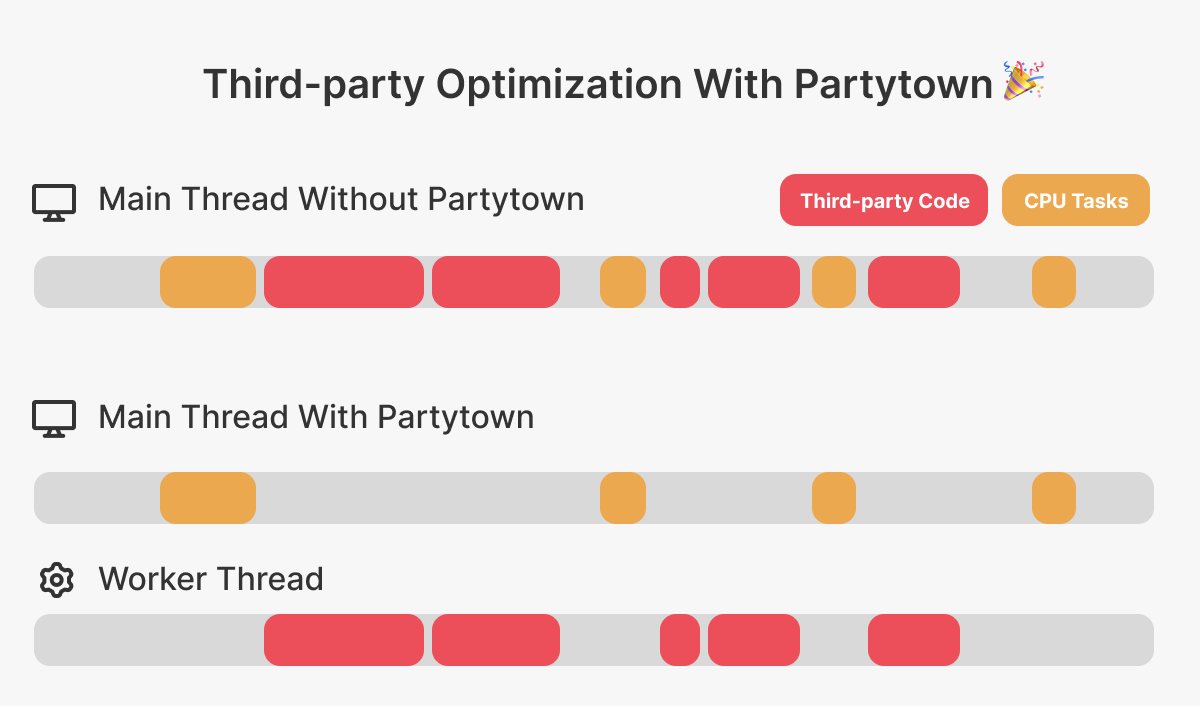
You can also use the Partytown library to move third-party code to a web worker that runs independently of the browser main thread and therefore doesn't delay interactions.
Reduce processing time
INP processing time can sometimes be easier to fix, as this code is directly related to a specific interaction. However, global event handlers added by analytics tools can also increase processing time.
Optimize front-end component code
Many modern websites are built as single-page applications using JavaScript frameworks like React or Vue. This code can often be slow and complex, resulting in delays before a UI update is ready to render.
For example, it's common for React components to re-render unnecessarily. Wrapping a component in React.memo can prevent that:
const MyComponent = React.memo(({ title }) => {
  return <div>{title}: I only re-render when needed!</div>;
});
This way the component only renders if the value of the React prop changes (in this case the title property).
We've published a number of framework-specific optimization guides:
Show a spinner before heavy processing
INP measures the time until the next paint. It does not care whether new content is fully rendered at that point!
That means that if an interaction is slow you can show a spinner or skeleton loader to tell the user that their input is being processed.
Then once the UI update has taken place you can start working on actually displaying the new content.
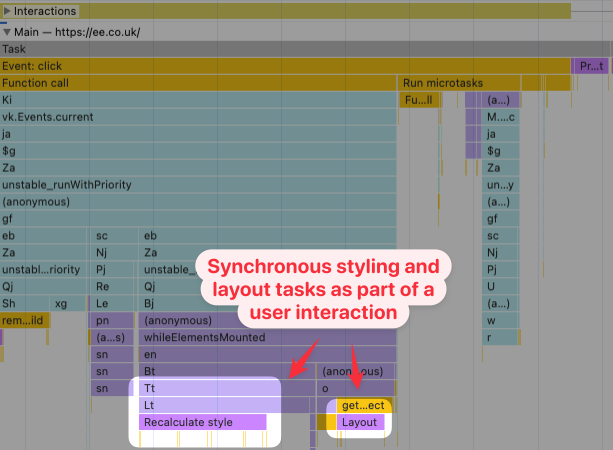
Avoid forced reflows
Forced reflows happen when JavaScript code modifies content styles and then reads layout data like the size or position of an element. In order to continue running the code the browser first has to update style and layout calculations.
This is especially bad when it happens repeatedly, which is called layout thrashing. This might happen when iterating through items in a slider or tab menu.
You can see synchronous layout tasks in the DevTools performance recording. In this example calling getBoundingClientRect to get its position on the page requires updating page layout calculations.
Optimize slow JavaScript code
Many slow CPU tasks are caused by calling browser APIs, but sometimes it's your own JavaScript code that needs to be optimized:
- Excessive or nested list iteration
- Using libraries instead of native functionality
- Setting up too many event listeners
Offload heavy processing tasks to a web worker
Not all CPU processing delays interactions – only slow tasks on the main thread do. That means you can run slow processing tasks on a different thread using web workers.
The main thread and worker thread send messages to each other. The web worker can perform slow processing tasks in the background, while the main thread only takes the computed result and displays it.
Reduce presentation delay
The amount of presentation delay can depend on the complexity of the page and how much of the page is updating.
If rendering the page contents is slow, consider only showing important "above the fold" content first to deliver the next frame more quickly.
Watch this video to learn more about INP
Learn more about the INP breakdown, how to measure INP, and what you can do to optimize it.
How is Interaction to Next Paint different from First Input Delay?
There are two key differences between FID and INP:
- FID only measures the initial processing delay, while INP measures the full amount of time between user input and the UI update
- FID only counts the first user interaction on a page, while INP looks at (roughly) the worst delay
First Input Delay measures how long it takes for the browser to start processing user input. The actual time spent responding to the event or updating the UI isn't included.
As the name suggests, FID only considers the first time the user interacts with the page. Especially for pages that stay open for a long time, like single-page apps, this first interaction might not be representative of the overall user experience.
Interaction to Next Paint generally measures the worst input delay on the page. However, if there are many user interactions, outliers will be ignored, and Google will measure the 98th percentile of interaction delay. So if the INP on a page is 250 milliseconds, 2% of user interactions had a latency greater than 250 milliseconds.
Knowing how to effectively optimize INP requires a good understanding of how INP works. You can learn more about common INP mistakes and misconceptions in our Debunking 5 Myths About Interaction to Next Paint post.
Does Interaction to Next Paint impact SEO?
Interaction to Next Paint is a Core Web Vitals metric that affects your Google search rankings. INP was added as one of the web vitals on 12 March 2024. It replaced the older First Input Delay metric.
Why is INP a field metric?
INP relies on real user interactions and is primarily measured through field data from actual website visitors.
Google collects real user data on INP as part of the Chrome User Experience Report (CrUX).
INP data is not typically available during synthetic testing because it requires user interaction. However, you could script a user interaction in a lab environment to collect lab data for INP. Keep in mind that each page interaction can have different performance characteristics, depending on what UI element the user interacts with and when that interaction happens.
The INP Debugger lets you identify page elements with poor responsiveness in a lab environment. The tool automatically interacts with page elements and measures the response delay.
Does INP measure the slowest response on a page?
When a user visits a page they may click on multiple different UI elements. If they are filling out a form they will press many keys on their keyboard. How does INP account for that?
INP will report the slowest 2% of UI responses. Usually that means the worst delay will be reported, but if a page receives a lot of interactions only one of the slowest will be reported.
For example, if a page takes 50 milliseconds to respond to 100 interactions, and then there is one interaction with a 300-millisecond delay, then INP will be reported as 50 milliseconds.
However, if there are three 300-millisecond delays, then the 98th percentile will be 300 milliseconds, and this will be reported as the INP.
What user interactions does INP consider?
To improve your search performance, optimize these INP user interactions:
- Mouse clicks
- Touch screen taps
- Keyboard input
The following interactions do not count:
- Hovering
- Scrolling
Learn more about what elements, and what user interactions are considered for INP.
Changes to the INP definition
Google continuously refines how their Core Web Vitals metrics are defined. If you see unexplained changes to your metrics this may be due to a change in how INP is measured. Check out the INP changelog to see what changes have been made in different Chrome versions.
Do alert and similar dialogs contribute to INP?
Originally, alert and confirm dialogs were considered to be part of the INP metric. However, as of Chrome 127, alert and similar dialogs are now excluded from the INP metric.
How to measure Interaction to Next Paint
Measure, optimize and fix your Interaction to Next Paint score using these SEO and performance tools:
- The DebugBear website speed test
- Google PageSpeed Insights
- Our Site Speed Chrome extension
- The INP Debugger
- Google Search Console
- The Web Vitals library
Continue reading to learn how to run an INP test.
Measure Interaction to Next Paint with DebugBear
Check and debug your INP with DebugBear's free website speed test, showing Interaction to Next Paint metrics for your real users.
Simply enter your URL, run the test, and open the Web Vitals tab. There you can find your website's Interaction to Next Paint based on Google CrUX data, along with a 40-week history.

In addition to looking at the CrUX data for the last 28 days you can also see a history of how INP has changed over the last 40 weeks.
Use the URL and Origin toggle near the top of the page to switch between data for the specific test URL and the whole website.
You can also continuously monitor Interaction to Next Paint using DebugBear real user monitoring.
Interaction to Next Paint in PageSpeed Insights
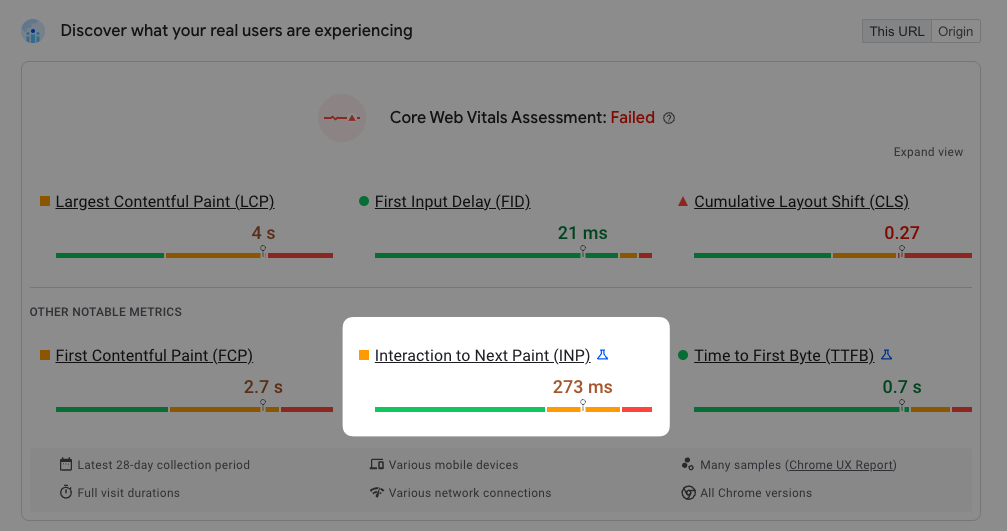
Optimize your SEO using Google PageSpeed Insights, which displays INP metrics reflecting your page's responsiveness to user interactions.
The metric reports the 75th percentile of user experiences. For example, if the INP is 273 milliseconds, that means that for the 25% of visitors with the slowest INP, the worst delay between input and the next UI update that they experienced was 273 milliseconds.
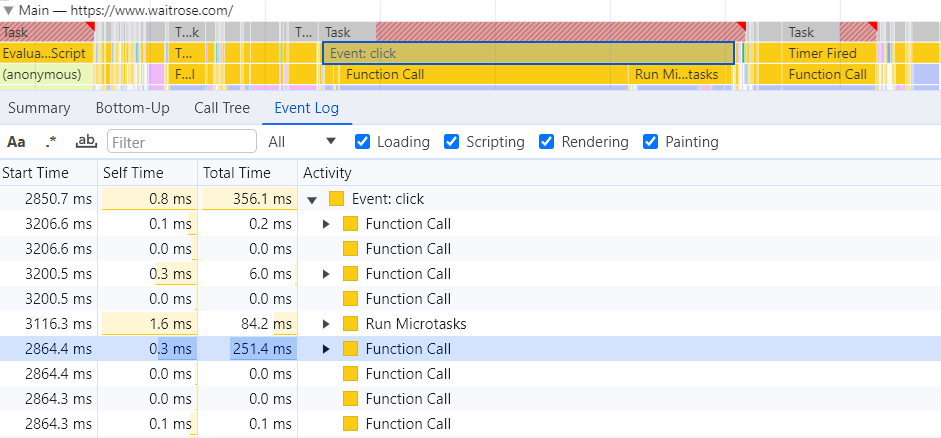
Interaction to Next Paint in Chrome DevTools
The Performance Profiler in Chrome DevTools shows the INP component breakdown and their timings when hovering over an interaction. The interaction block changes to stripes after 200 ms: this indicates the task is taking longer than what Google considers a good INP score.
Either side of the interaction are whiskers representing Input Delay and Presentation Delay.
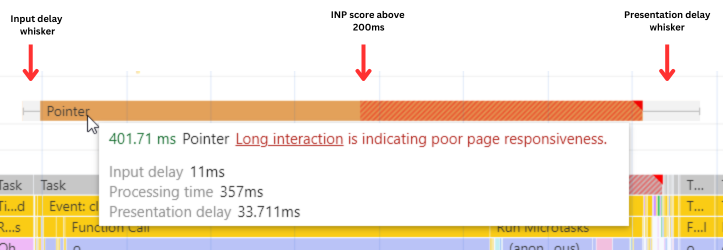
This analysis helps identify how to improve INP. In the example here, CPU blocking is causing a processing time of 357 ms, which tells us that we have a poor INP score because of the event handlers running in response to the user input.
DevTools allows us to see exactly what work is blocking the CPU. In this case, it's a function call.
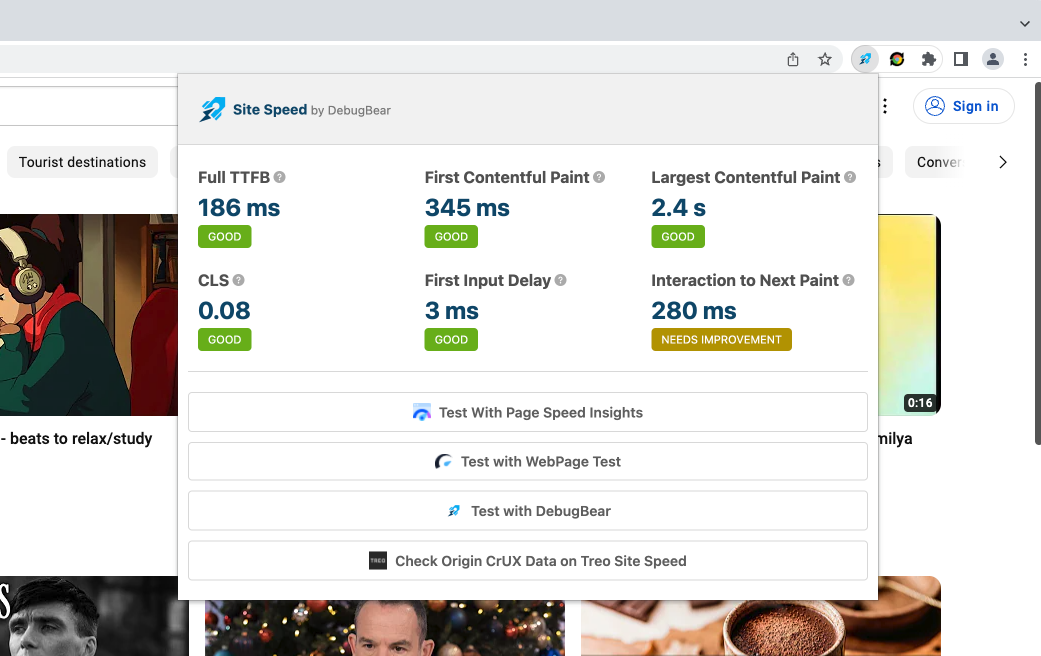
View INP with the Site Speed Chrome extension
You can install the Site Speed Chrome Extension to view Core Web Vitals and INP for the website that's currently open.
This value will only be available once you've interacted with the page, for example, by clicking on it or typing in a text field.
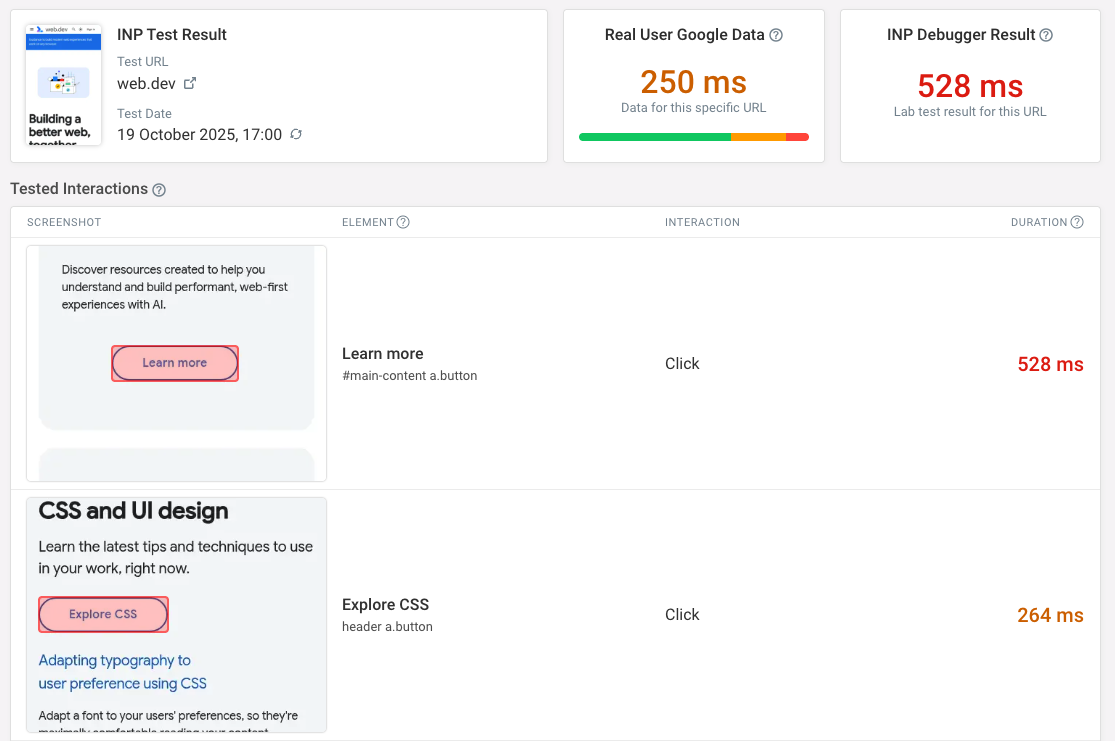
Check for INP issues with the INP Debugger
The free INP debugger tool automatically identifies clickable page elements on your website, simulates interactions with them, and reports slow interactions. All you need to do is enter your URL.
The INP Debugger makes it easy to see what page elements result in slow interactions, but it can't tell you how often users will interact with those UI components.
If you want to see what page elements your users interact with most often, you might want to consider setting up real user monitoring on your website.
The INP test result tells you:
- Your website INP score according to the Chrome User Experience Report (CrUX)
- The interaction delay for specific page elements, along with element screenshots
INP issues in Google Search Console
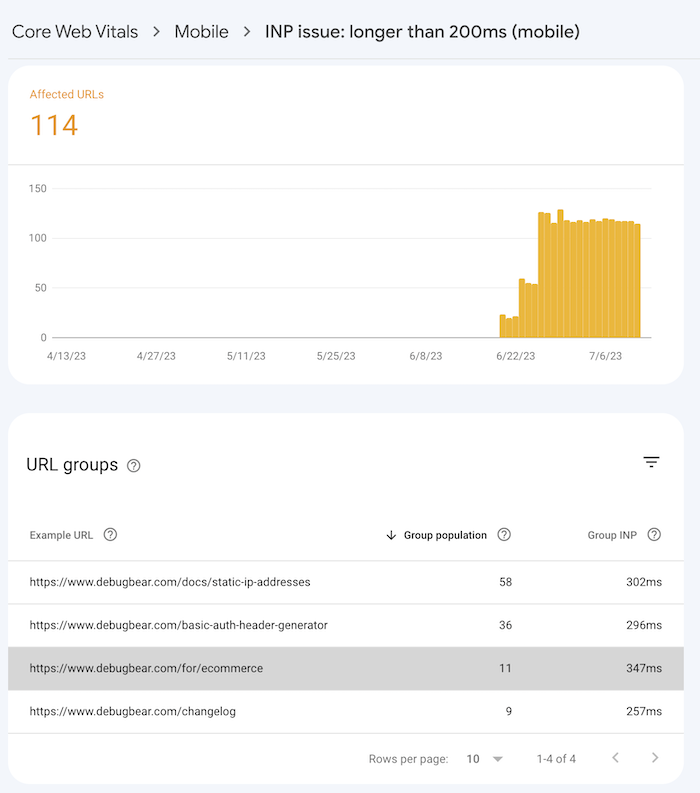
The Core Web Vitals tab in Google Search Console provides INP reporting for your website.
If there are INP problems on your website, you'll get a message like "INP issue: longer than 200ms (mobile)" at the bottom of the report.
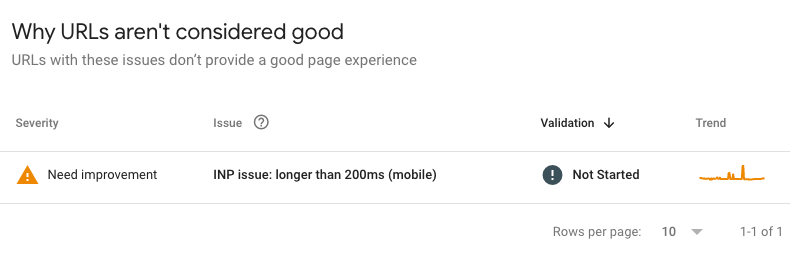
After clicking on the "Poor" or "Needs Improvement" section you can see how many URLs are affected and what URL groups to optimize.
Measure INP with the web-vitals library
If you want to measure INP programmatically with JavaScript, you can use the web-vitals library. This allows you to obtain measurements from real users and send them back to your analytics provider.
You can load the library with a script tag like this:
<script src="https://unpkg.com/web-vitals@3/dist/web-vitals.iife.js"></script>
You can then use the onINP method on the webVitals object to see when the Interaction to Next Paint value changes.
webVitals.getINP(
  function (info) {
    console.log(info);
  },
  { reportAllChanges: true }
);
The value of the INP metric can change through the lifetime of the page as the user continues interacting with it. reportAllChanges ensures that even preliminary values are reported.
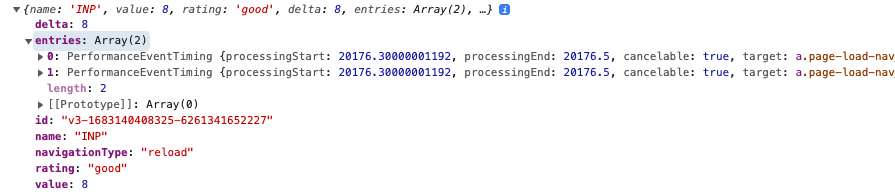
In addition to reporting the INP value the web-vitals library also reports a list of entries. These are the individual user interactions that have contributed to the INP score.
{
  "name": "pointerdown",
  "entryType": "first-input",
  "startTime": 20168.80000001192,
  "duration": 8,
  "processingStart": 20176.30000001192,
  "processingEnd": 20176.5,
  "cancelable": true,
  "target": "(DOM Element Object)"
}
The target tells you what page element the user interacted with.
The startTime is the timestamp in milliseconds when the user interaction occurred. processingStart indicates when the event handler started to run. processingEnd is when the event has been processed.
Long Animation Frames: See what scripts are contributing to INP delays
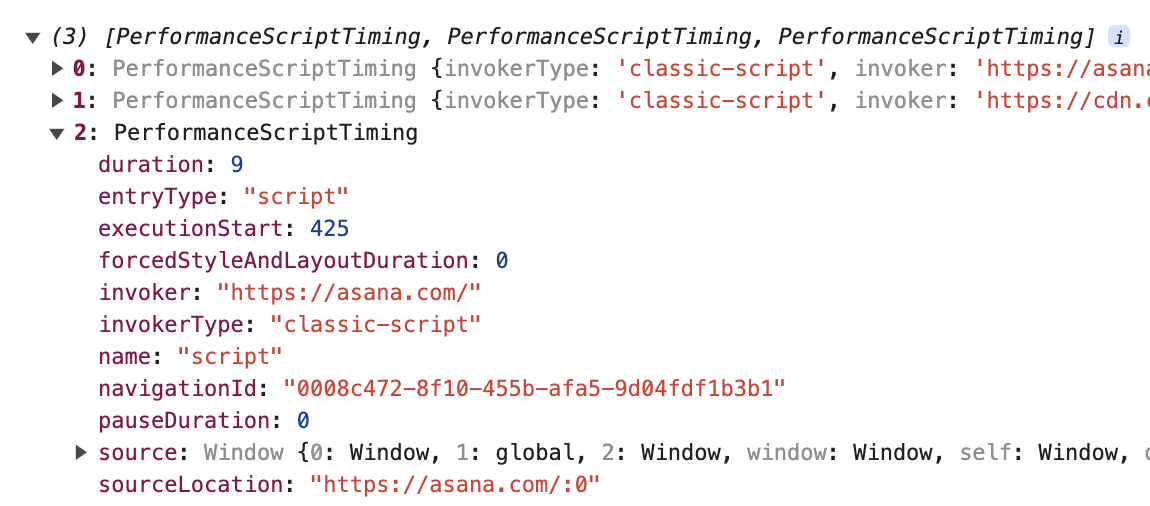
The Long Animation Frames (LoAF) API reports what scripts are contributing to rendering delays. This is especially useful when a rendering delay occurs at the time when a user interacts with the page.
performance.getEntriesByType("long-animation-frame");
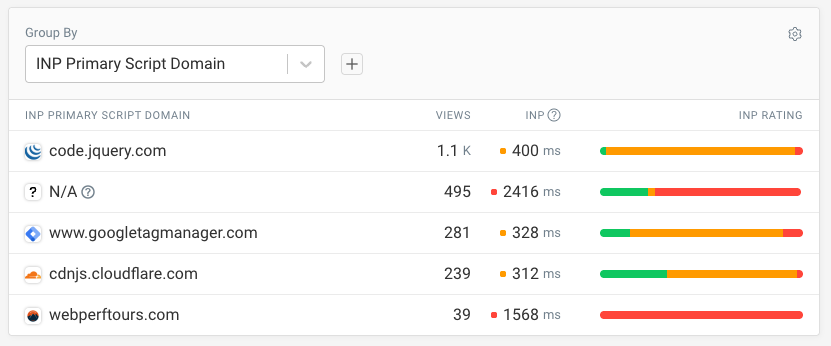
DebugBear RUM provides support for the Long Animation Frames API automatically and lets you break down long frames by script domain, file name, or function name.
If you're using our Real User Monitoring service but find missing attribution data from your dashboard, you can learn How To Fix Missing INP Attribution Data With The LoAF API.
You can also look at individual page views in your data to see what scripts ran, when they ran, and how they contributed to each of the INP component metrics.
Monitoring Interaction to Next Paint
DebugBear can help you keep track of your INP scores using both Google CrUX data and detailed real user monitoring.
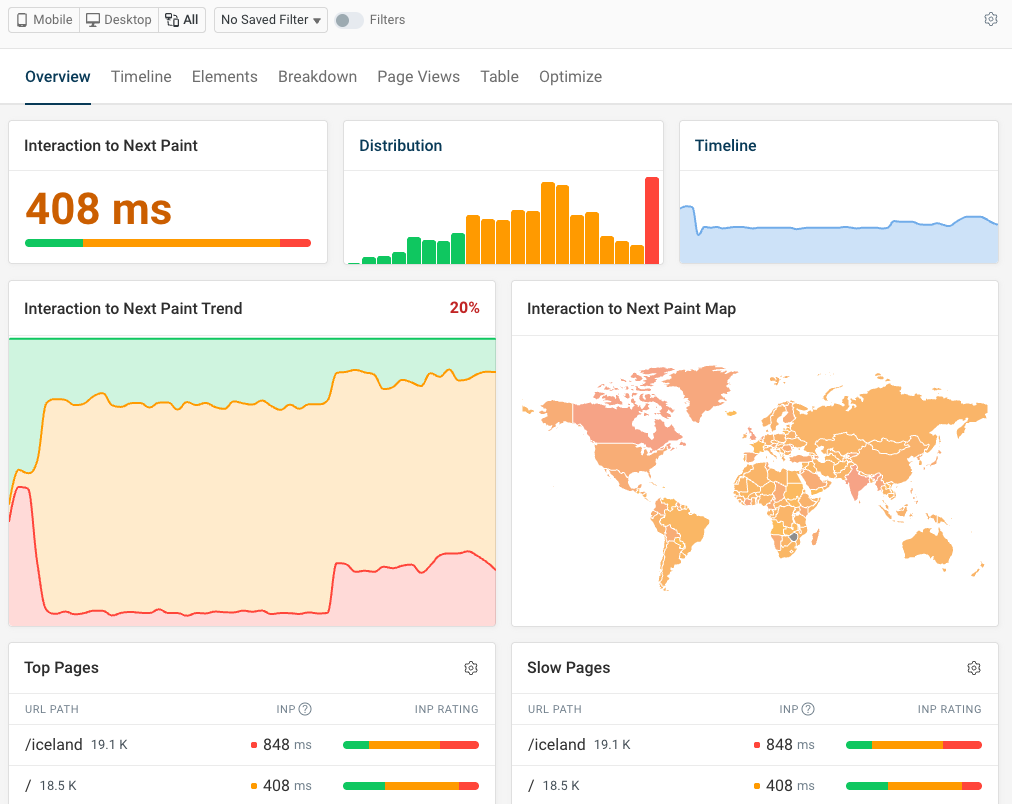
Here you can see our INP overview dashboards, telling you:
- The overall INP score for the selected pages
- How interaction delays are distributed among your visitors
- How your INP score has changed over time
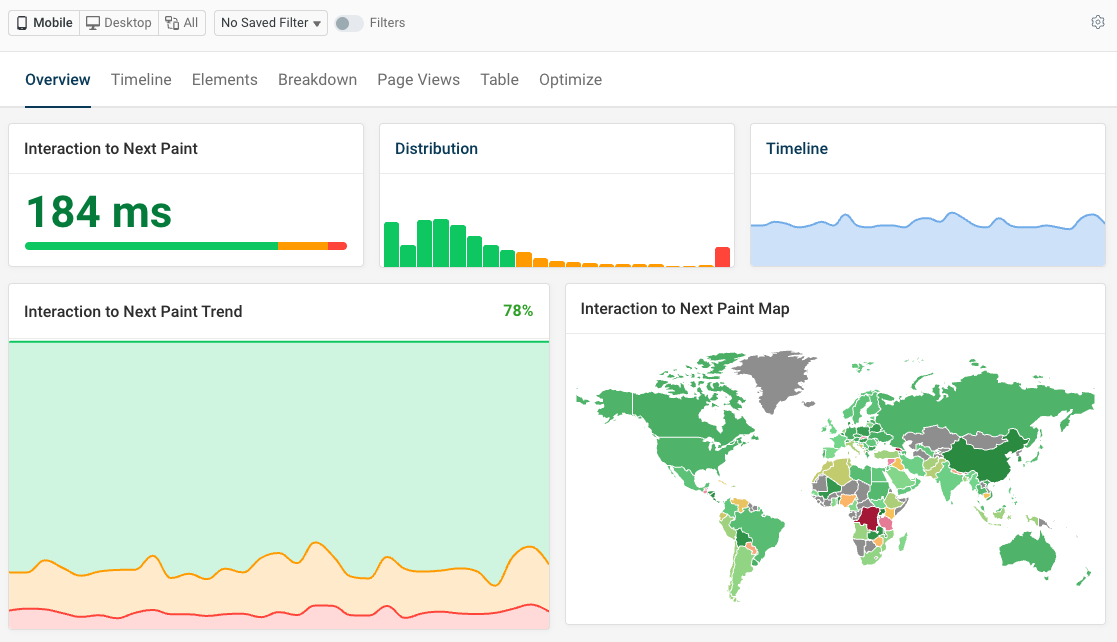
Based on that you can then dive more deeply into specific pages on your website, or break down performance between page templates.
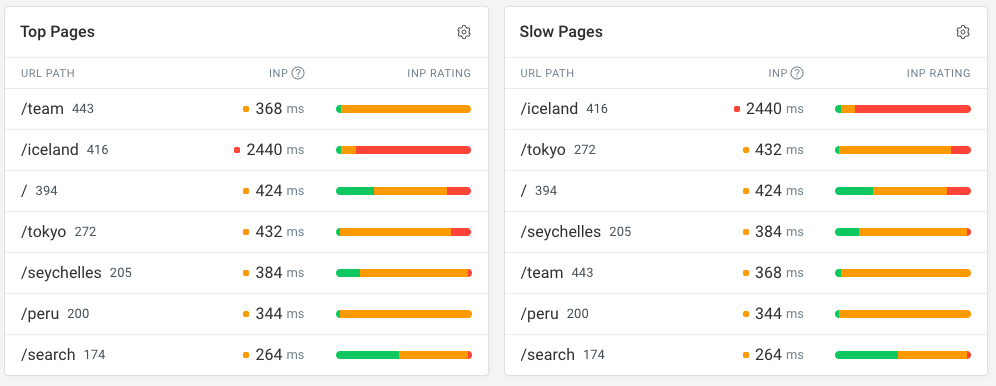
Check the Top Pages to see whether the pages that get the most traffic provide a good visitor experience. In addition to that, DebugBear also highlights specific slow pages where you should investigate poor performance.
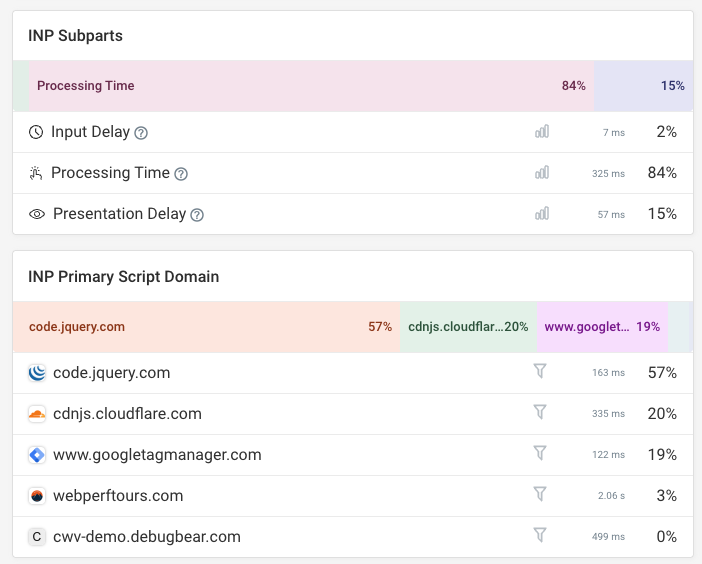
You can also see a breakdown of the three INP metric components as well as a list of scripts that are slowing you down.
Seeing this data at a site-wide level allows you to see what kind of optimizations you should focus on to have the most impact.


Monitor Page Speed & Core Web Vitals
DebugBear monitoring includes:
- In-depth Page Speed Reports
- Automated Recommendations
- Real User Analytics Data