
Soft navigation reporting is an experimental feature of Google’s Web Vitals initiative. It allows you to measure Core Web Vitals and other metrics for dynamic URLs in single page applications.
In this tutorial, we’ll look into how you can report Core Web Vitals from a React application to the console.
To learn more about soft navigation reporting and Core Web Vitals, check out our article on the subject which discusses the theoretical background and the details of the technical implementation.
Prerequisites
To get started with setting up soft navigation reporting in a React application, you’ll need:
- a working React app
- the Chrome browser (used in Incognito mode which disables browser extensions, and thus excludes their potential performance effects from the results)
- Node.js and npm (Node.js package manager) installed on your computer
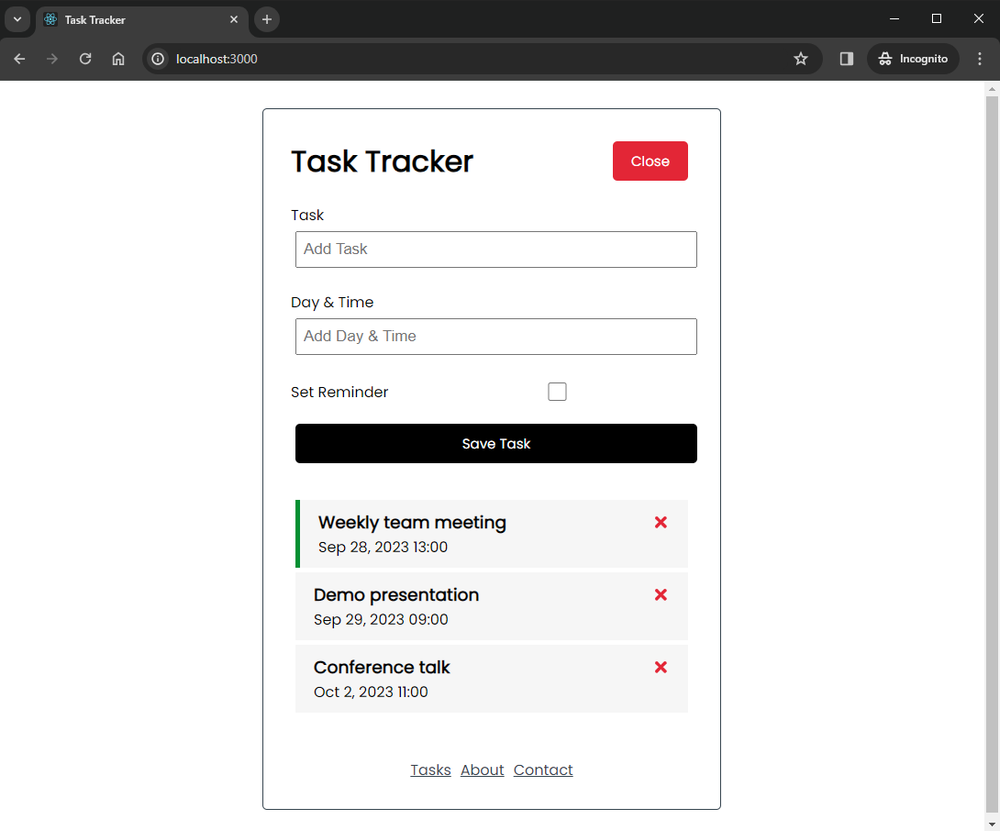
I’ll use a basic task tracker app built with the Create React App tool, which is the officially supported way of creating a React application. The application is an enhanced version of Brad Traversy’s demo app used in his React crash course (I’ll refer to it as ‘demo app’ throughout the tutorial).
We’ll also use the experimental soft-navs branch of Google’s web-vitals.js library, which we’ll add as an npm package to the project.
Below, you can see a screenshot of the demo app we’ll use throughout the tutorial:
Examples of Soft Navigations in the Demo App
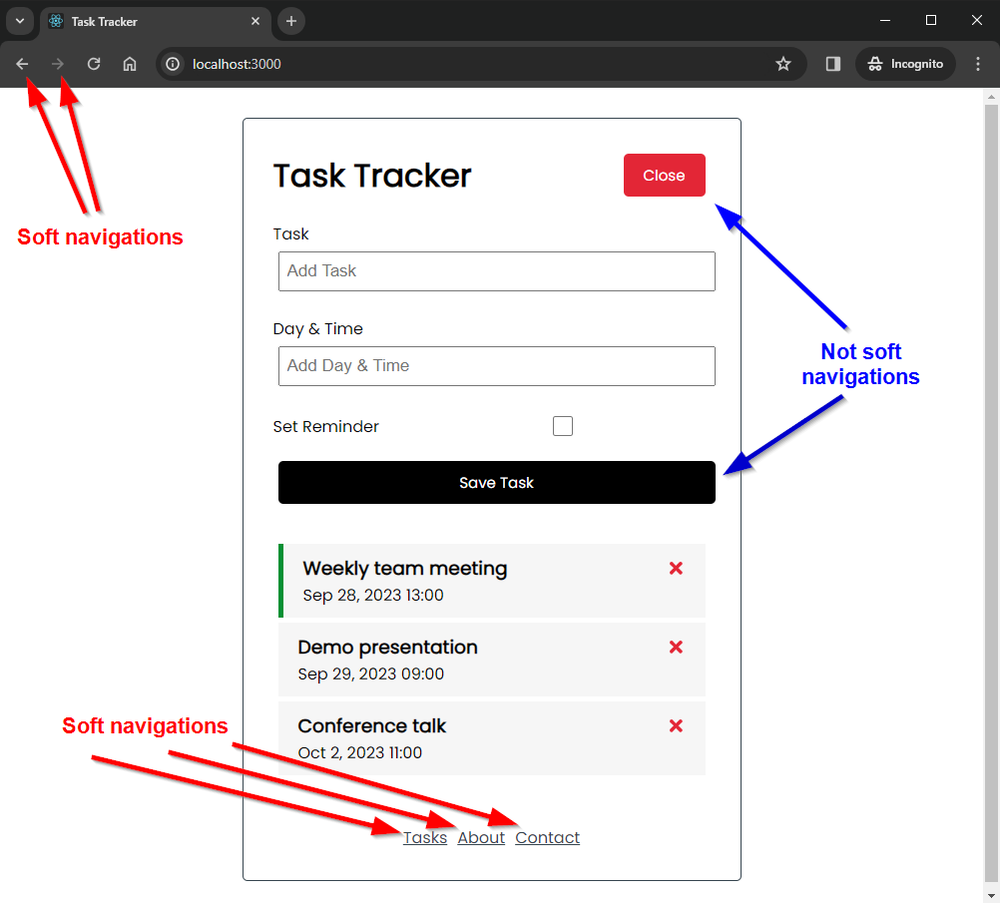
First, let’s see which links and actions qualify as soft navigations in the demo application.
Every dynamic URL change that’s visible in the browser’s address bar (i.e. clicking the links in the footer menu and the Back and Forward buttons in the browser), counts as soft navigation.
Other clicks, such as clicking the ‘Close’ and ‘Save Task’ buttons, don’t qualify as soft navigations because the URL and the browser history didn’t change:
1. Enable Soft Navigation Reporting in Google Chrome
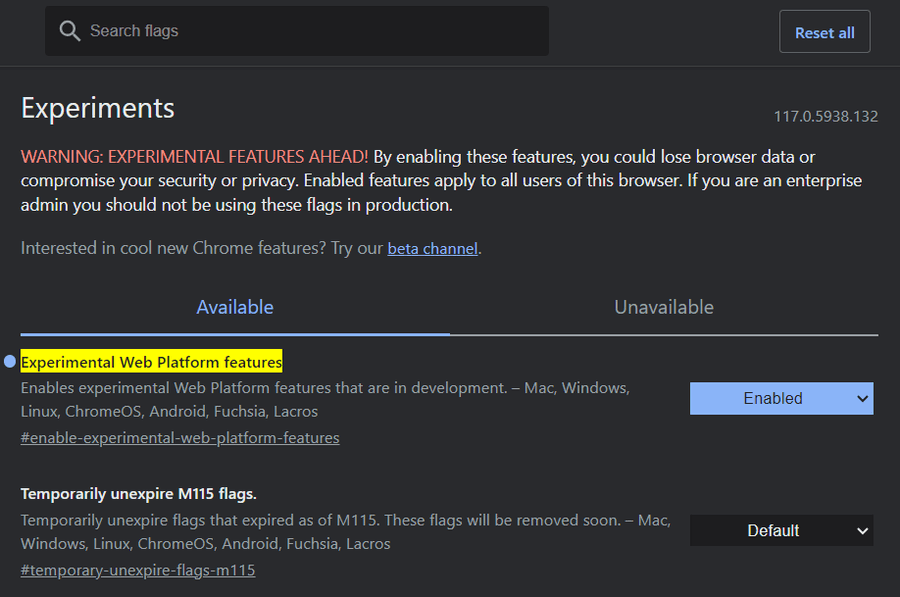
Soft navigation reporting is currently an experimental feature in Google Chrome. To use it, you need to enable the ‘Enable Experimental Web Platform Features’ flag in the browser.
To do so, type the chrome://flags/#enable-experimental-web-platform-features URL into the browser’s address bar and select the Enabled option in the dropdown that shows up next to the feature:
Once the Experimental Web Platform features are enabled, restart the browser in Incognito mode, start your React application, and open your Chrome DevTools by hitting the F12 key.
In the DevTools, go to the Console tab, and start interacting with the app. As you click an in-app link or the browser’s Back or Forward button, a message will appear in the console that informs you that a soft navigation has been detected and shows the updated URL:
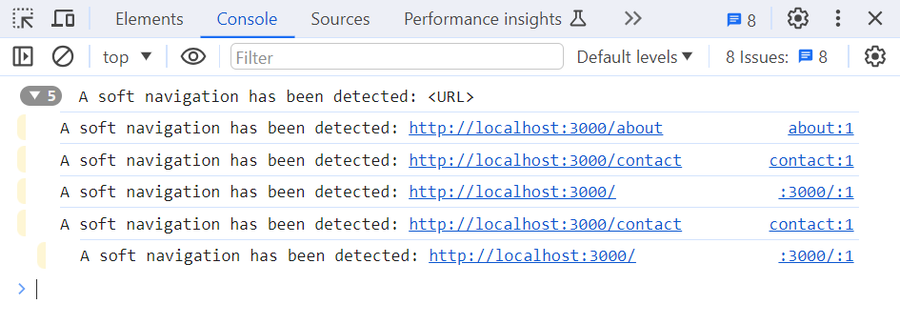
Note that enabling the Experimental Web Platform features flag doesn’t report Core Web Vitals to the console, just detects the occurrence of a soft navigation.
2. Show Hard Navigations in the Console
You can also show hard navigations in the console by enabling the Preserve log console feature.
This can be useful if you want to see the difference between hard (static, triggered by HTML) vs. soft navigations (dynamic, triggered by JavaScript). Without the preserve log feature enabled, the console clears when a hard navigation (e.g. a page reload) happens. When it’s enabled, it reports a ‘Navigated to [URL]’ message to the console on every hard navigation.
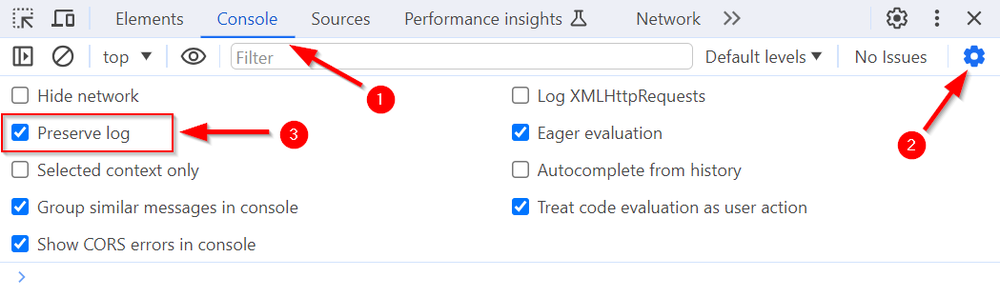
You can enable it by clicking the small gear icon in the top-right corner of the Console tab that opens the console’s settings and checking the Preserve log option:
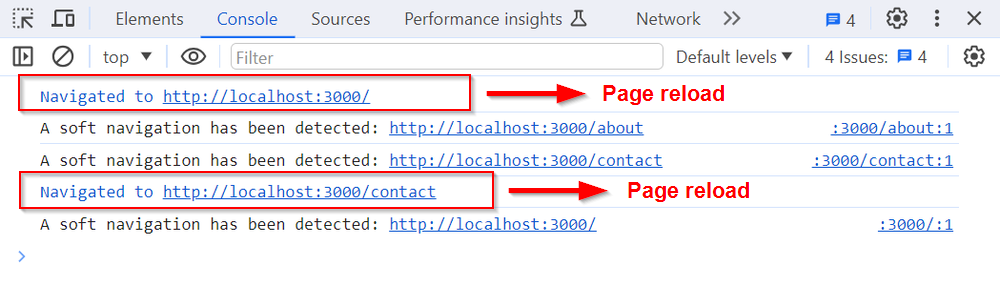
 As you can see in the screenshot below, now Chrome DevTools reports both soft and hard navigations to the console:
3. Adding the Soft Navigation Branch to the React App
Now, it’s time to add the soft navigation branch of the web-vitals library to the React application.
By default, the Create React App adds an older version (v2.1.4) of the web-vitals library to the project. By installing the soft-navs branch, it will be updated to the latest version.
Note that as the soft-navs branch is synced with the main branch, you don’t have to add both branches to your project — you can use all the features of the default library if the soft-navs branch is added to your project.
Open your command line and run the following command:
npm i web-vitals@soft-navs
The new addition should appear in your package.json file among your dependencies as follows:
"dependencies": {
	"web-vitals": "^3.5.0-soft-navs-10"
}
4. Report Largest Contentful Paint for Soft Navigations
While you can use the soft-navs branch of the web-vitals library to report six Web Vitals (TTFB, FCP, LCP, CLS, FID, INP), let’s start with adding only Largest Contentful Paint (LCP) to make it easier to read the console log.
In your React app, you’ll have to edit two files (assuming it was created with the Create React App library):
src/reportWebVitals.js(see the source file on GitHub)src/index.js(see the source file on GitHub)
Note that the third major release (v3) of the web-vitals library uses a different syntax than the previous versions — the names of the methods have changed from getLCP, getFID, getCLS, etc. to onLCP, onFID, onCLS, etc.).
To add soft navigations to the Largest Contentful Paint reporting performed by the web-vitals library, change your reportWebVitals.js file as follows (now it will report both soft and hard navigations for LCP):
const reportWebVitals = (onPerfEntry) => {
  if (onPerfEntry && onPerfEntry instanceof Function) {
    import("web-vitals").then(({ onLCP }) => {
      onLCP(onPerfEntry, { reportSoftNavs: true });
    });
  }
};

export default reportWebVitals;
To make the LCP values appear in the console, add the following line to the end of the src/index.js file:
reportWebVitals(console.table);
I’ve used the console.table method above as it reports the log data in an easy-to-read table format, but alternatively, you could also use console.log or console.trace.
In the screenshot below, you can see how Largest Contentful Paint has been reported for hard vs soft navigation to the console (note that sometimes you need to wait for a few seconds until the data appears in the console):
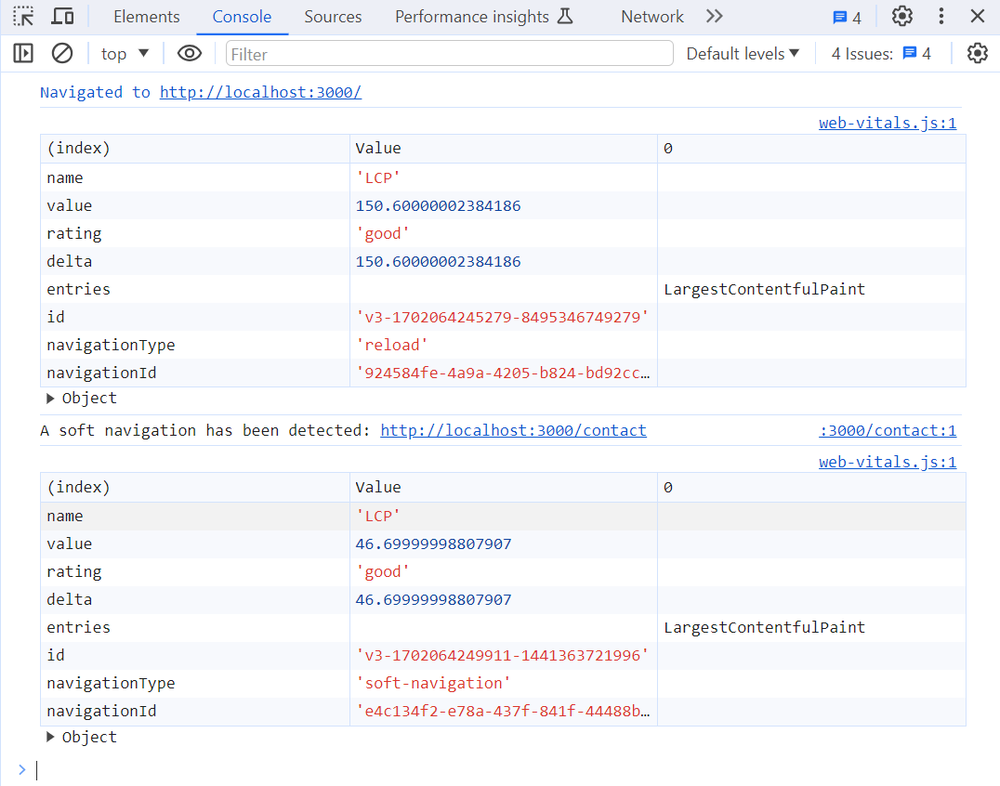
The first result is a static (hard) navigation, which was reported when I reloaded the React app (its navigationType is reload). Its LCP value is 150.6 milliseconds, which gets the ‘good’ rating.
The second result is a dynamic (soft) navigation, which was reported when I clicked the ‘Contact’ footer link inside the application (its navigationType is soft-navigation). As could be expected, it has a much lower LCP value (46.69 milliseconds) than the hard navigation because the single page application was already loaded in the browser.
5. Report Soft Navigations for All the Web Vitals
If you want to add soft navigation reporting to all the available Web Vitals, change the code in the reportWebVitals.js file as follows:
const reportWebVitals = (onPerfEntry) => {
  if (onPerfEntry && onPerfEntry instanceof Function) {
    import("web-vitals").then(
      ({ onTTFB, onFCP, onLCP, onCLS, onFID, onINP }) => {
        onTTFB(onPerfEntry, { reportSoftNavs: true });
        onFCP(onPerfEntry, { reportSoftNavs: true });
        onLCP(onPerfEntry, { reportSoftNavs: true });
        onCLS(onPerfEntry, { reportSoftNavs: true });
        onFID(onPerfEntry, { reportSoftNavs: true });
        onINP(onPerfEntry, { reportSoftNavs: true });
      }
    );
  }
};

export default reportWebVitals;
Depending on which metrics you want to collect, remove the respective lines from the code snippet above.
Conclusion
In this tutorial, we looked into how you can add soft navigation reporting for Web Vitals to a React app, but you can implement it in any other JavaScript UI frameworks and native JavaScript too.
While soft navigation reporting is still in an experimental phase, adding it to your React or other single page application can help you:
- better understand how Web Vitals change as people are using your application
- your SPA will be less of a black box performance-wise
- identify performance issues and improve the user experience
For more details, check out our article on the theoretical background of soft navigation reporting, too.


Monitor Page Speed & Core Web Vitals
DebugBear monitoring includes:
- In-depth Page Speed Reports
- Automated Recommendations
- Real User Analytics Data