A new Optimize tab, better detection of parser blocking resources, the RUM Metrics API, and more educational content. Here's what's new in DebugBear for May 2024.
A new Optimize tab
We heard you loud and clear: you want to make sense of your Real User Monitoring data, but you don't always know where to start.
The Optimize tab is a new feature that guides you through the process of identifying and fixing the most significant issues affecting your INP score, giving you a clear path to follow along with custom recommendations tailored to your results.
-
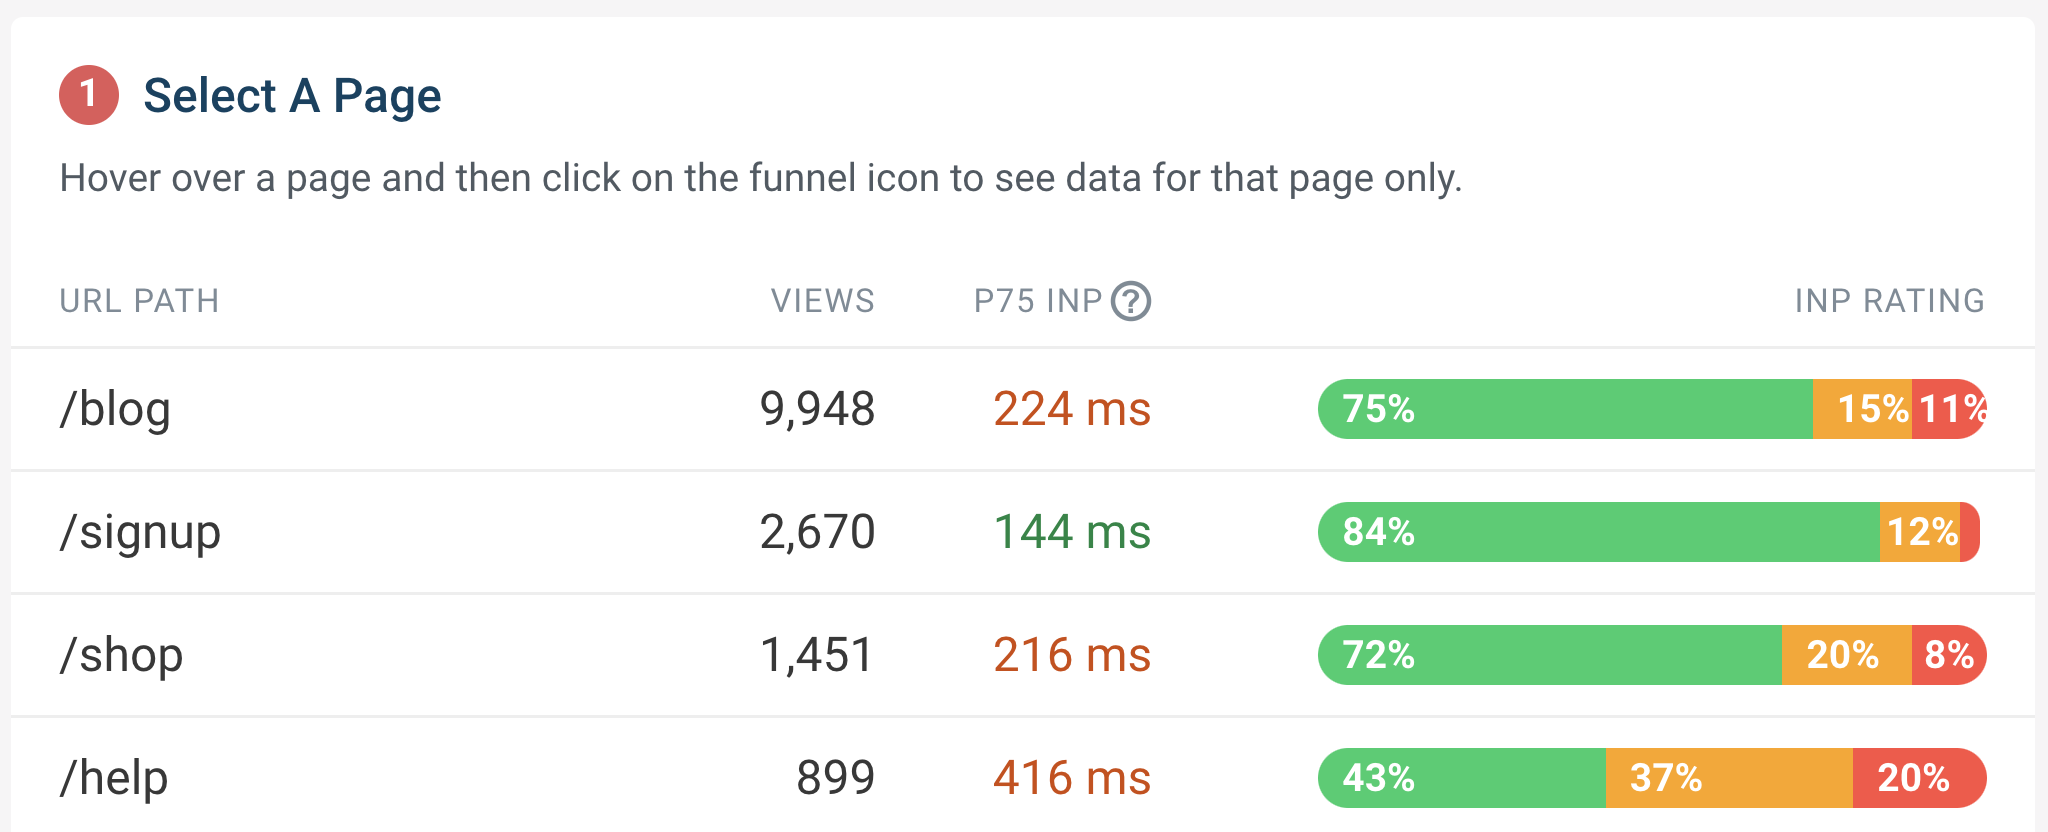
Select A Page: Narrow down the page you want to optimize.
-
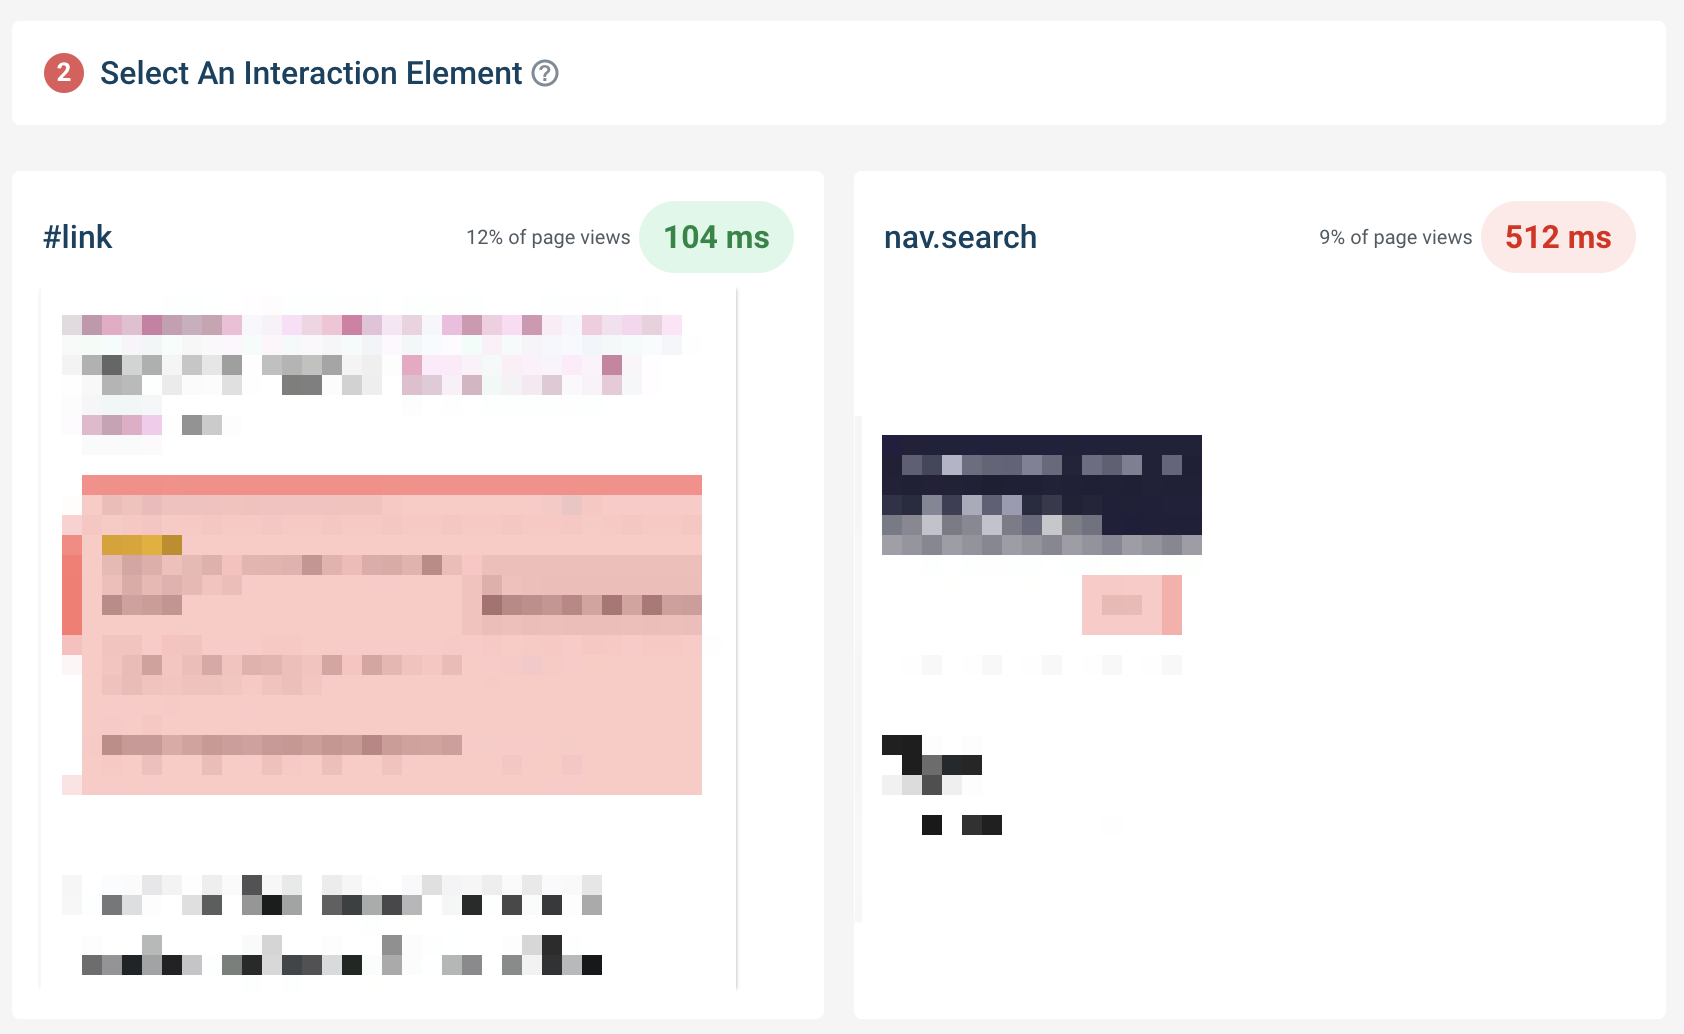
Select An Interaction Element: Focus on a specific element so the remaining steps are tailored to its interaction.
-
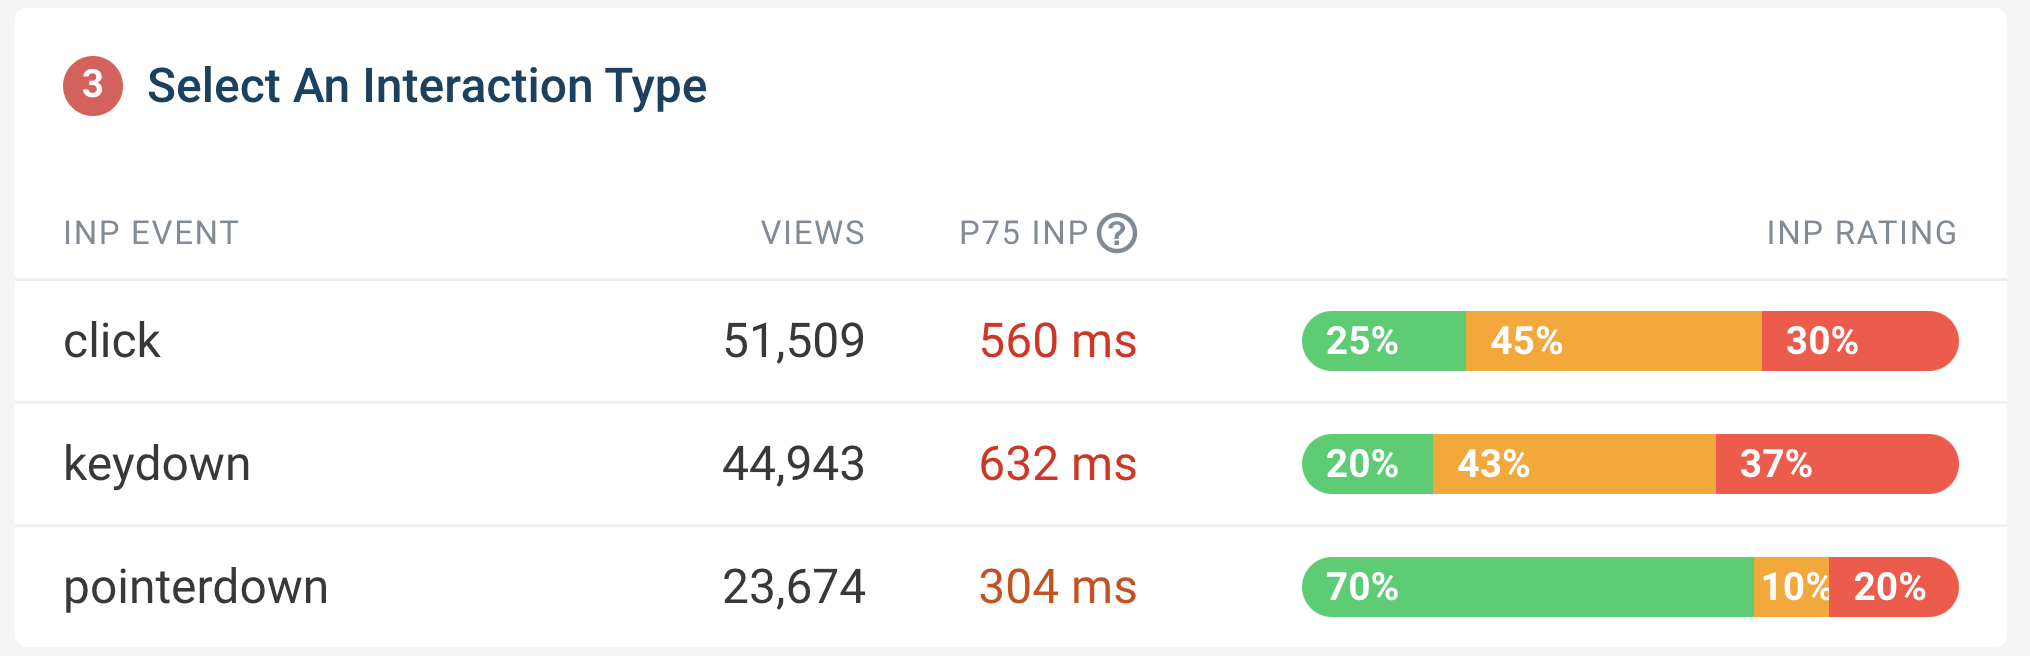
Select An Interaction Type: Choose the type of interaction you want to optimize, such as a click.
-
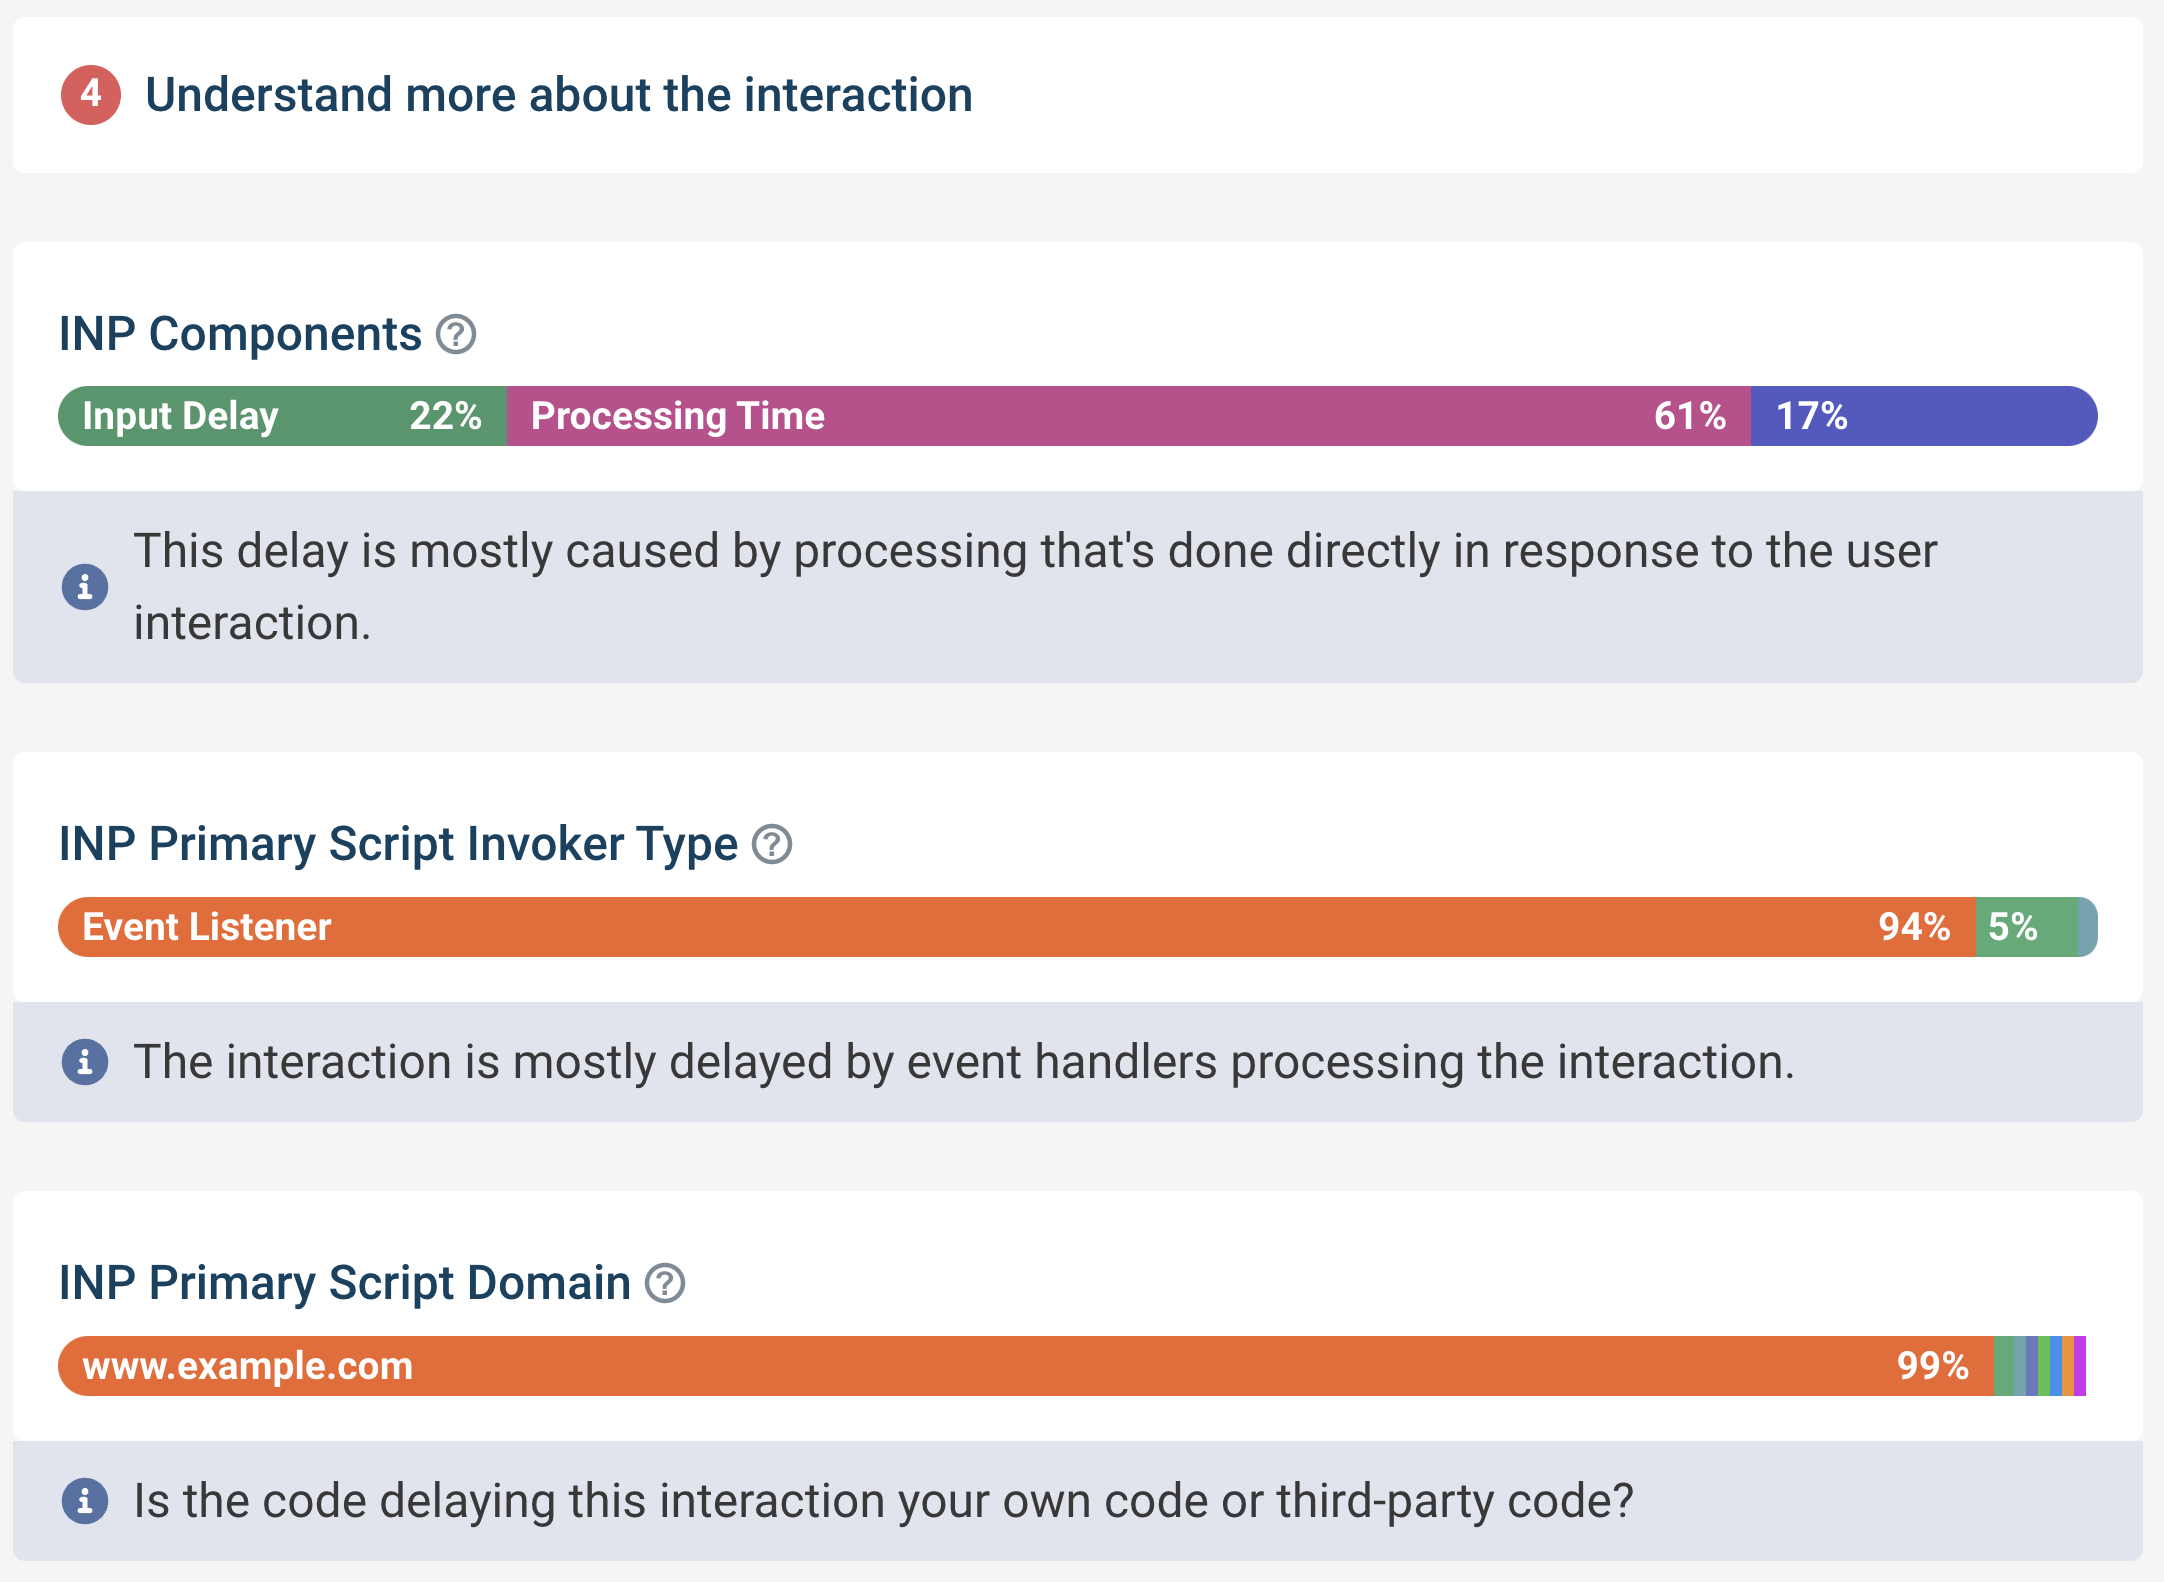
Understand more about the interaction: Look through the INP Component Breakdown, INP Primary Script Invoker Type, and INP Primary Script Domain charts to understand what part of the interaction is slow, and what script is causing the slowdown.
-
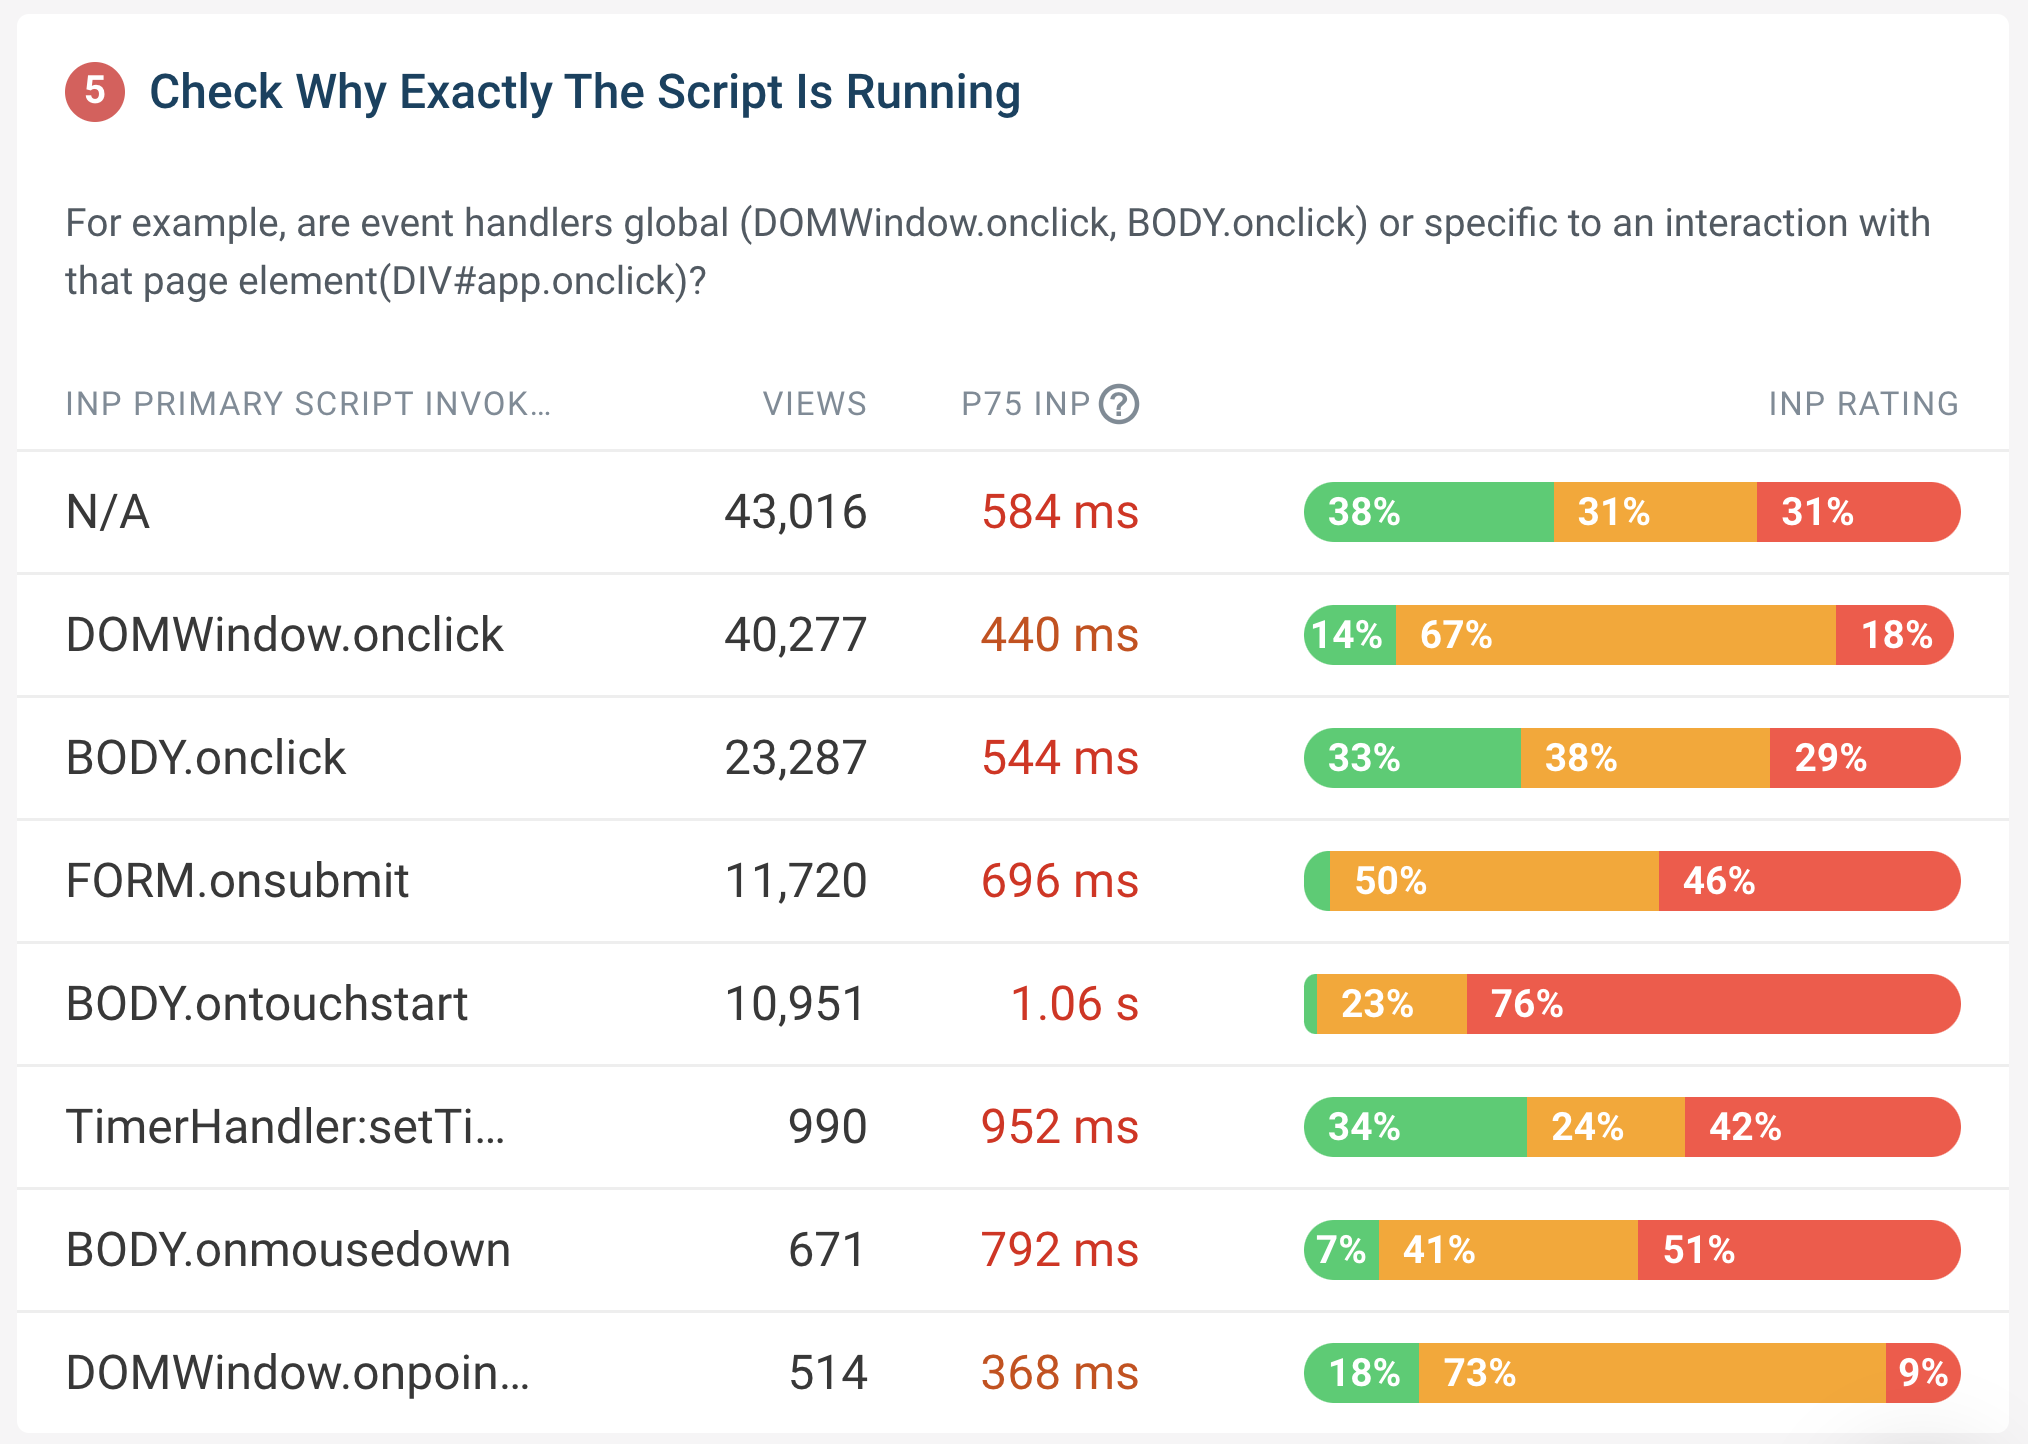
Check Why Exactly The Script Is Running: Identify how the script is invoked, for example if it's through an event handler or timer interval.
-
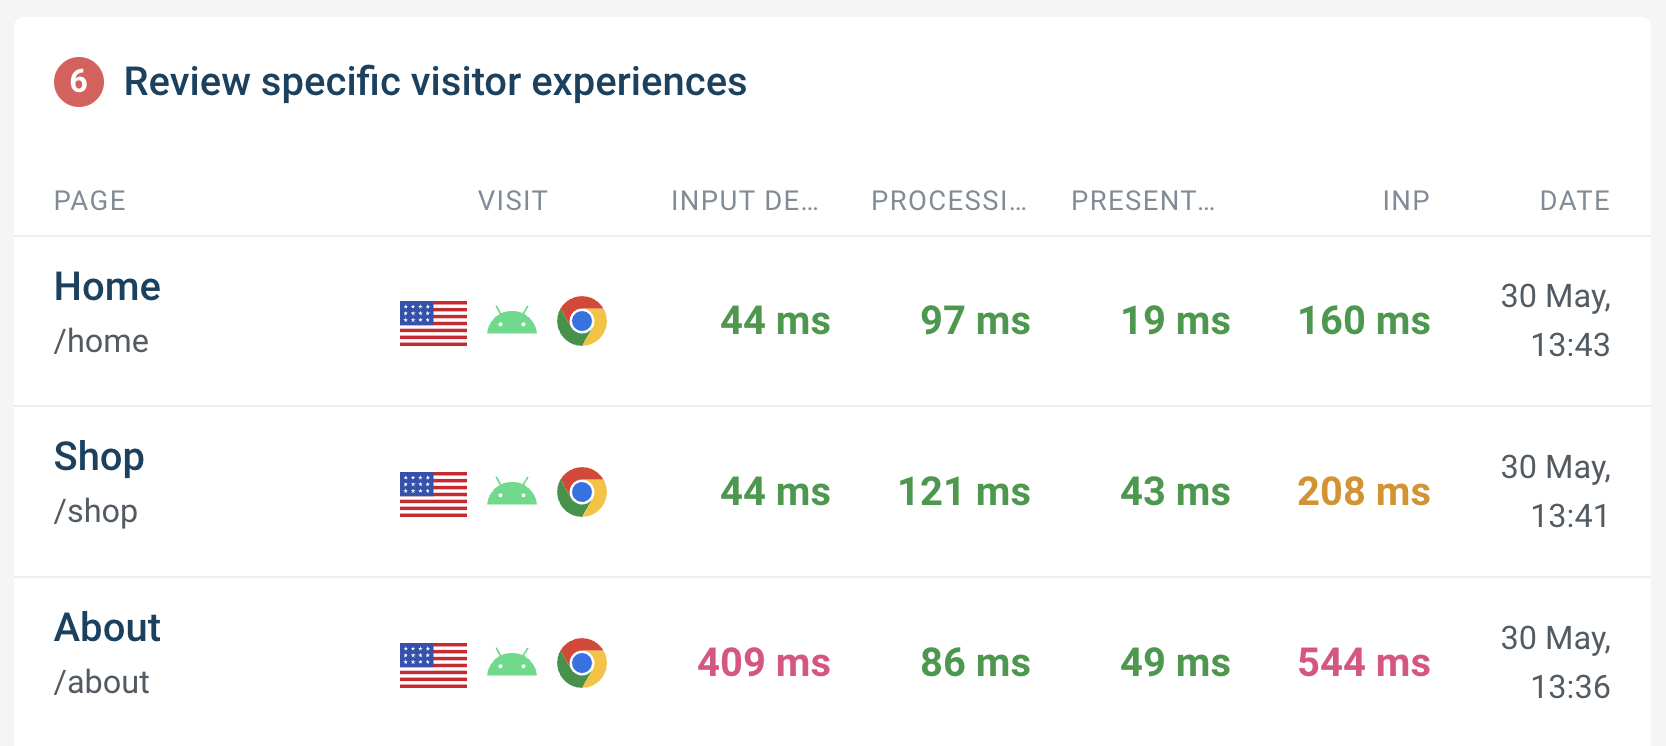
Review specific visitor experiences: Drill down into specific page views to understand the journey of a visitor who experienced a slow interaction.
You can find the new Optimize tab from a DebugBear project that uses real user monitoring: RUM > INP > Optimize. From there, follow the guided steps to identify and fix the most significant issues affecting INP score.
The RUM Metrics API
RUM data is now available via the DebugBear API. This means you can access your Real User Monitoring data programmatically, which can be especially useful when you have unique reporting requirements or want to integrate RUM data into your existing workflows.
For example, you might have an internal dashboard showing bounce rates on your website. Being able correlate bounce rates with aggregate RUM metrics can help you understand how performance impacts user behavior.
Here's the API documentation, and a code example to get you started:
JavaScript Code:
import { DebugBear } from "debugbear";
const debugbear = new DebugBear(process.env.DEBUGBEAR_API_KEY);
const projectID = `<your project ID>`;

const results = await debugbear.projects.getRumMetrics(projectID, {
  groupBy: "urlPath",
  device: "mobile",
});

console.log(results);
The resulting data looks like this:
{
  info: {
    groupBy: 'urlPath',
    stat: 'p75',
    from: '2024-04-30T12:03:39.010Z',
    to: '2024-05-30T12:03:39.010Z'
  },
  lcp: [
    { count: 2500, urlPath: '/home', value: 1500 },
    { count: 1800, urlPath: '/about', value: 2000 },
    { count: 1200, urlPath: '/contact', value: 1800 },
    ...
  ],
  cls: [
    { count: 3000, urlPath: '/home', value: 0.08 },
    { count: 1500, urlPath: '/shop', value: 0.05 },
    { count: 1000, urlPath: '/about', value: 0.03 },
    ...
  ],
  inp: [
    { count: 2200, urlPath: '/blog', value: 250 },
    { count: 1800, urlPath: '/home', value: 200 },
    { count: 1000, urlPath: '/product', value: 400 },
    ...
  ],
  fcp: [
    { count: 4000, urlPath: '/home', value: 1200 },
    { count: 2500, urlPath: '/shop', value: 1800 },
    { count: 1500, urlPath: '/blog', value: 1500 },
    ...
  ],
  ttfb: [
    { count: 3500, urlPath: '/home', value: 900 },
    { count: 2000, urlPath: '/about', value: 1100 },
    { count: 1200, urlPath: '/contact', value: 1000 },
    ...
  ]
}
Better detection of parser blocking resources
DebugBear can indicate when a resource is render-blocking or parser-blocking, but now also detects when a resource is parser-blocking for the level 1 heading element (<h1>).
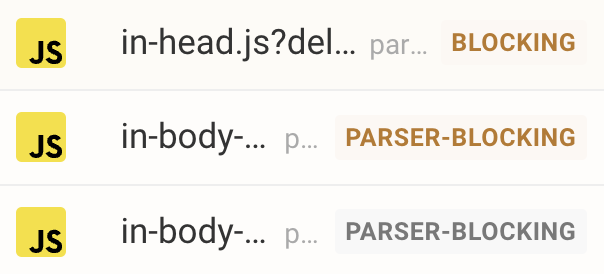
You can use this information to prioritize which resources to optimize first, based on the impact they have on the most important parts of your page.
Read the full documentation to learn more about render-blocking resources, parser-blocking resources, and how to locate them in your page using DebugBear.
New articles and videos
Articles
-
We tested 5,000 Chrome extensions to see how they impact page performance.
Lots of popular extensions here, you might find the results surprising! This also got featured on MSN, TechRadar, Mashable and more.
-
Understand the impact of render-blocking scripts on your website’s performance with our in-depth guide.
What's the difference between render-blocking and parser-blocking? How can you detect render-blocking scripts in a page? There's also an interactive demo for you to follow along with.
Videos
-
Understanding request waterfalls is key to understanding website performance. In this video, we show you how to read and interpret a waterfall chart.
The request waterfalls within DebugBear are packed full of useful information, from identifying the LCP element to showing you slow JavaScript code. This video helps you make sense of it all.
-
Learn to Improve site speed by optimizing render-blocking scripts in this video tutorial.
A practical walkthrough on using DevTools and DebugBear to optimize render-blocking scripts.