
A lot goes into web page performance. One key factor is the resources that a page loads, such as scripts and stylesheets. Having too many resources, or having resources that are slow to download, can make for a poor user experience.
This post explains the effects that render-blocking scripts have on your web page, and how to detect such render-blocking scripts using DevTools and DebugBear - a website performance monitoring tool.
Introduction: the user impact of render-blocking requests
While there are times when you cannot avoid using render-blocking resources, it's important to understand the impact that these render-blocking resources have on your page load, but to also understand the workflow you can use to detect such render-blocking resources.
Check out the video below where we walk through several examples showing the real-world impact of render-blocking resources on page speed and user experience.
If you enjoy learning visually, this video is a helpful companion to the concepts explained in this post.
Note: The advice in this post is generally applicable to both scripts (JavaScript files) and stylesheets (CSS files), however this post focuses on scripts.
Slow progressive loading of a page, where entire components seem to appear bit by bit, is indicative of render-blocking scripts.
When a page loads too slowly, this can hurt your end user experience and can impact performance metrics like Core Web Vitals which are used by search engines to rank your page.
What is a render-blocking script?
A render-blocking script delays the loading and rendering of a page. In this example, a blocking.js file is referenced from a <script> tag in the HTML code. This blocking.js file is considered a render-blocking resource.
<!DOCTYPE html>
<html lang="en">
  <head>
    <title>Render-blocking JavaScript Example</title>
  </head>
  <body>
    <script src="blocking.js"></script>
    <h1>My Web Page</h1>
  </body>
</html>
This means that the heading (the <h1> element) is not rendered until the blocking.js script is fetched, parsed, and executed.
If you can use async or defer on such a script, that would help! However we appreciate that this isn't always possible.
Following on from the previous example, if you place the blocking.js script towards the end of the body, or at the very least, place the script after the heading, then the <h1> is rendered without waiting for the script to be fetched, parsed, and executed.
<body>
  <!-- The <h1> appears without having to wait for the script -->
  <h1>My Web Page</h1>
  <script src="blocking.js"></script>
</body>
Generally, browsers will attempt to progressively render your page. This means that browsers will render the page as soon as possible, even if some resources are still loading.
Render-blocking vs. parser-blocking
This post uses terms like parser-blocking and render-blocking somewhat interchangeably. While there can be subtle differences between them, they all refer to resources that affect the loading and rendering of a page.
When a browser encounters a render-blocking resource, it will not display the page content below that render-blocking resource.
When rendering is blocked because of a render-blocking resource, the browser will continue to parse the HTML code and construct the page contents. CSS is render-blocking by default.
A parser-blocking resource blocks rendering as well, but in addition it prevents the browser from continuing to parse the HTML and processing other resources in the page. JavaScript is parser-blocking by default.
A parser-blocking or render-blocking resource placed towards the end of the body can't block rendering of remaining page content, as there's no more content to render!
Note that when the browser's HTML parser encounters a stylesheet, the parser will not execute any scripts that come after the stylesheet until the CSS is fully loaded.
In theory parser-blocking resources are worse than merely render-blocking ones, as images or additional scripts or stylesheet won't be discovered until the parser reaches those HTML tags.
In practice this is rarely a problem, as the browser's preload scanner can quickly identify important resources that need to be downloaded, without pausing to run any scripts.
Visual progression of a page load
When a page has render-blocking scripts, the visual progression of the page load is affected as can be seen in the following video:
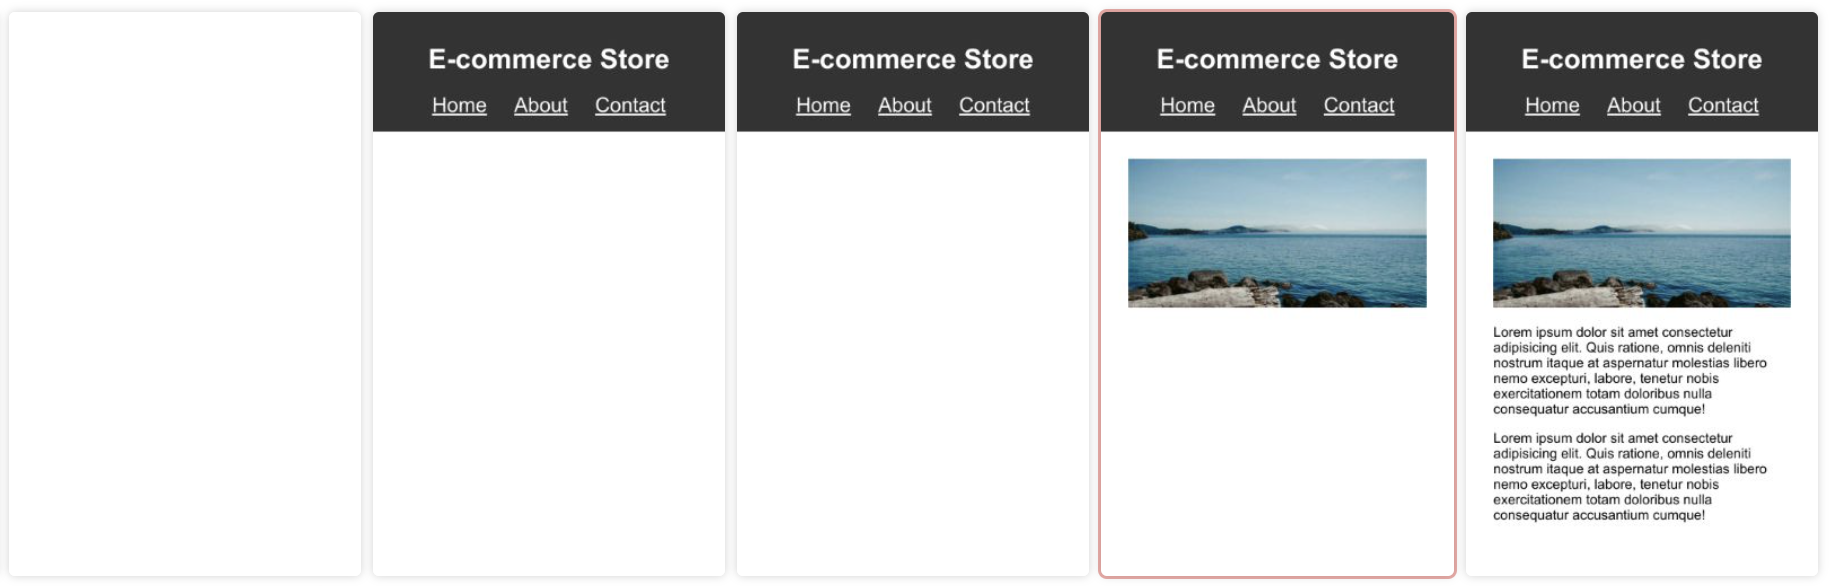
The previous video shows three state changes:
- From a blank page to just a header.
- From a header to the main image.
- From the main image to the text under the image.
Before each state change, render-blocking scripts are delaying the rendering of the page.
How to test render-blocking scripts
How you detect render-blocking scripts depends on the tool you are using. In this post, we'll discuss how to detect render-blocking scripts with DevTools, Lighthouse and DebugBear.
As a general approach, you want to correlate visual changes in the page load with the loading of any resources that the page is loading.
Detect render-blocking scripts with DevTools
Apart from the version of Lighthouse built into the DevTools, DevTools doesn't have a built-in feature to highlight render-blocking scripts. Instead you can:
- Correlate the loading of scripts with the visual changes in the page.
- Study the network waterfall + initiator chain to understand whether a script is render-blocking.
- Analyze the source code / DOM tree of the page to understand whether a page has render-blocking scripts.
Using this demo as an example, start by making a Network recording of a page load in DevTools.
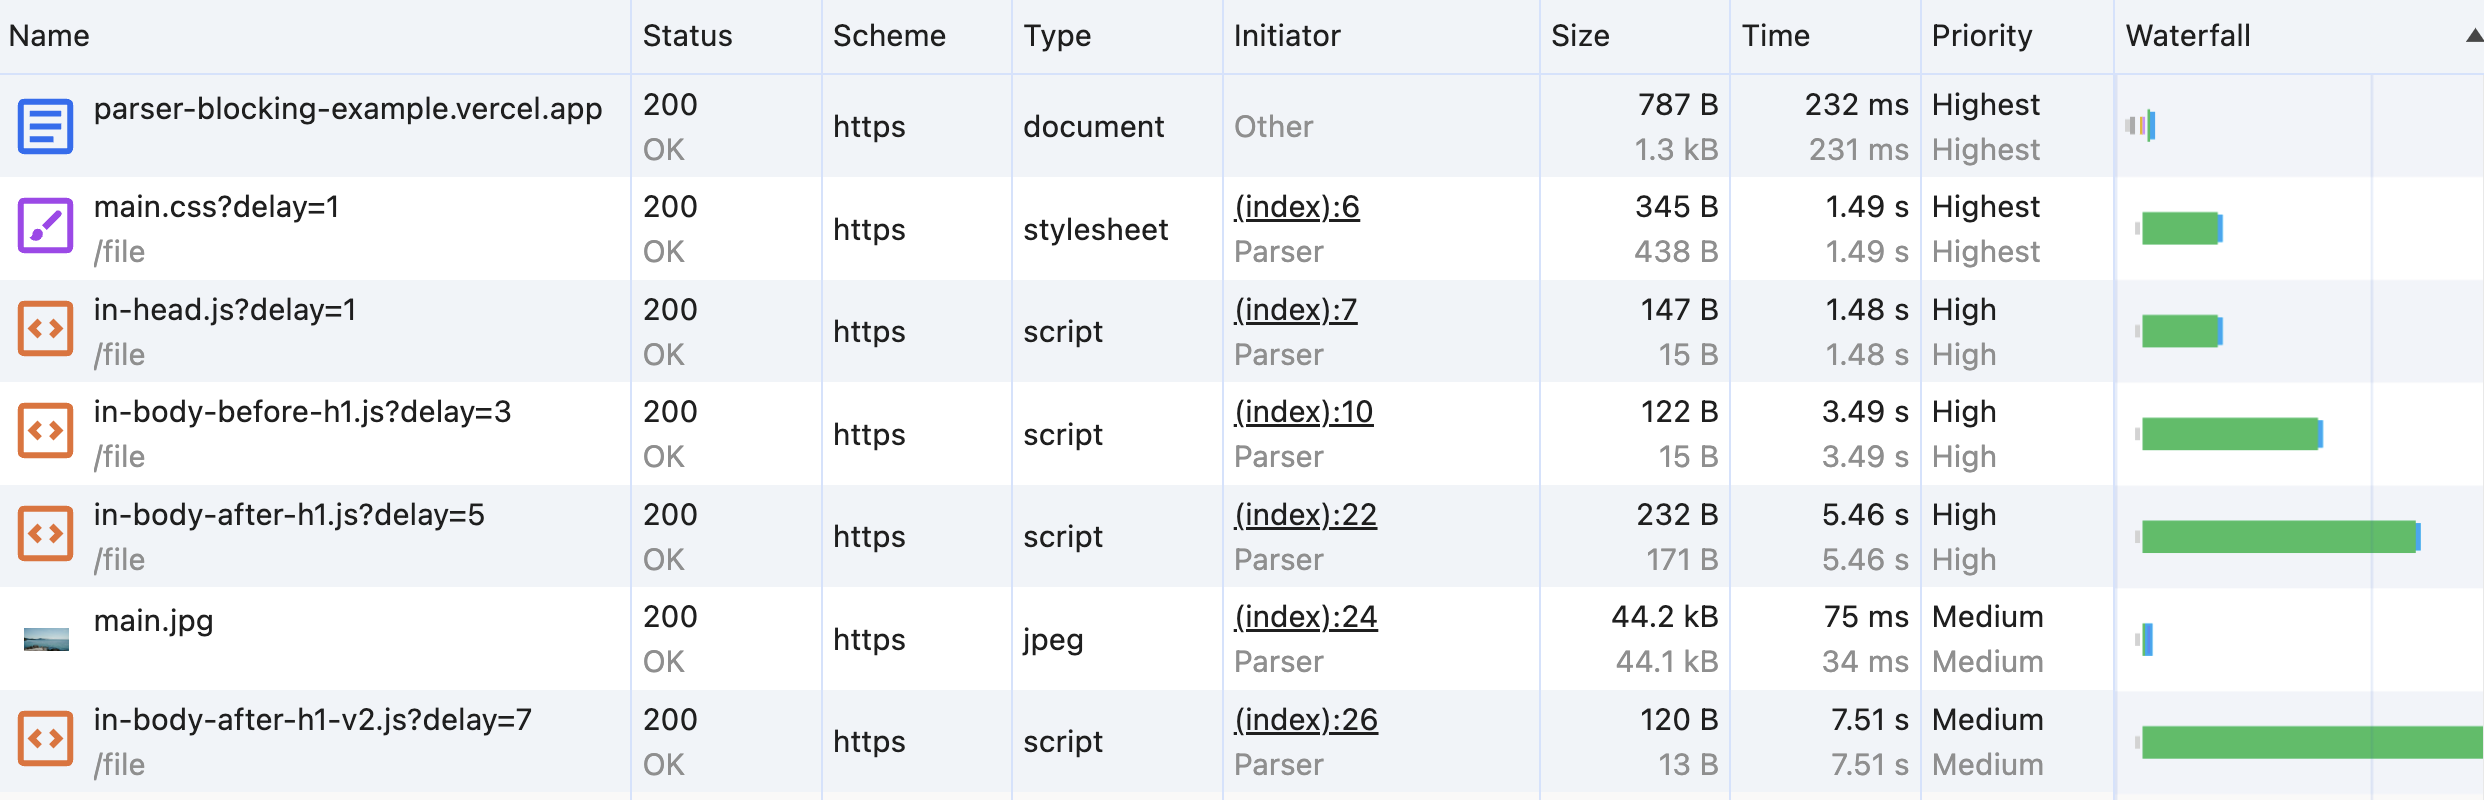
Looking at the screenshot, nothing stands out as being render-blocking. In fact, the parallel loading of resources is a good sign - but can also give a false sense of security.
You might think: the fact that the scripts are loading in parallel means they're not render-blocking. In this case, the browser's preload scanner is scanning the page and fetching resources in parallel - this is helpful, and has a positive performance impact, but there's still a problem.
The request waterfall in DevTools doesn't paint a strong picture of what problems our page might have, so as a next step, you can use the Performance panel to make a recording and match the network requests with the visual changes in the page.
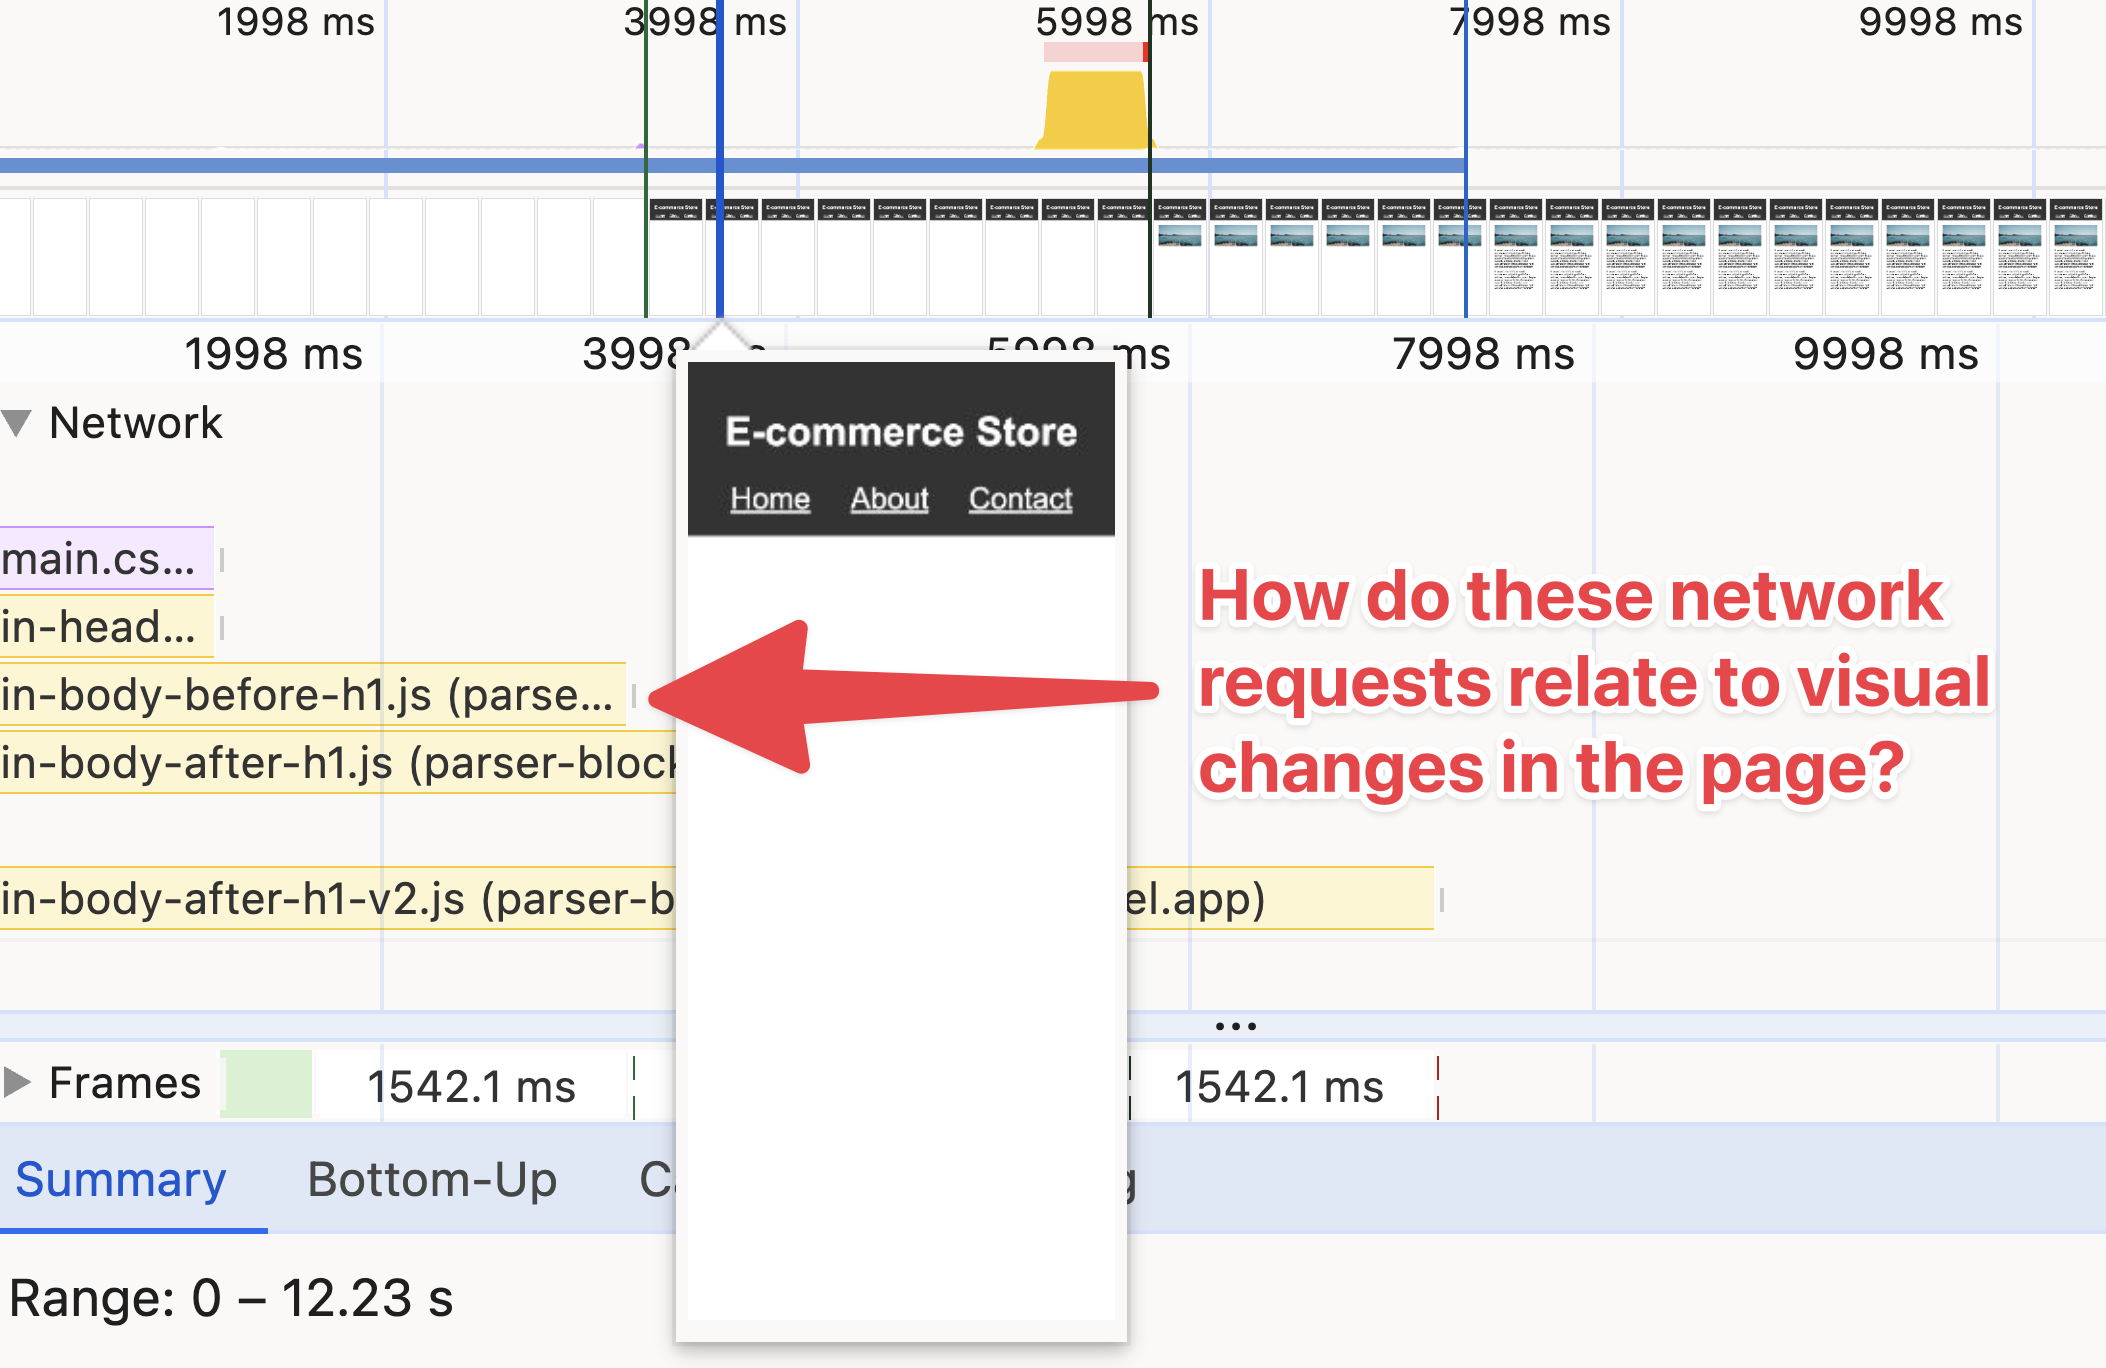
This is possible as the DevTools Performance panel shows you network requests alongside screenshots that have been frequently captured during the page load.
Once you identify a potential render-blocking script, you can click on the network request within the Performance profile, and find the file link in the Performance Summary pane.
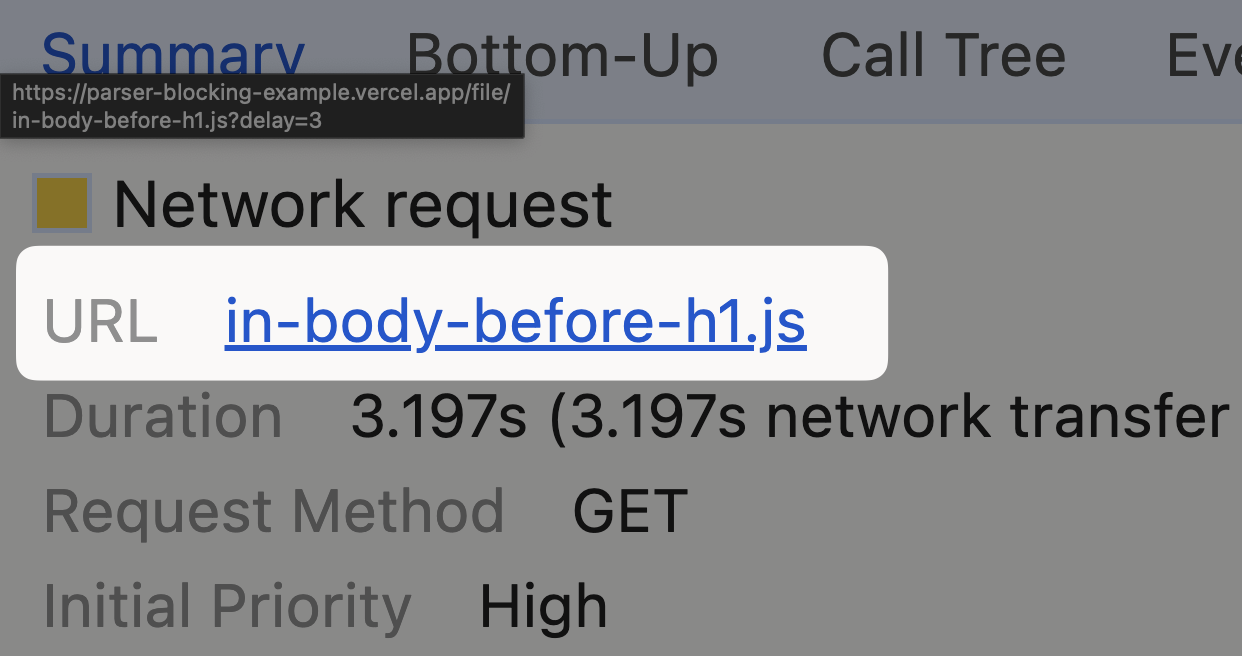
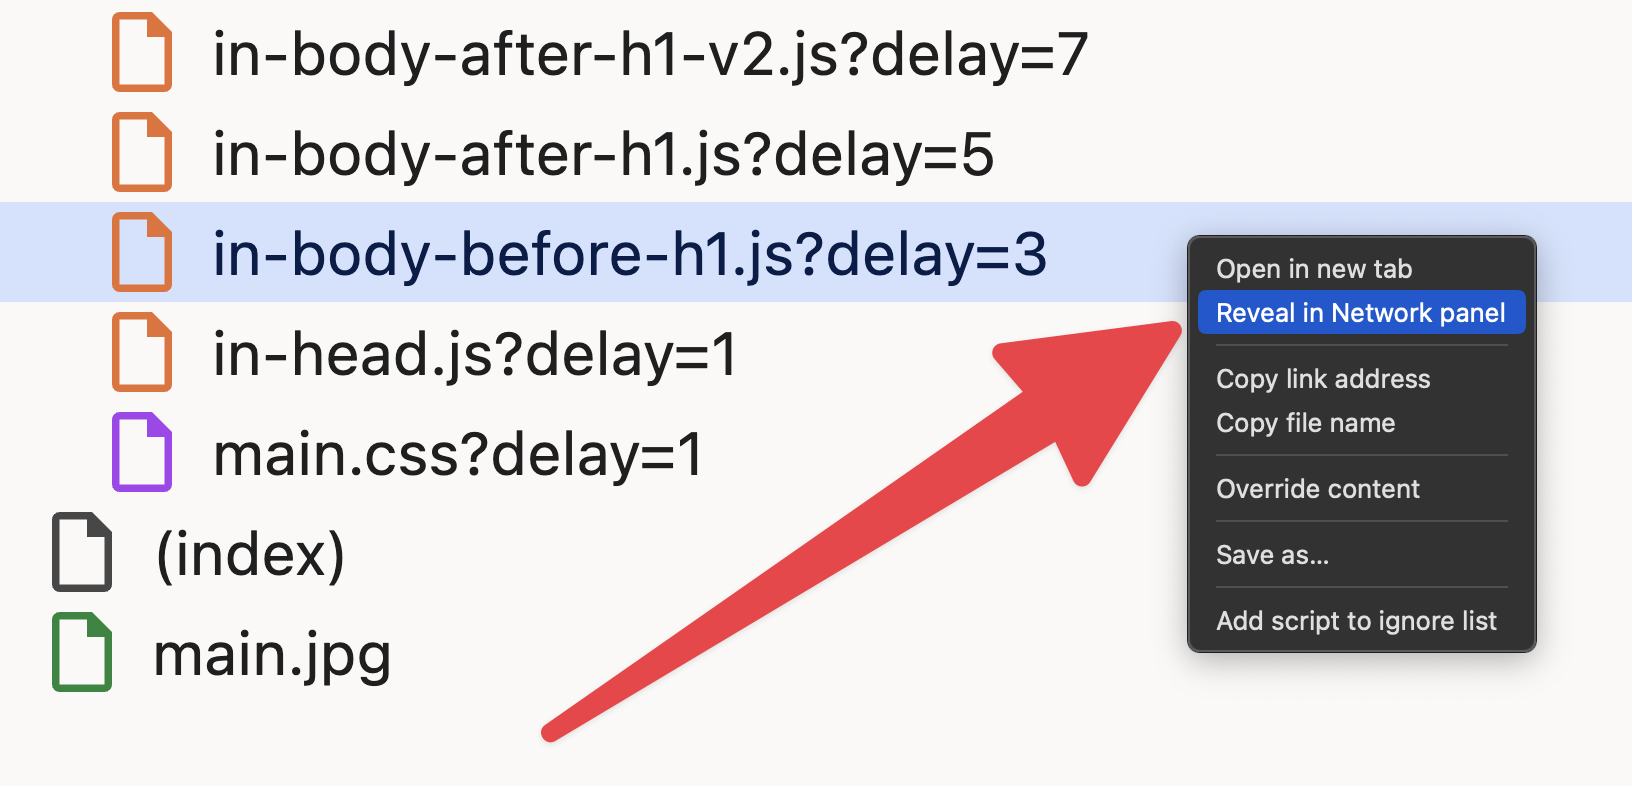
This takes you to the Sources panel that shows you the source code of the script. From here, you can right click on the script and select Reveal in Network panel:
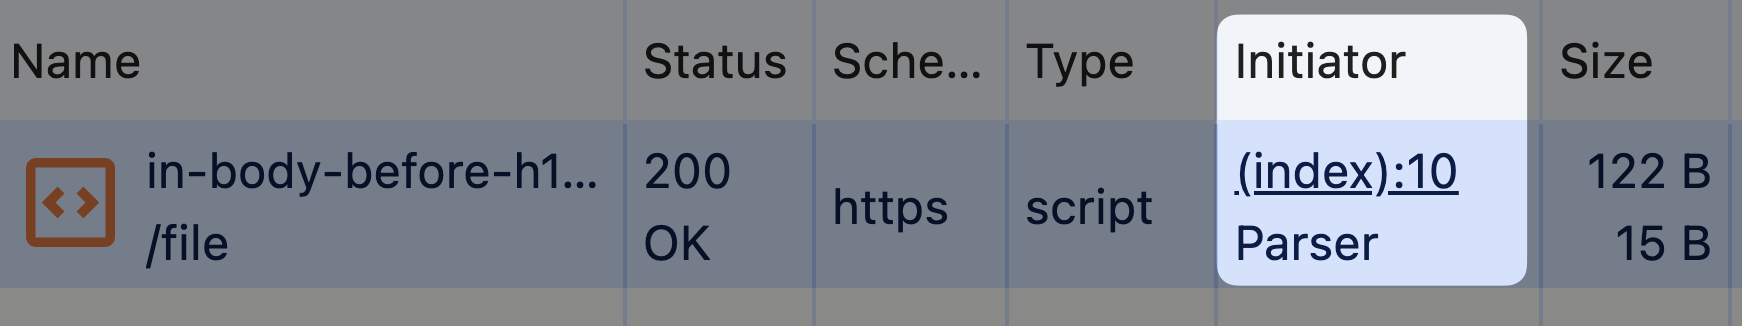
Once you locate the script in the network panel, click on its initiator from the Initiator column to see what caused the script to be loaded.
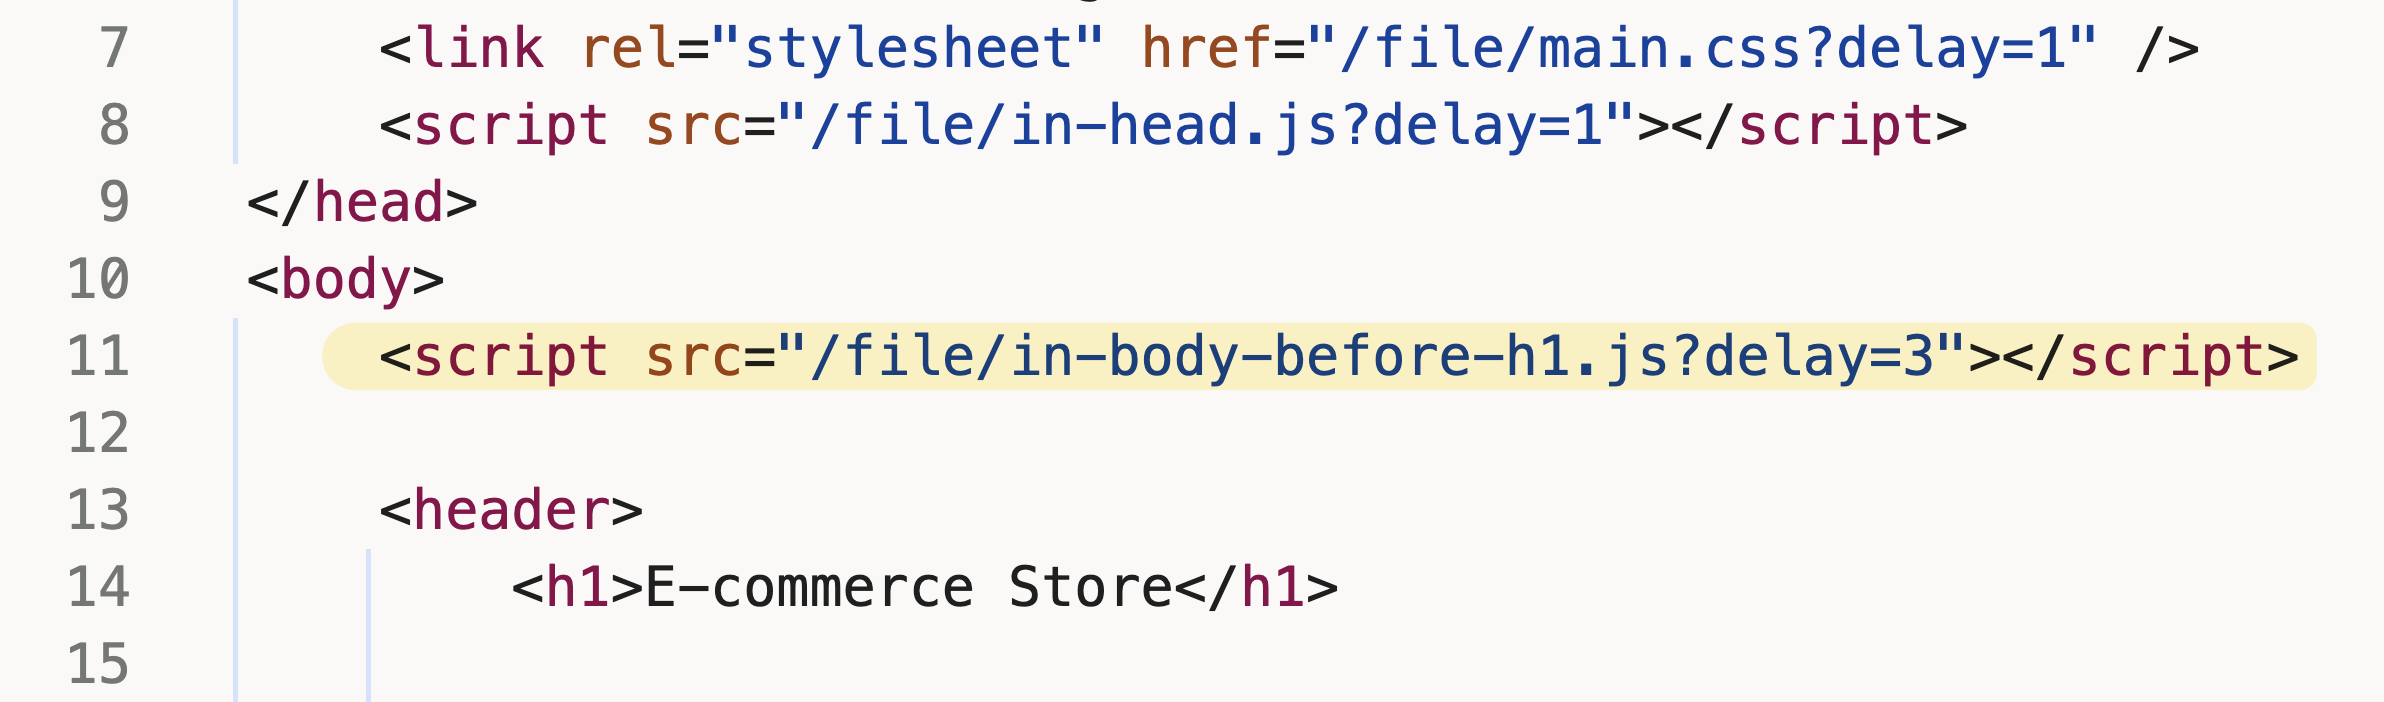
DevTools takes you back to the Sources Panel, and shows you the line of code that caused the script to be loaded.
While this approach is effective, it requires you to be proactive and understand what you're looking for.
Detect render-blocking scripts with Lighthouse
Lighthouse, whether run in DevTools, from the command line, or even in DebugBear, can help you identify render-blocking scripts. The Eliminate render-blocking resources audit in Lighthouse flags scripts and stylesheets that are render-blocking.
As of May 2024, our render-blocking demo page passes the "Render Blocking Resources" audit within Lighthouse v12. Lighthouse sometimes doesn't report all render-blocking scripts.
Detect render-blocking scripts with DebugBear
If you do not have an active DebugBear account, you follow along by:
Within a report, the Requests view shows you the waterfall of network requests. If a request is render-blocking, that request may have a blocking or parser-blocking badge label. This informs you that the request is render-blocking all, or some parts of the page.
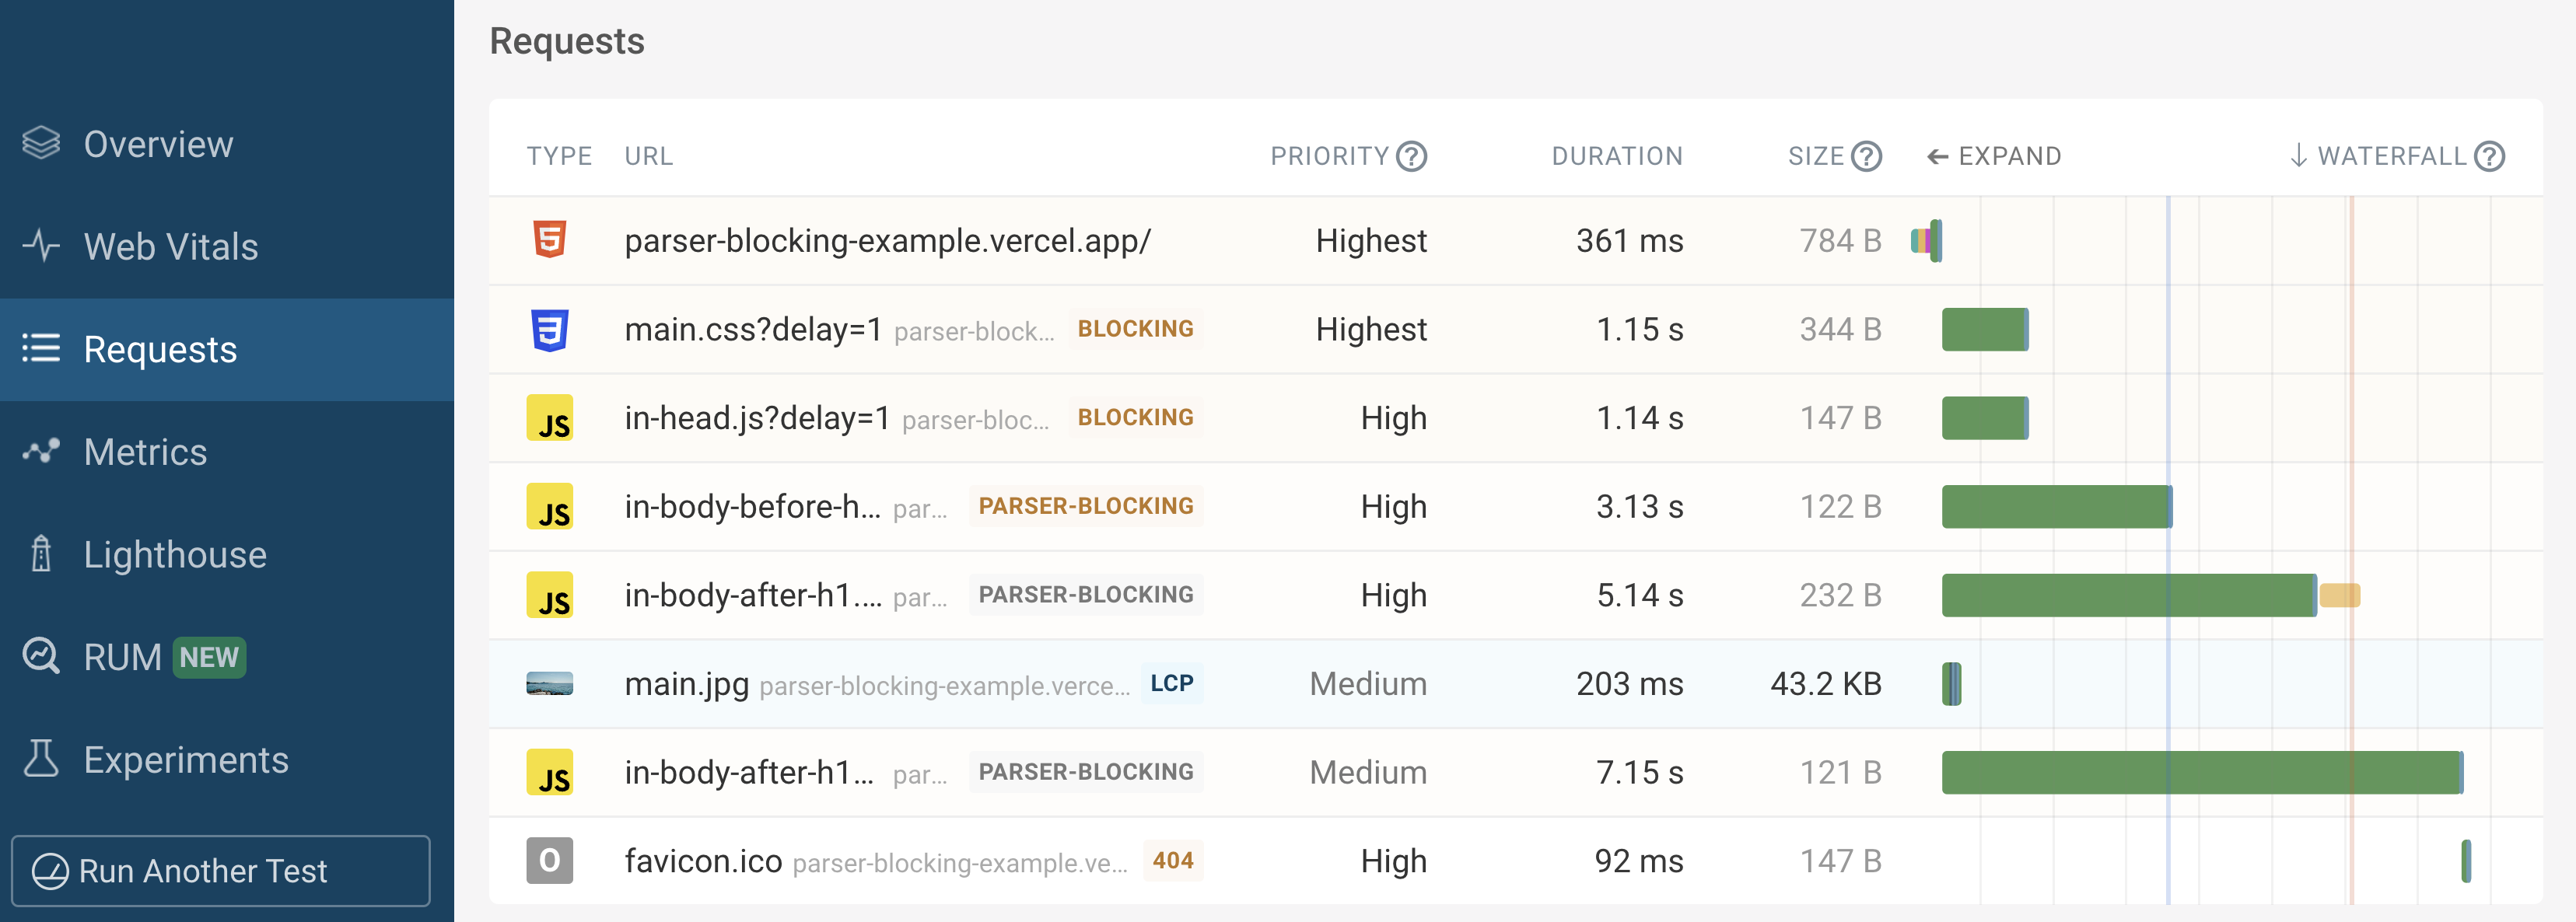
Not all parser-blocking scripts are considered equal. A parser-blocking script close to the closing </body> tag may be an insignificant concern if there's not more content to render.
However, given a parser-blocking script that comes before the page's main heading (<h1> tag), DebugBear highlights this to you with an orange parser-blocking badge label.
- parser-blocking: (orange-brown color) this parser-blocking resource blocks rendering of content including the
<h1>element. - parser-blocking: (gray color) this parser-blocking resource may block rendering of content, but it's at a position after the
<h1>element.
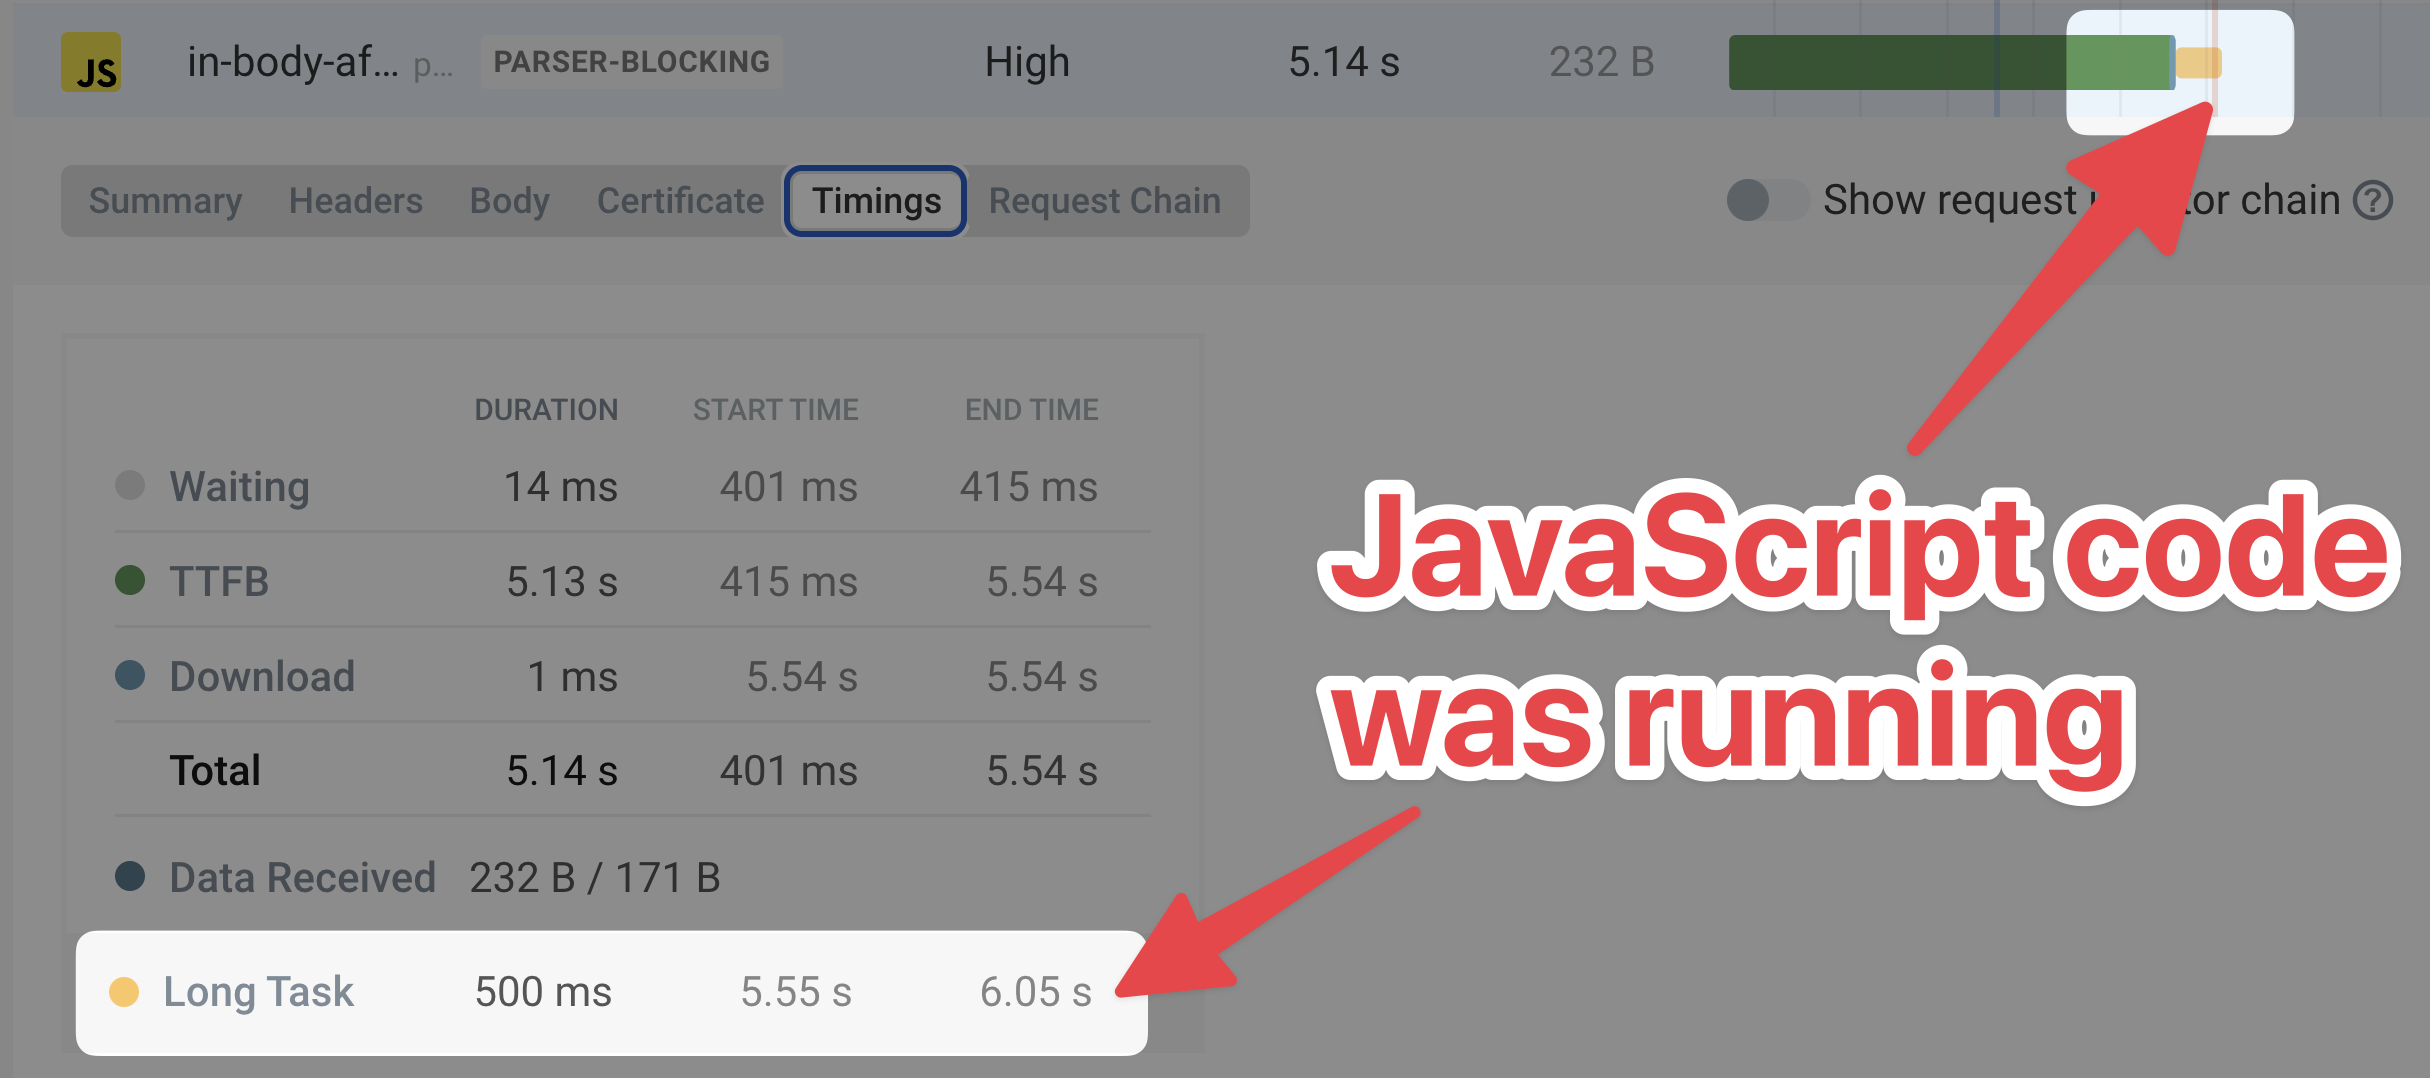
You can click on a resource within the waterfall view to see more details about the request. In the following table of example request details, pay attention to the Render-blocking and Position fields.
| Request | Value |
|---|---|
| Method | GET |
| URL | https://parser-blocking-example.vercel.app/file/in-body-before-h1.js?delay=3 |
| Initiator | parser-blocking-example.vercel.app:10:51:<script src="/file/in-body-before-h1.js?delay=3"></script> |
| Frame | https://parser-blocking-example.vercel.app/ |
| Render-blocking | Parser-blocking |
| Position | Before H1 |
| Request time | 20 May at 16:35:12 |
| Start time | 400 ms |
| Protocol | h2 (TLS 1.3) |
| Connection | ID: 164 (Reused) |
| Priority | High |
| Request Index | 4 |
Why does this matter?
Why should you care whether or not a script is render-blocking before or after the <h1> element?
At the very least, you want to prioritize optimizing the scripts that are render-blocking before the <h1> element. This is because the <h1> element is often the first piece of content that users see when they land on a page - and you want this heading to be rendered as quickly as possible.
Conclusion
Using a Push vs. Pull analogy: Different tools require different approaches to detect render-blocking scripts.
With DevTools, you need to be proactive in pulling information and data from Network recordings and performance profiles. You also need to make sense of such data to understand the impact of render-blocking scripts on your page load.
DebugBear pushes this information to you so you can easily see the render-blocking scripts that are affecting your page load with the parser-blocking or blocking badge labels in the request waterfall.
The best workflow is to use both DevTools and DebugBear to get a comprehensive view of your page's performance.
When you use DebugBear to investigate render-blocking resources, consider tackling tasks in this order:
- Prioritize working on resources that block all rendering of the page. This is highlighted with the
blockingbadge label. - Focus on parser-blocking resources that are before the
<h1>element. Thisparser-blockingbadge is highlighted with an orange badge label. - Explore parser-blocking resources that are after the
<h1>element. If the script is so far down in the page that it doesn't actually block any content, then it's less of a concern.
If it's possible, you can also consider using async or defer on such scripts to improve the performance of your page. In the case of stylesheets, you can inline your critical CSS.
Exercise
Use the blocking scripts demo and follow the steps in this post to detect render-blocking scripts using both DevTools and DebugBear.
Next, can you answer these questions while using DebugBear?
- What resource is considered the Largest Contentful Paint (LCP) element?
Hint: Within a report, navigate to Web Vitals in the sidebar. The Web Vitals Details section shows you the LCP element.
- The image request to
main.jpgis very short, and has no artificial delay, so why is the LCP score so poor?
Hint: While the image download is short, the image is not displayed until the other slow-loading resources are downloaded - as part of the critical rendering path.
- One of the JavaScript files takes a long time to download, but also includes JavaScript code that is slow to execute. Can you identify which file this is? How does DebugBear help you identify this?
Hint: Both the request waterfall, and filmstrip view, have indicators that can help you identify long-running JavaScript code.
Monitor the page speed of your website
There's more to performance than render-blocking resources in your page. DebugBear monitors your website over time, from both your real-world users, and from within a controlled lab environment.


Monitor Page Speed & Core Web Vitals
DebugBear monitoring includes:
- In-depth Page Speed Reports
- Automated Recommendations
- Real User Analytics Data