
Real user monitoring can help you optimize your website performance and improve user experience.
In this article, we'll explain how to set up RUM on Splunk and view Core Web Vitals data for your website.
What is Splunk RUM?
The real user monitoring feature in the Splunk Observability Cloud can tell you how actual visitors experience your website. You also get technical insights to understand and improve user experience.
While real user data does not have the same depth as synthetic data, it instead shows a distribution of real-world performance scores that tells you how well you're doing in practice.
How to set up real user monitoring in Splunk
To set up Splunk RUM you need to create a RUM access token, generate a new RUM configuration, and install a script on your website.
Create a RUM access token
The RUM access token allows your website to report monitoring data to Splunk.
To create a token:
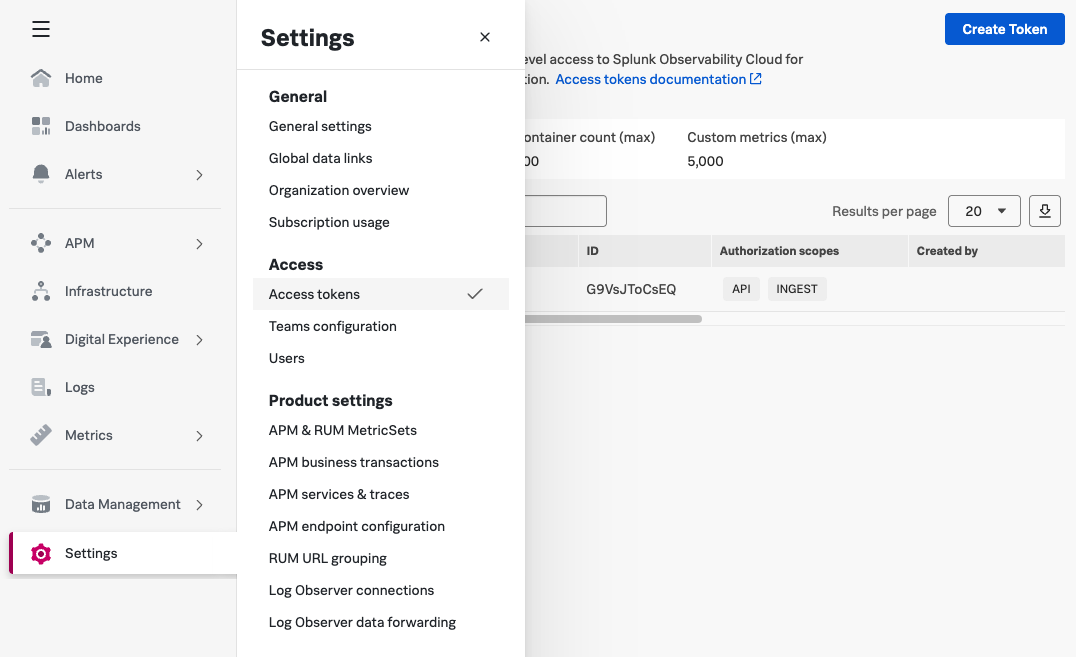
- Open "Settings" in the left sidebar
- Select "Access Tokens"
- Click "Create Token"
You can create different types of tokens, for example to use the Splunk API or report backend performance data. Here we want to create a "RUM Token".
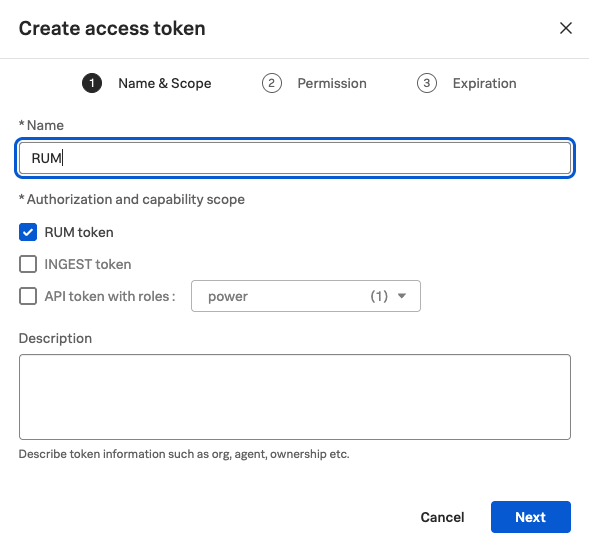
Complete the process by specifying a name, permissions, and an expiration date.
Create a RUM configuration
Once you've created the RUM token you can use it to start collecting RUM data:
- Select "Digital Experience" in the left sidebar
- Select "Real User Monitoring"
- Open the overview page
- Expand the "RUM Configuration" dropdown in the top right
- Select "Create RUM Integration"

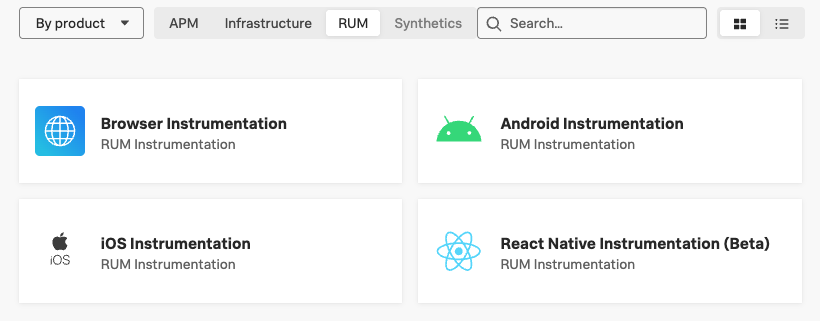
Splunk can monitor real user monitoring on websites in the browser or on mobile iOS or Android apps.
We'll select the "Browser instrumentation" option.
As the first step, Splunk explains how you can configure RUM for your front-end application. Splunk supports collecting OpenTelemetry data for your website, in addition to automatically measuring performance.
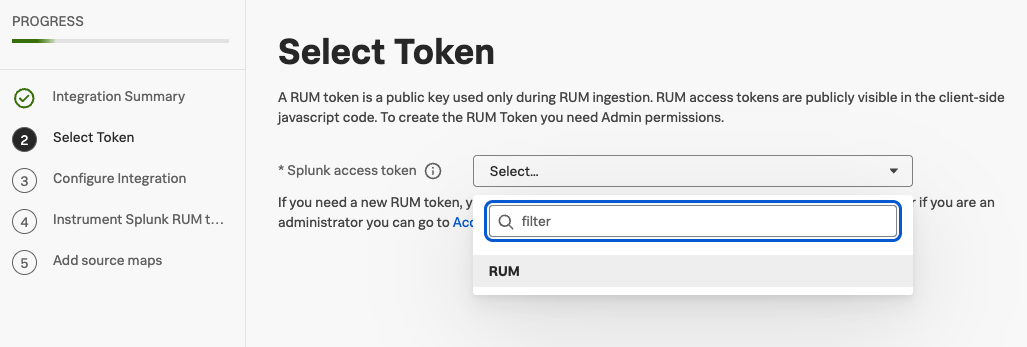
Click "Next" to continue. Then select the RUM token you created earlier.
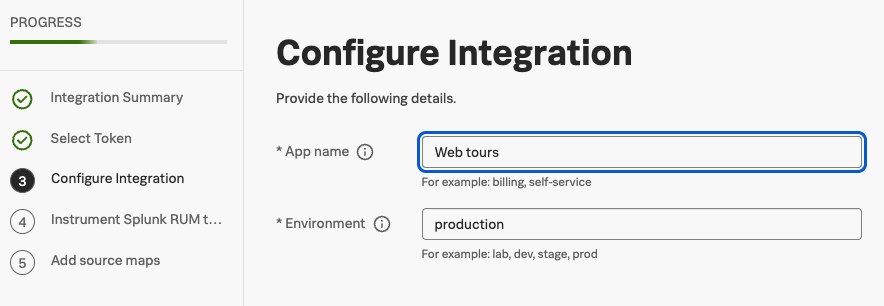
In the third step you need to specify the name of your website or application.
You can also specify an environment name to differentiate data collected on production or from a staging environment.
Finally, Splunk provides the code that you need to install on your website. Preferably add the code to your HTML, or alternatively load it through a tag manager.
Make sure to replace <version> with a specific version number like v1.2.0 or latest.

The code you install will look like this:
<script
  src="https://cdn.signalfx.com/o11y-gdi-rum/v1.2.0/splunk-otel-web.js"
  crossorigin="anonymous"
></script>
<script>
  SplunkRum.init({
    realm: "eu2",
    rumAccessToken: "TOKEN_VALUE",
    applicationName: "NAME",
    deploymentEnvironment: "ENVIRONMENT",
  });
</script>
Splunk is now ready to collect RUM data. As the last step you can also configure source maps to get more readable JavaScript stack traces.
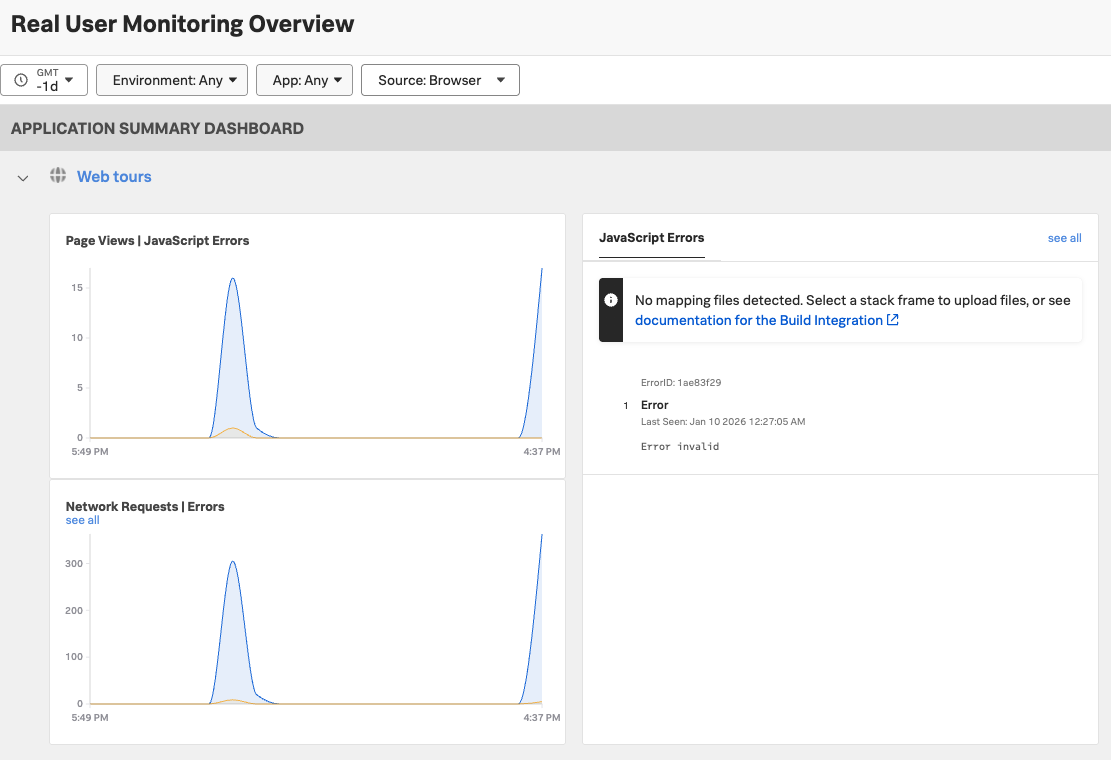
You can now view data in the RUM overview dashboard. For example, you can see how many page views have been recorded and what JavaScript errors occurred.
Inspect Core Web Vitals with Splunk RUM
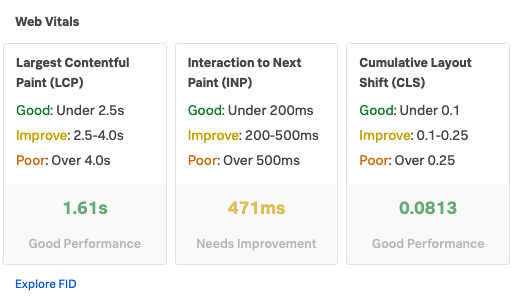
Google's three Core Web Vitals metrics are also automatically collected by Splunk. You can see the 75th percentile score for LCP, INP, and CLS.
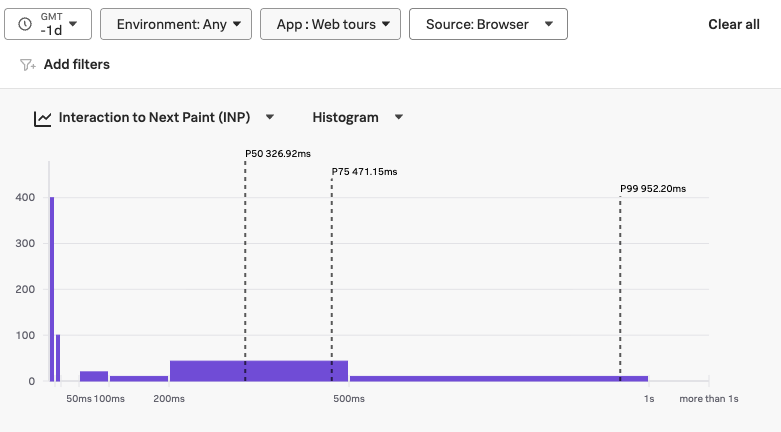
You can click on each of the web vitals metrics to view additional breakdown data. For example, you can filter data for specific countries or browsers.
The histogram provides more detail on how visitor experiences are distributed on your website.
The breakdown tables also tell you more about how visitor experience varies across your website.
You can also view other percentiles like the p50 or p99 scores. This provides insight into both a typical user experience as well as the experience of your slowest visitors.

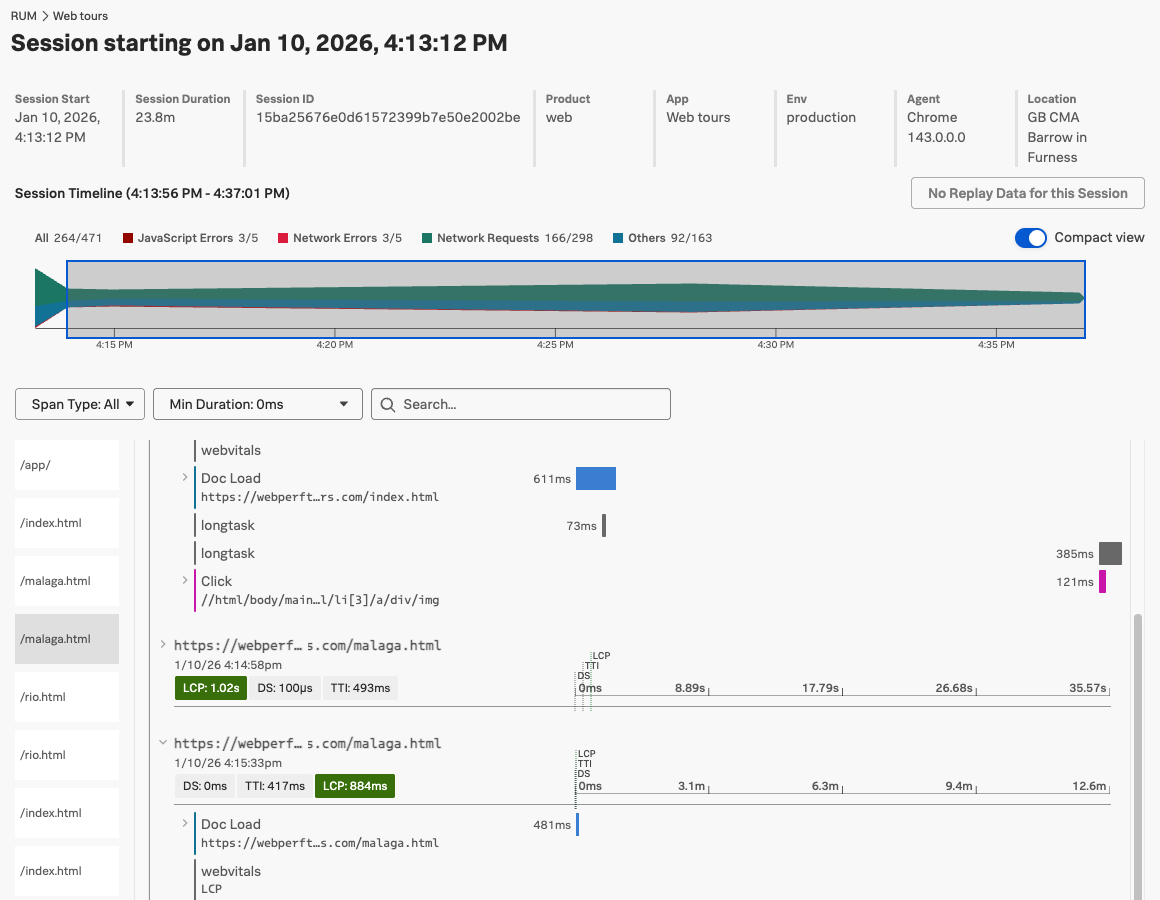
View user sessions
The User sessions view provides more detail on specific visits to your website.
You can view per-page performance metrics, investigate slow network requests, review long CPU tasks, and observe user interactions on the page.
Get more detailed RUM Core Web Vitals data
Splunk RUM provides comprehensive page analytics. However, it's not optimized for helping you improve visitor experience and Core Web Vitals. For example, you can't easily see what the page LCP element was or what scripts caused a slow interaction.
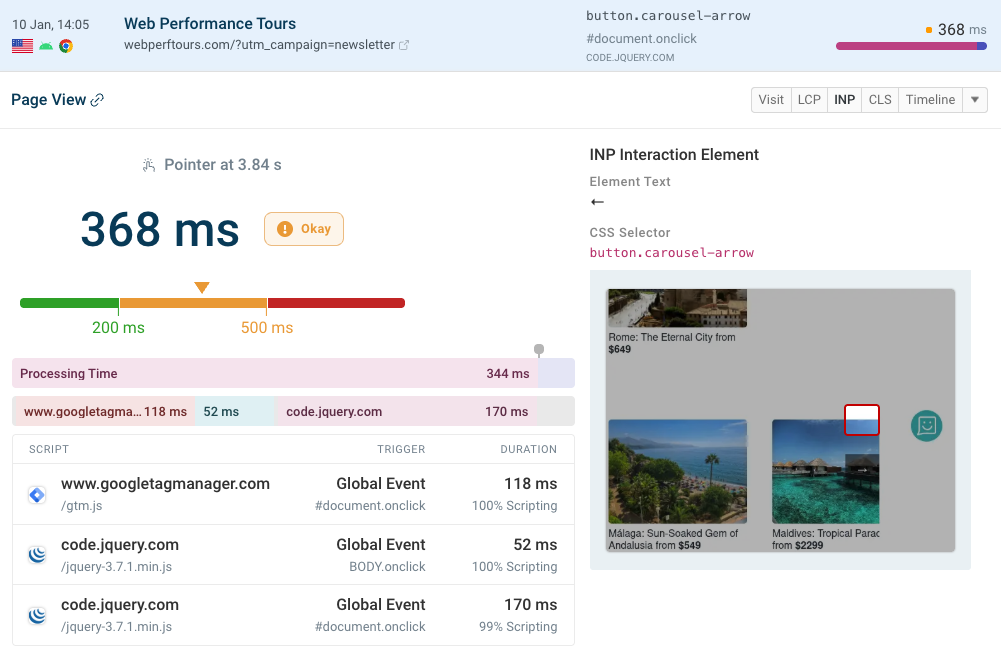
DebugBear RUM is built to make web performance optimization easier. For example, you can easily inspect poor INP scores to identify what the user interacted with and what scripts ran in response to the user input.
You can also track higher-level metrics for different pages on your website and configure custom alerts to get notified of performance regressions.


Monitor Page Speed & Core Web Vitals
DebugBear monitoring includes:
- In-depth Page Speed Reports
- Automated Recommendations
- Real User Analytics Data