
Splunk is a platform that provides observability into website infrastructure and performance. If you're looking for an alternative, you can either pick a more specialized tool or evaluate another comprehensive monitoring platform.
In this article, we'll explore different alternatives to Splunk and what their respective strengths are.
1. DebugBear
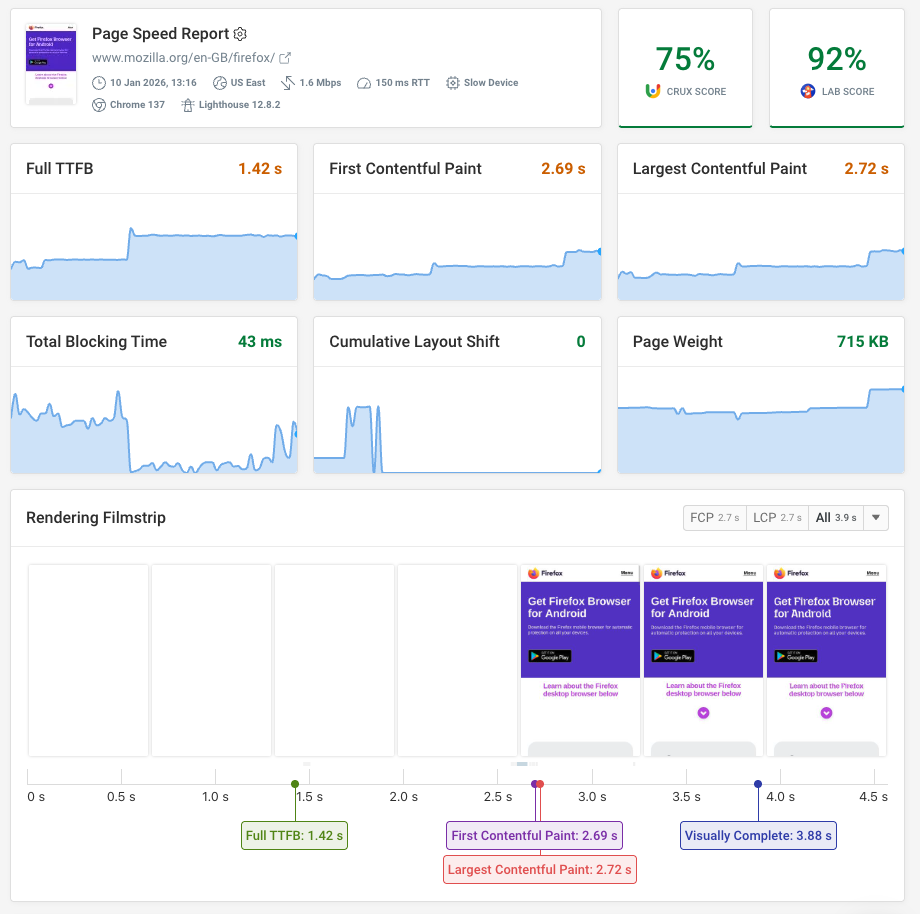
If you're focused on website performance, DebugBear is a specialized alternative to Splunk. It provides both synthetic monitoring and real user monitoring to help you track and improve your website speed.
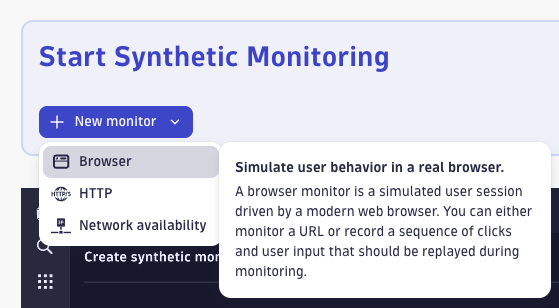
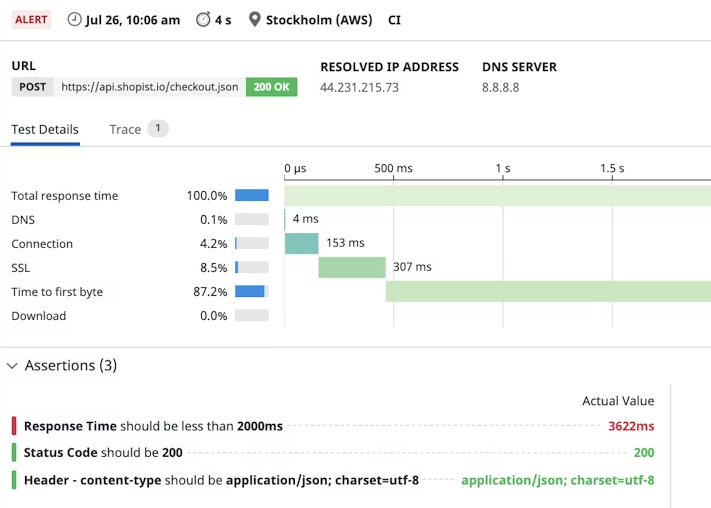
For example, you can run scheduled synthetic tests from different global locations and get detailed performance reports to help you identify optimizations. Set up alerts to get notified when there's a performance regression.
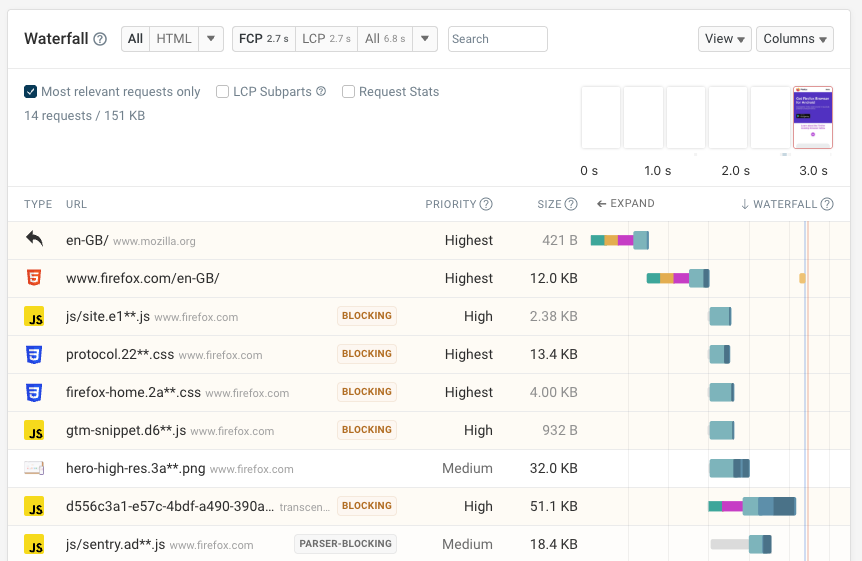
The request waterfall view tells you when different resources are loaded and how that impacts rendering and user experience.
DebugBear highlights the priority of each request and tells you which resources block rendering, are preloaded, or loaded asynchronously.
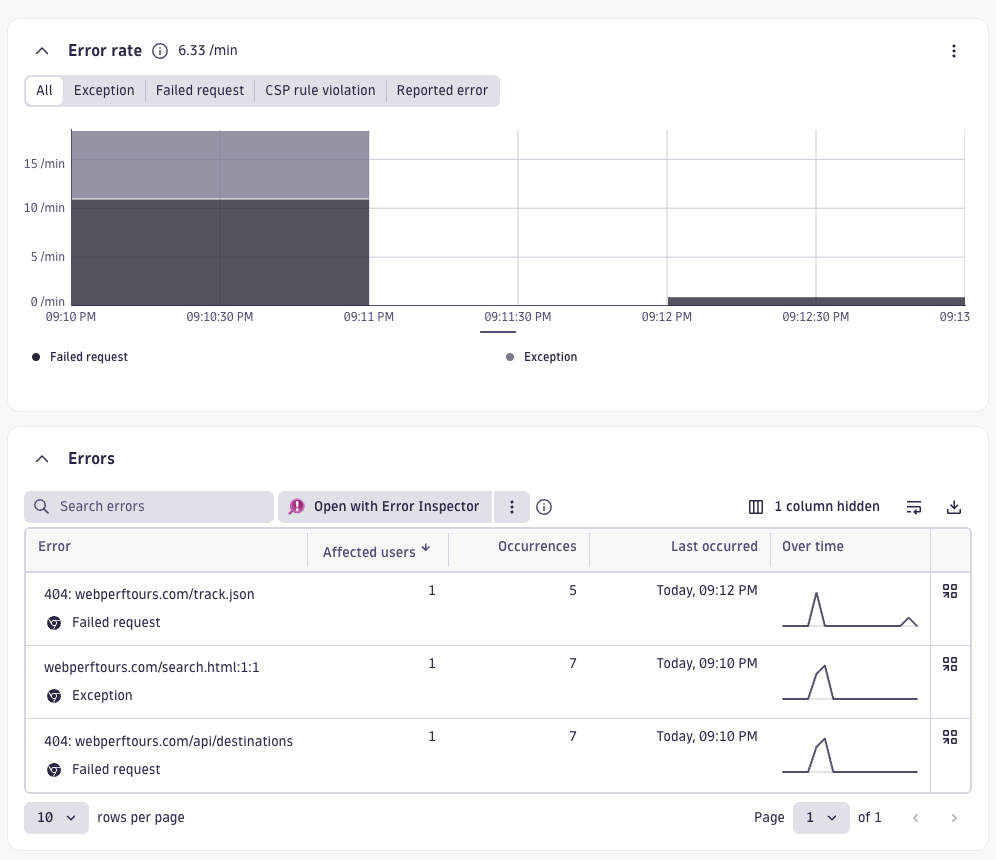
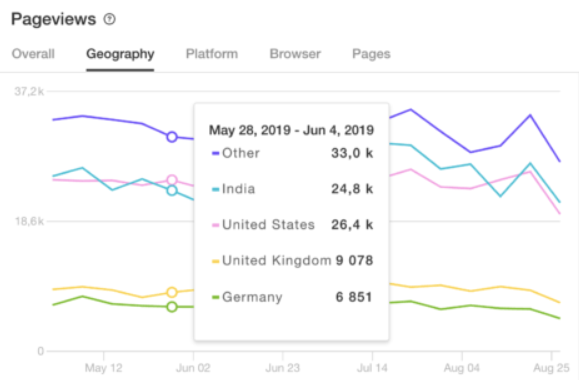
The platform also includes real user monitoring to track how actual visitors experience your website. You can measure Core Web Vitals and other performance metrics across your whole site.
You can also identify what's slowing down your website, whether that's specific scripts that delay interactions or large images that increase load time.
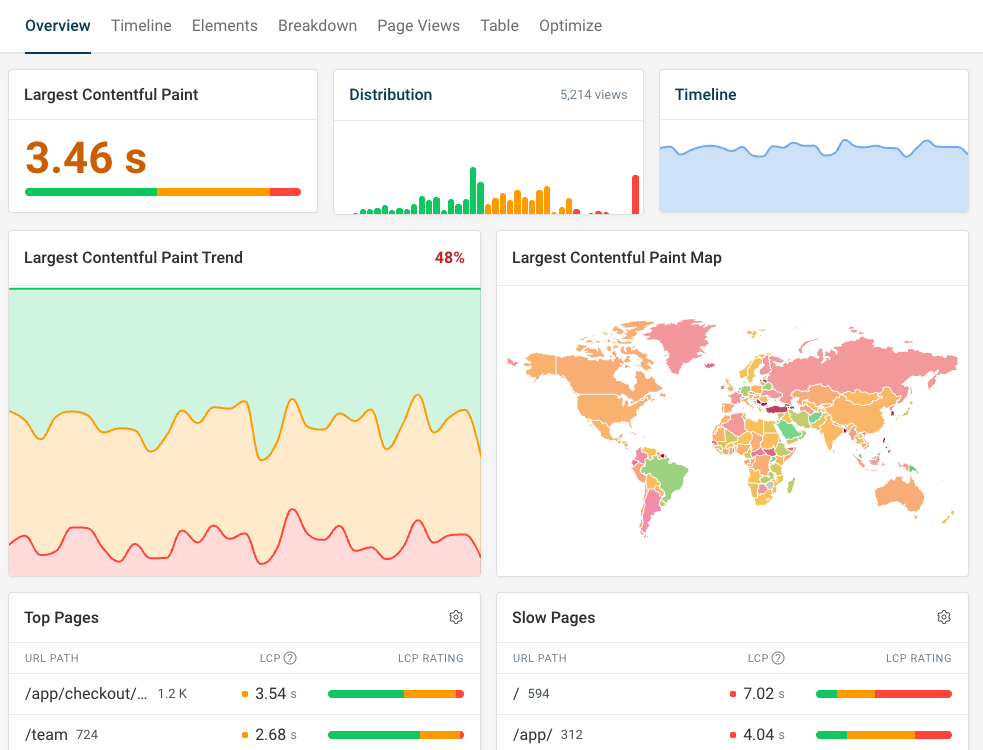
On top of tracking synthetic and real user data, DebugBear also keeps track of the Google Chrome User Experience Report data that impacts SEO.
2. Dynatrace
Dynatrace is another comprehensive observability platform that includes synthetic monitoring and real user monitoring features. It also provides backend and infrastructure monitoring capabilities.
The synthetic monitoring product supports different types of tests like browser monitoring and HTTP checks. You can test from many different locations and customize cookies, headers, and browser configuration options.
The RUM product can track performance metrics, network requests, and JavaScript errors.
Dynatrace provides insight on the three Google Core Web Vitals metrics and provides a detailed request waterfall for page speed analysis.
3. Datadog
Datadog is a modern observability tool covering everything from infrastructure monitoring, log analysis, and digital experience monitoring.
The product lets you run synthetic tests and collect real user experience data. You can create complex custom dashboards and set up alerts to get alerted to website performance or availability issues.
4. Signoz
Signoz presents itself as an open-source alternative to DataDog. It's based on OpenTelemetry and helps you collect logs, traces, and custom metrics.
The platform provides a lot of flexibility in how you collect data and create reports. It is not optimized for any specific use case like user experience monitoring or infrastructure analysis.
However, you can easily create custom dashboards and set up alerts at an affordable price.
5. Uptrends
Uptrends is a website monitoring and page speed testing tool by ITRS. For example, you can track uptime and publish status pages to keep your customers informed.
The platform also includes other digital experience monitoring features like synthetic monitoring and real user analytics.
6. Pingdom
Pingdom is a website monitoring platform that can report on website uptime and performance. You can also monitor backend infrastructure and manage server logs.
The real user monitoring product keeps track of each page view on your website and provides insight into page speed and user experience.
What's the best alternative to Splunk?
Depending on your needs, different Splunk alternatives will be the best fit for you:
- If you focus on web performance and user experience, DebugBear provides detailed insights
- For full-service observability, use DataDog or Dynatrace
- Signoz provides a lot of flexibility at low cost


Monitor Page Speed & Core Web Vitals
DebugBear monitoring includes:
- In-depth Page Speed Reports
- Automated Recommendations
- Real User Analytics Data