DebugBear: A Splunk Rigor Alternative

DebugBear is an alternative to Splunk's performance monitoring functionality.

Get comprehensive web performance data with synthetic tests and real user monitoring.

Splunk Rigor alternative page speed dashboard
”We've updated around 15,000 pages and saw some nice gains from it. "Good URLs" and their impressions have increased 3x since implementation.“
Web performance monitoring user profile picture
Rafayel Begoyan
Senior SEO Specialist
CoinStats logo
”DebugBear has been an eye opener for us and has really shown what's causing the Core Web Vitals issues on our website.
Web peformance monitoring user profile picture
Mandip Ahdan
Head of Engineering
The Independent logo
We help startups, agencies, and enterprises keep their website fast
DebugBear Customers DebugBear Customers

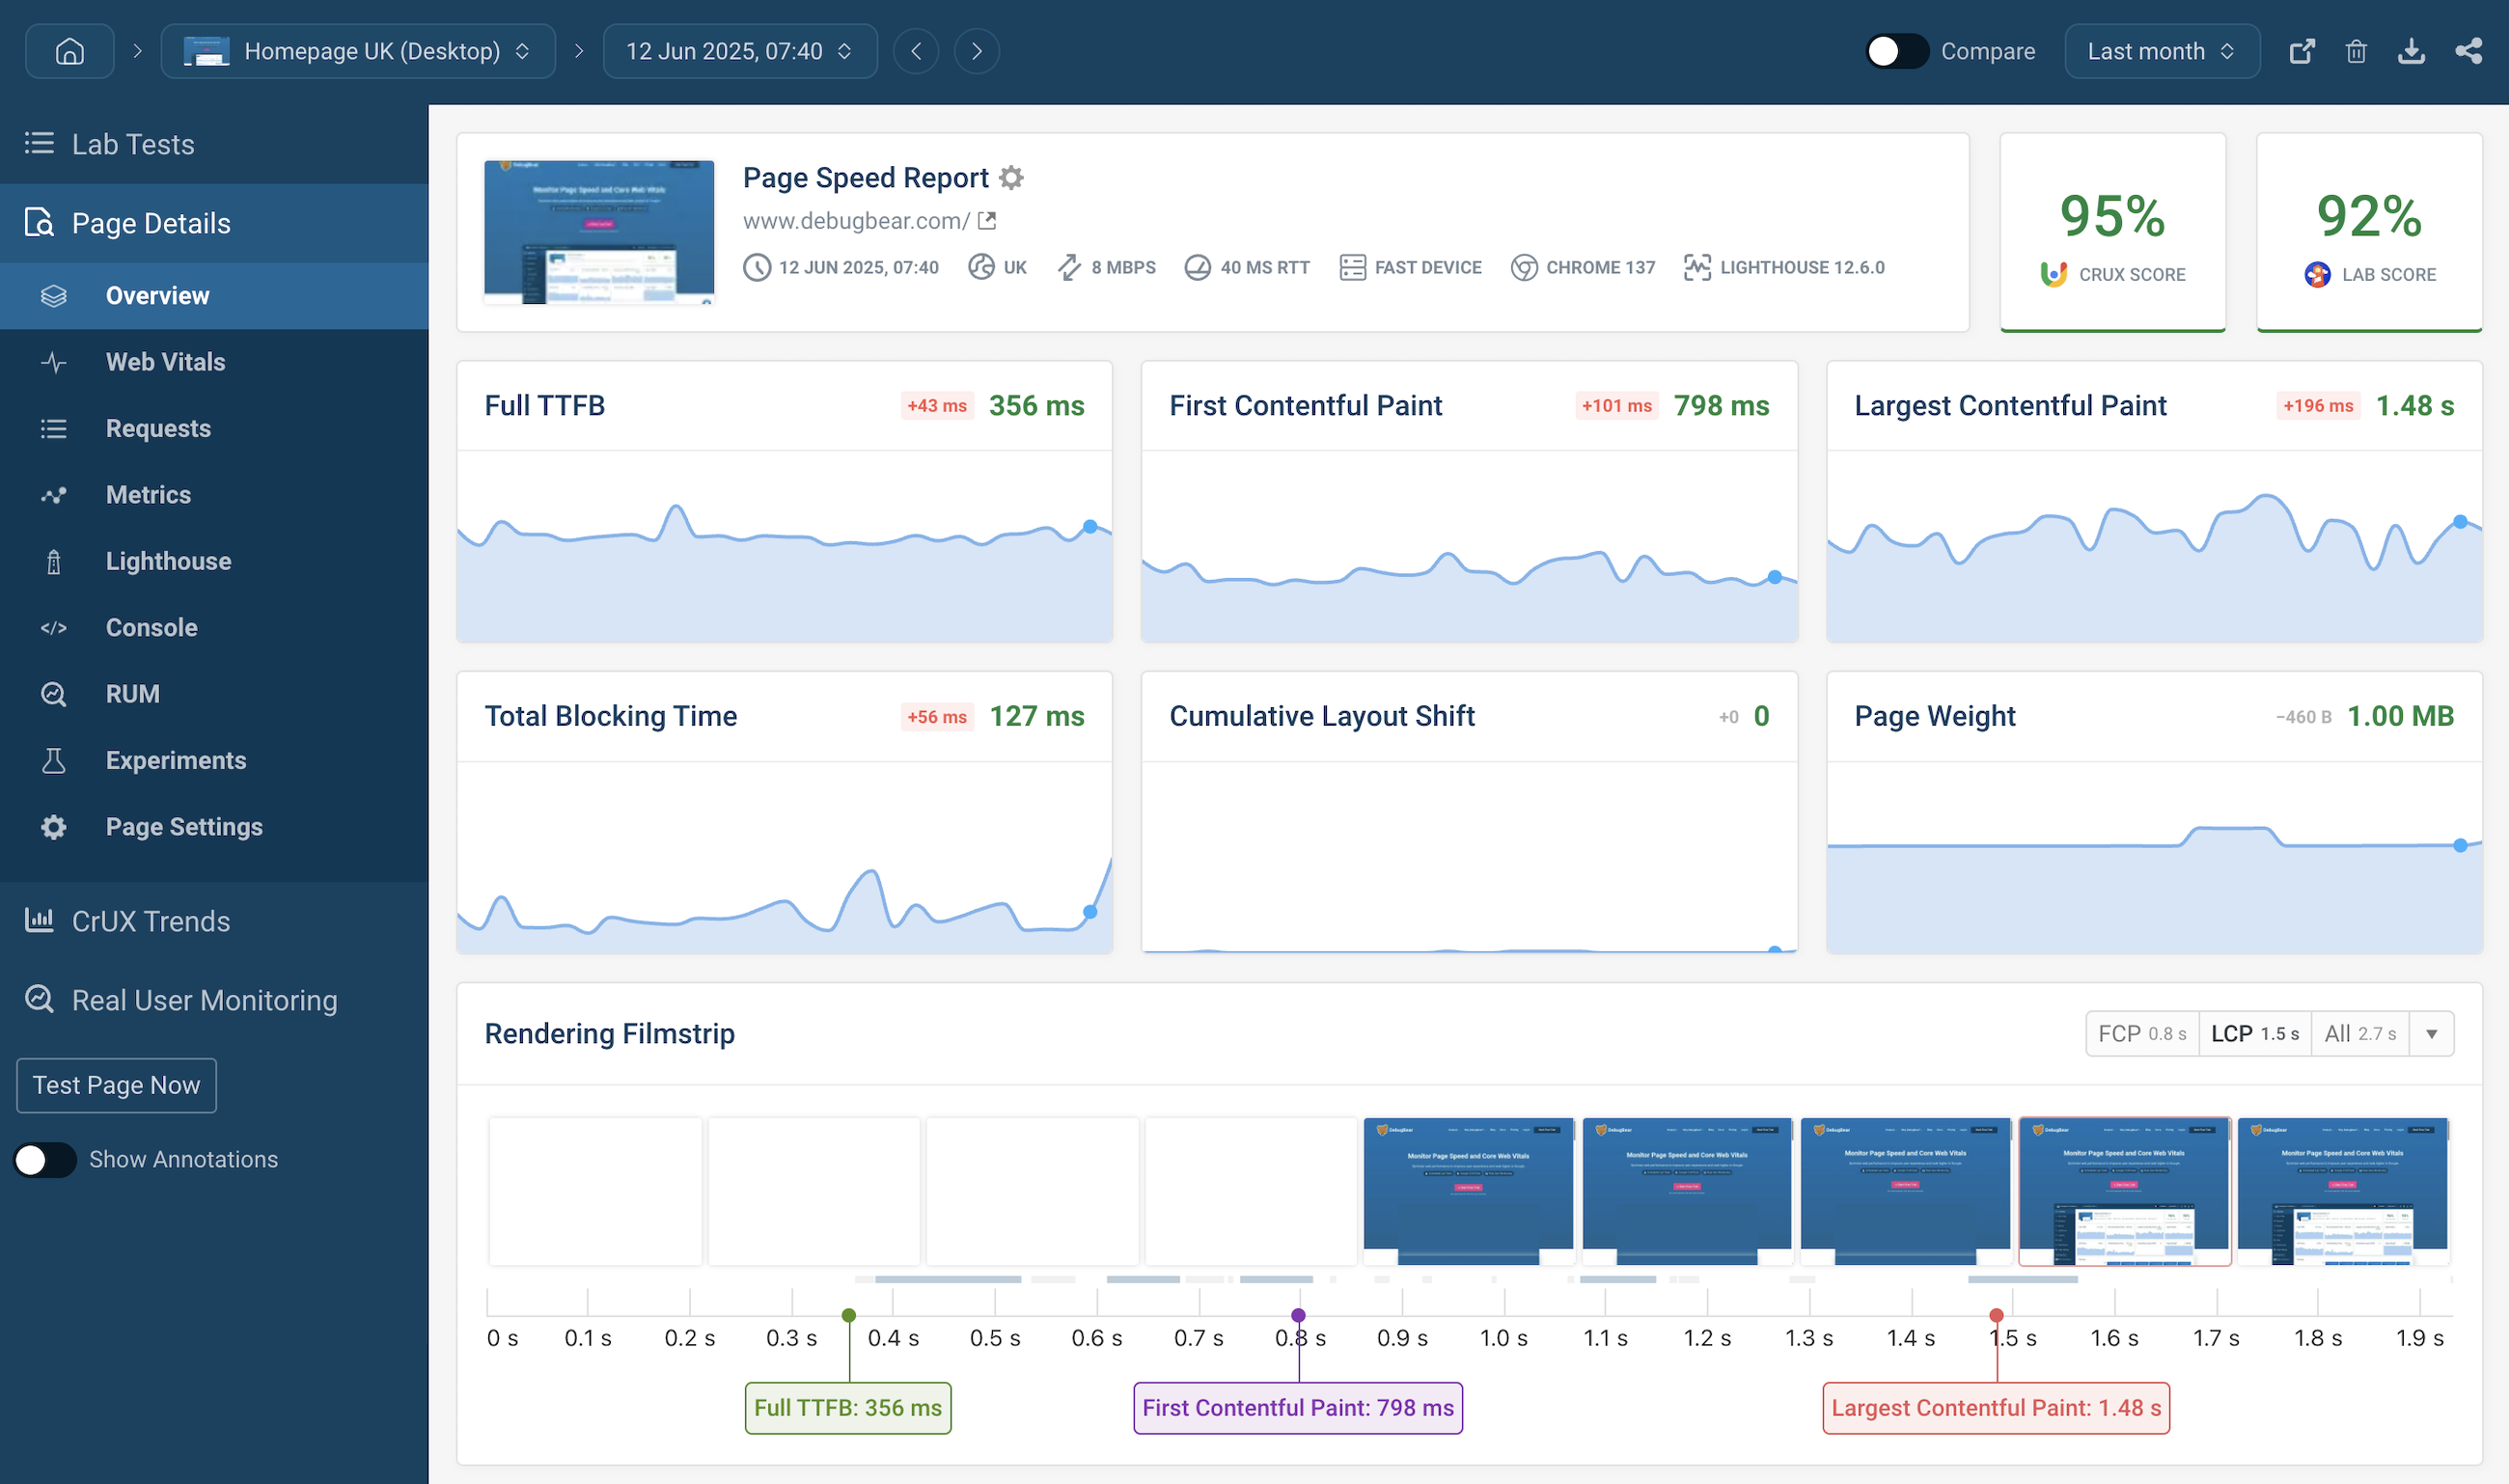
Continuous page speed testing

Measure performance and catch regressions

DebugBear runs tests on a schedule, visualizes site speed over time, and alerts you when there's a performance regression.

Core Web Vitals monitoring

Track the Google Core Web Vitals metrics that impact SEO.

Monitor Lighthouse scores

Monitor Google Lighthouse scores for Performance, Best Practices, Accessibility, and SEO.

Synthetic monitoring dashboard

Real user analytics

Monitor visitor experience

See how fast your website is for real users across your whole site. Identify slow pages and optimize them.

Detailed debugging insights

Analyze slow rendering and interactions with insights into slow network requests and JavaScript code.

Segment your data

See if visitors from specific marketing campaigns have a poor experience and explore how fast your website is for users on slow networks and devices.

Real user analytics dashboard

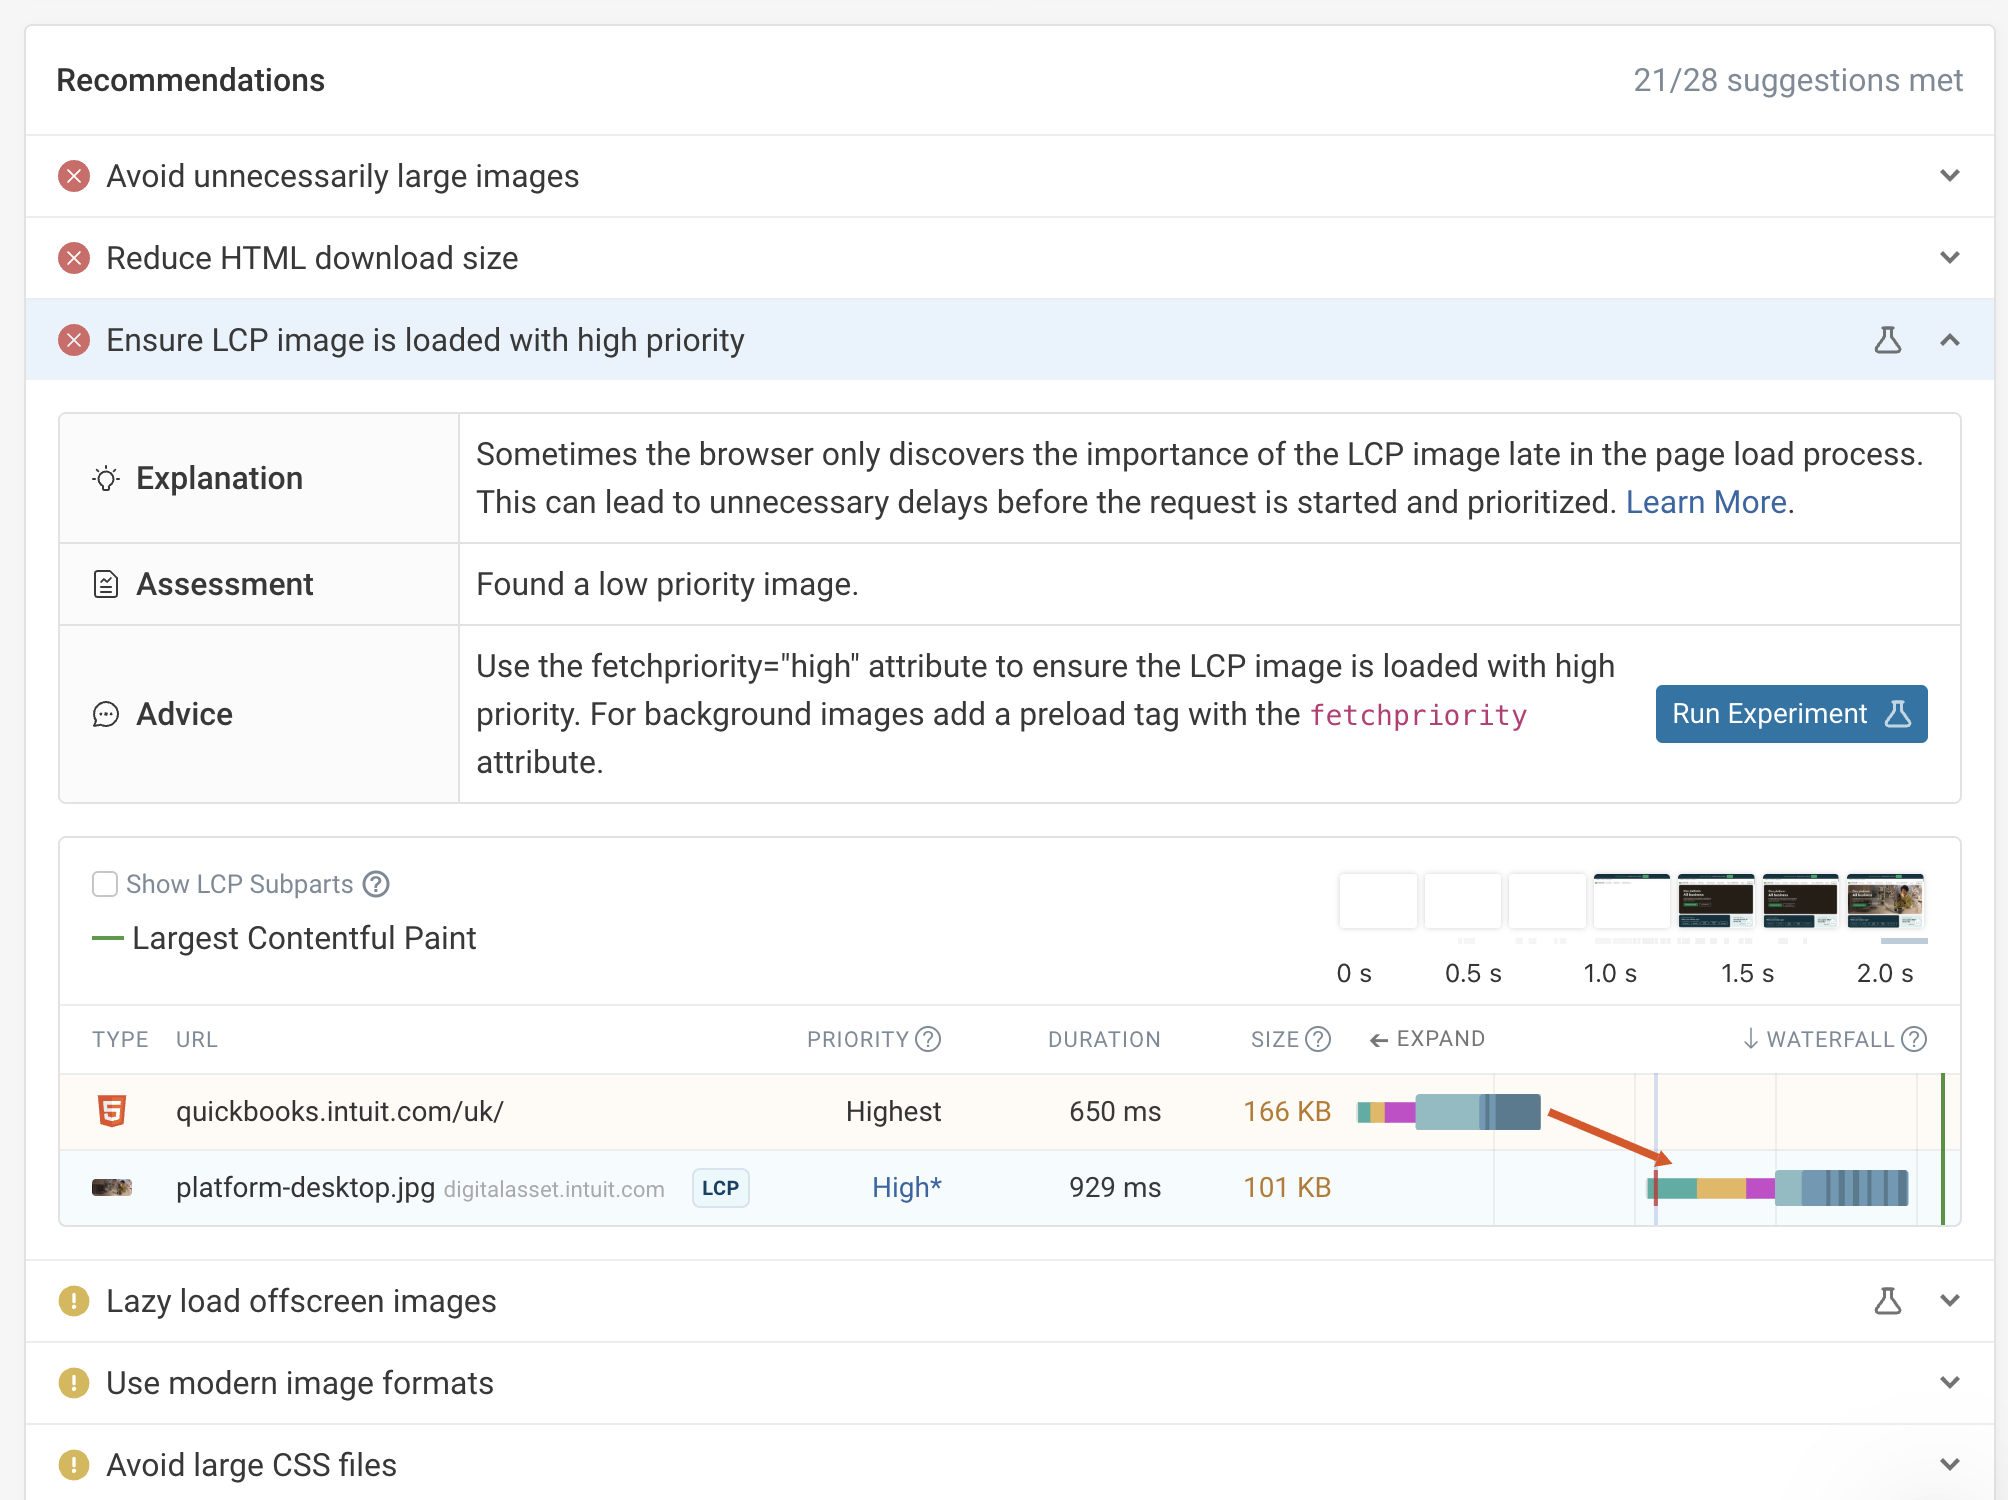
Advanced performance analysis

Tailored recommendations

Get performance improvement suggestions tailored to your website. DebugBear goes beyond Lighthouse and provides actionable insights.

Detailed request waterfall

Visualize the critical rendering path and identify bottlenecks in your page load. View resource priorities, render-blocking requests, and how resources relate to each other.

Custom performance recommendations

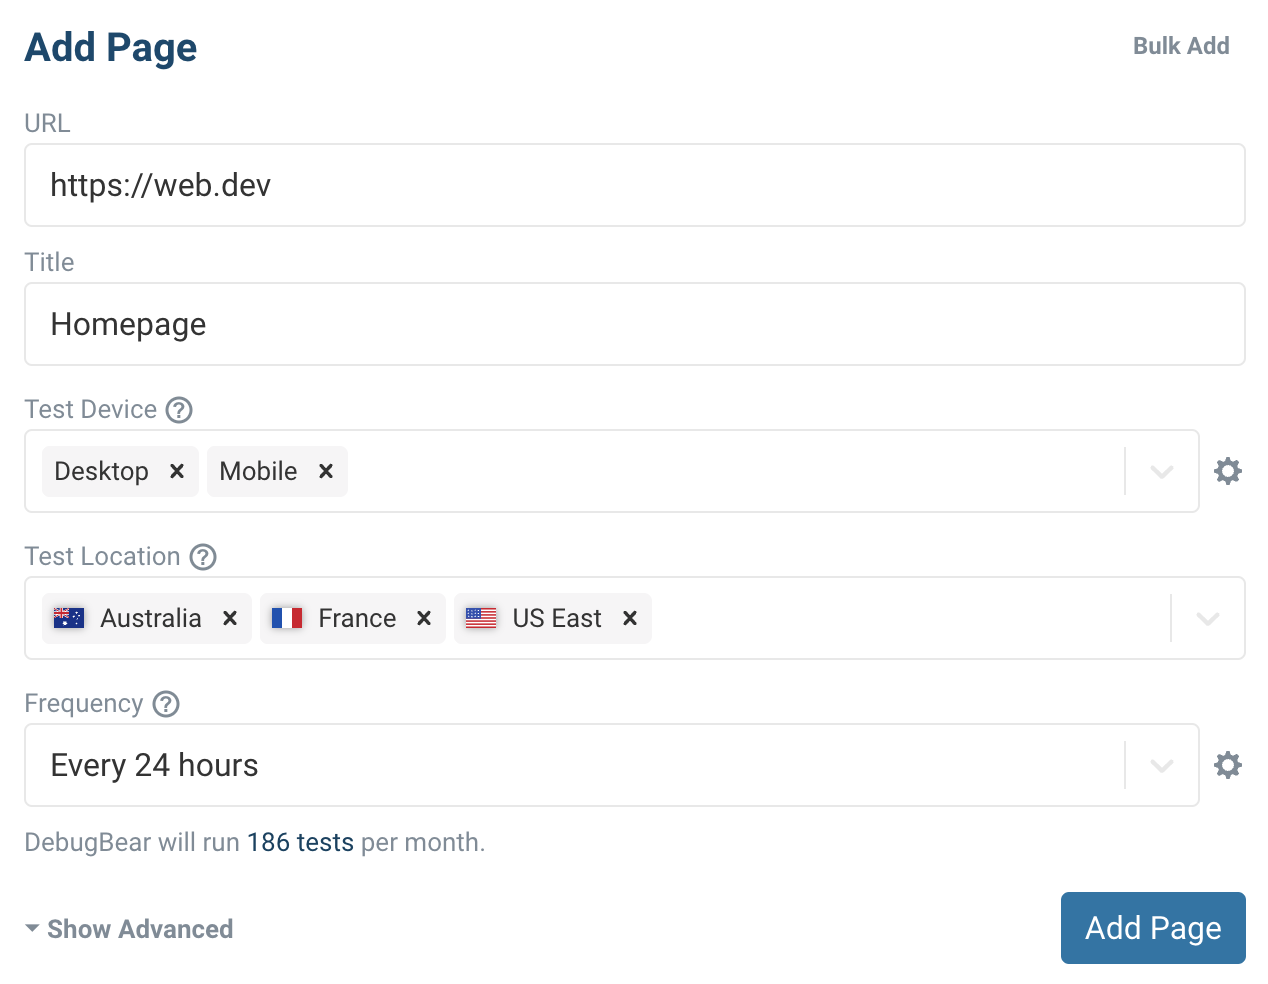
Configure your test environment

Device configuration

Set up network and CPU throttling to measure performance in a controlled environment.

Global test locations

See how performance varies for users in different locations.

Advanced settings

Test authenticated pages, set custom HTTP headers, or test websites behind Basic Auth.

Page speed testing configuration screen

Get set up in minutes.

No credit card required.

You are using an old browser that is not supported anymore. You can continue using the site, but some things might not work as expected.