In-depth Web Performance Reports You Can Trust

DebugBear continuously runs high-quality site speed tests and alerts you when there's a problem.

Use our API to integrate with your workflow.
No card required. Get set up in minutes.
Front-end web performance monitoring dashboard
”We've updated around 15,000 pages and saw some nice gains from it. "Good URLs" and their impressions have increased 3x since implementation.“
Web performance monitoring user profile picture
Rafayel Begoyan
Senior SEO Specialist at CoinStats
”We love DebugBear. It has proven useful time and time again. I evaluated the different competitors and DebugBear was the best overall product.“
Web peformance monitoring user profile picture
Rafael Corral
Senior Software Engineer
Join Hundreds Of Happy Customers
DebugBear Customers

Better data quality than Lighthouse

Real network throttling

Lighthouse and PageSpeed Insights use simulated throttling to test your website. The data is actually always collected on a fast connection!

DebugBear actually slows down the network instead of relying on a simulation that's often inaccurate.

Avoid random outliers and false alerts

DebugBear always repeats tests before sending an alert, so you don't have to deal with issues you can't replicate.

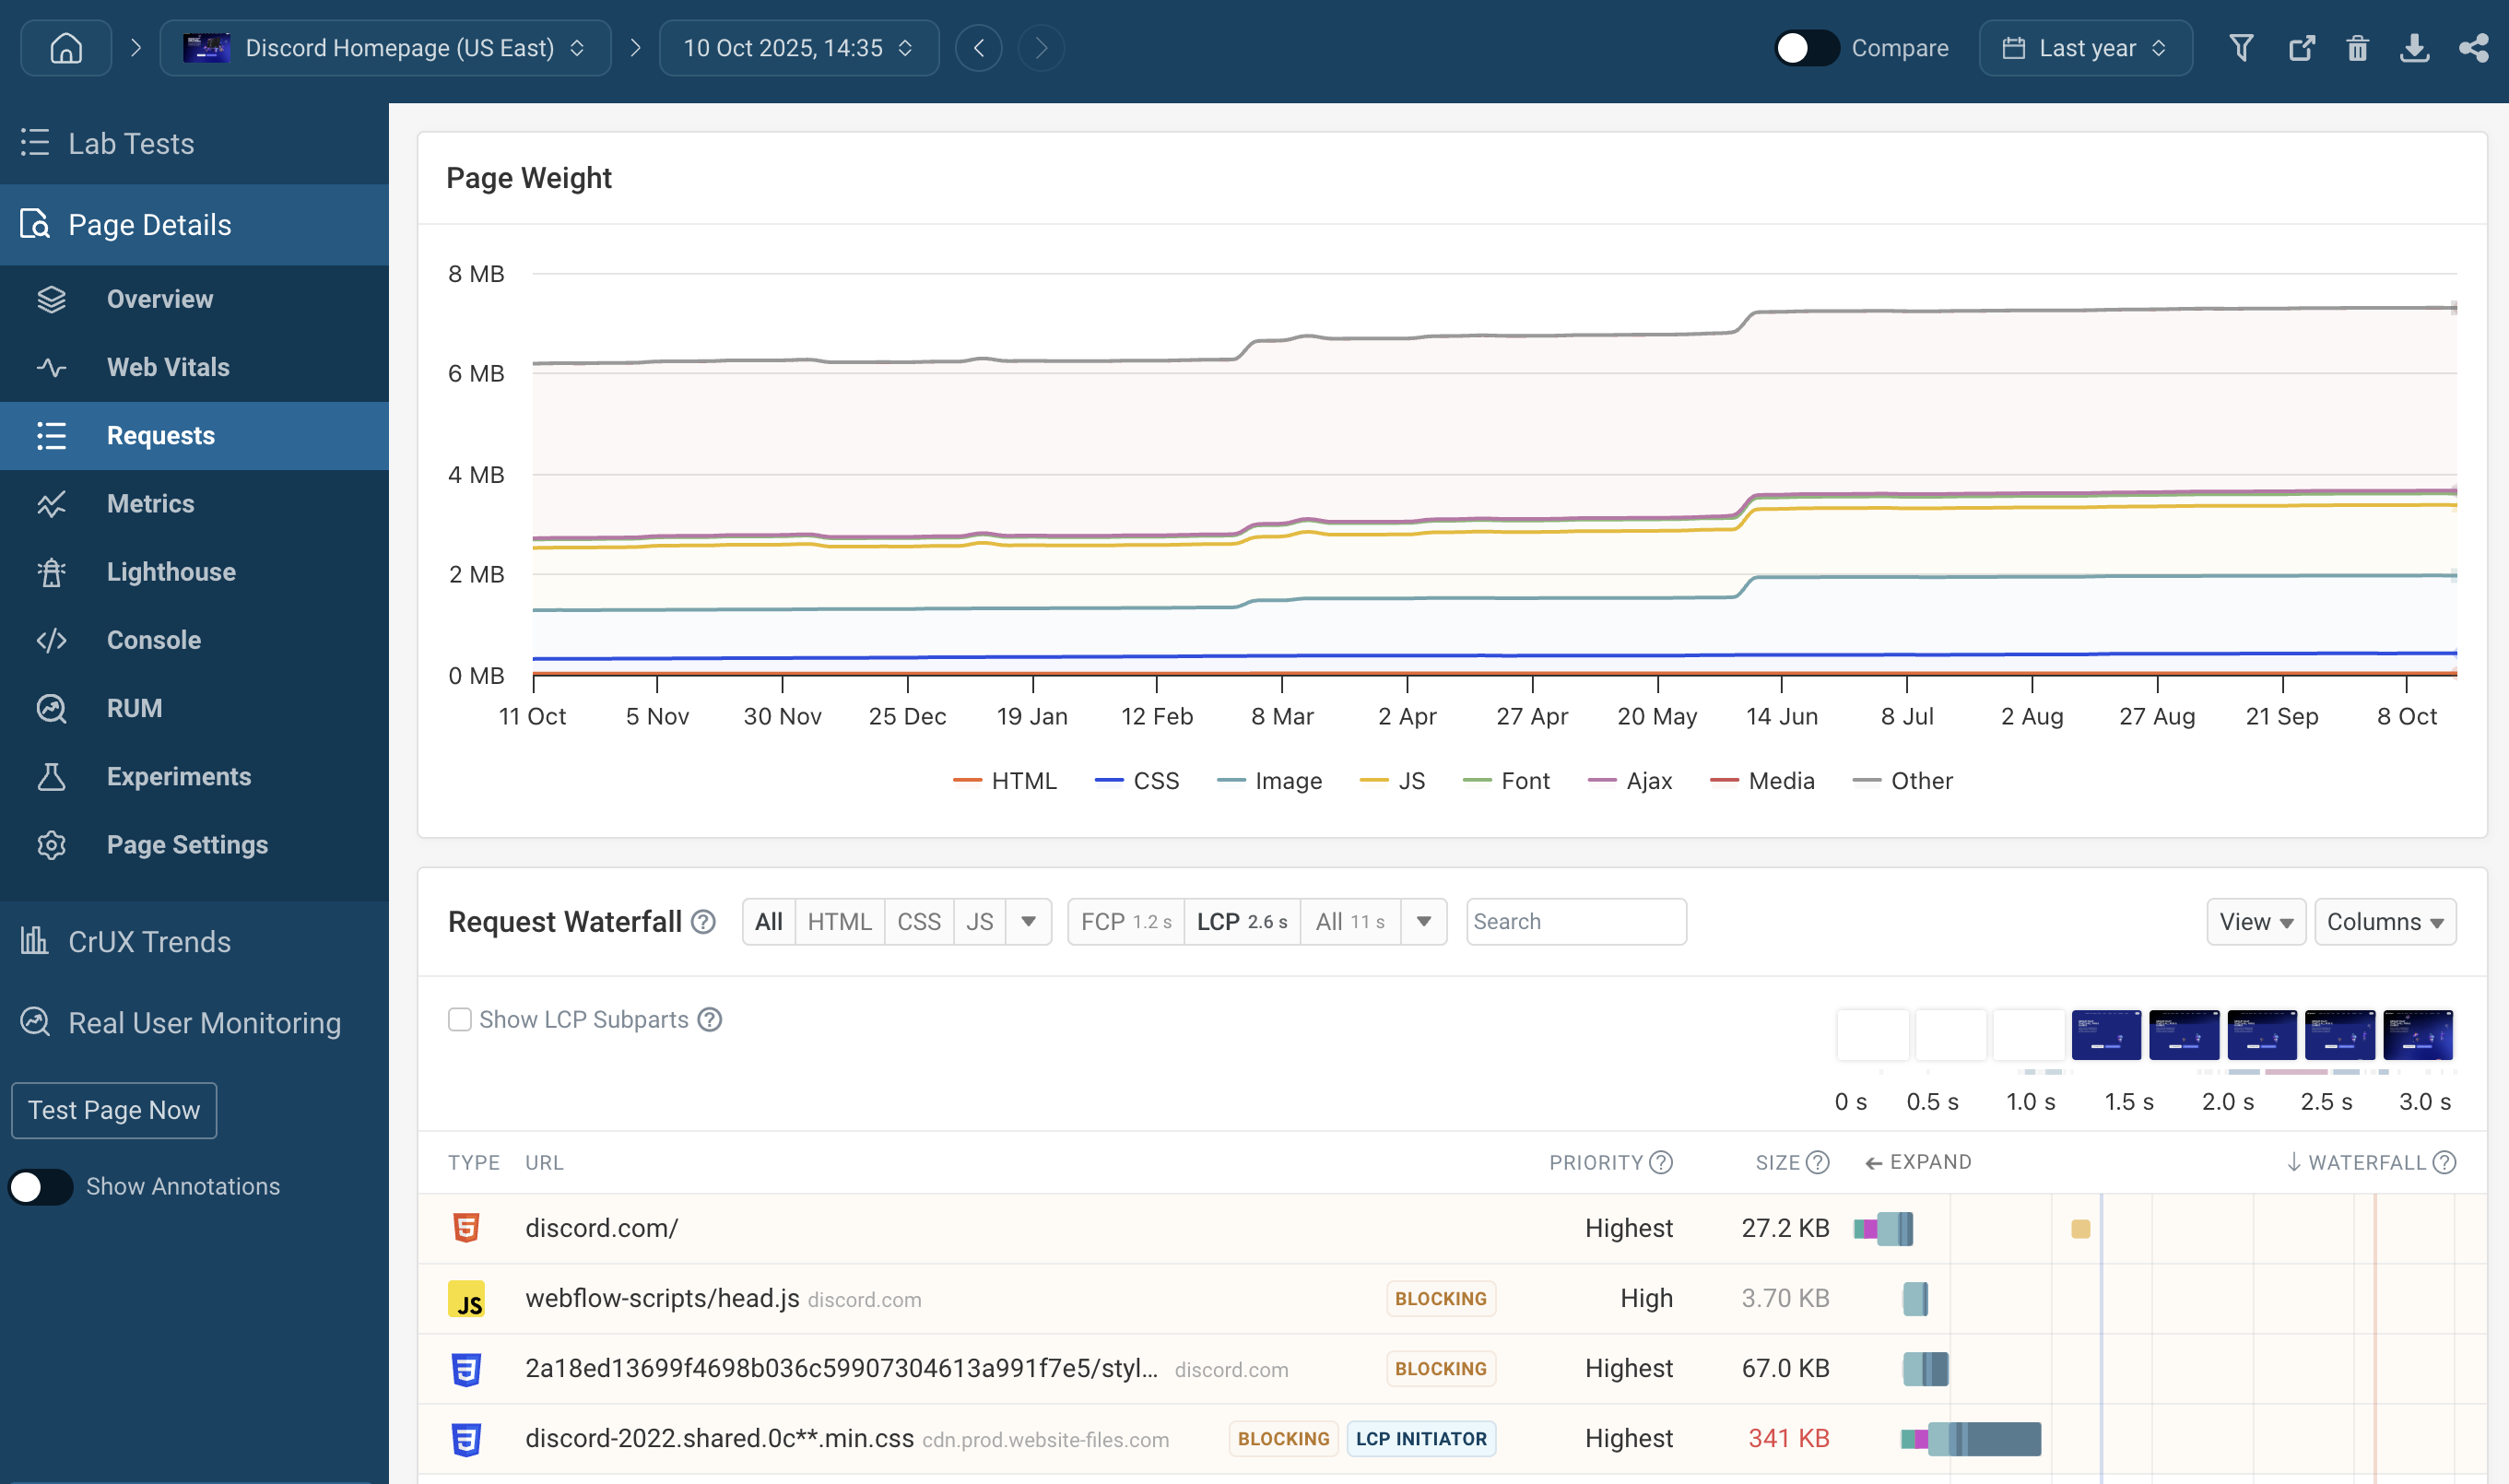
Network request waterfall

Detailed technical reports

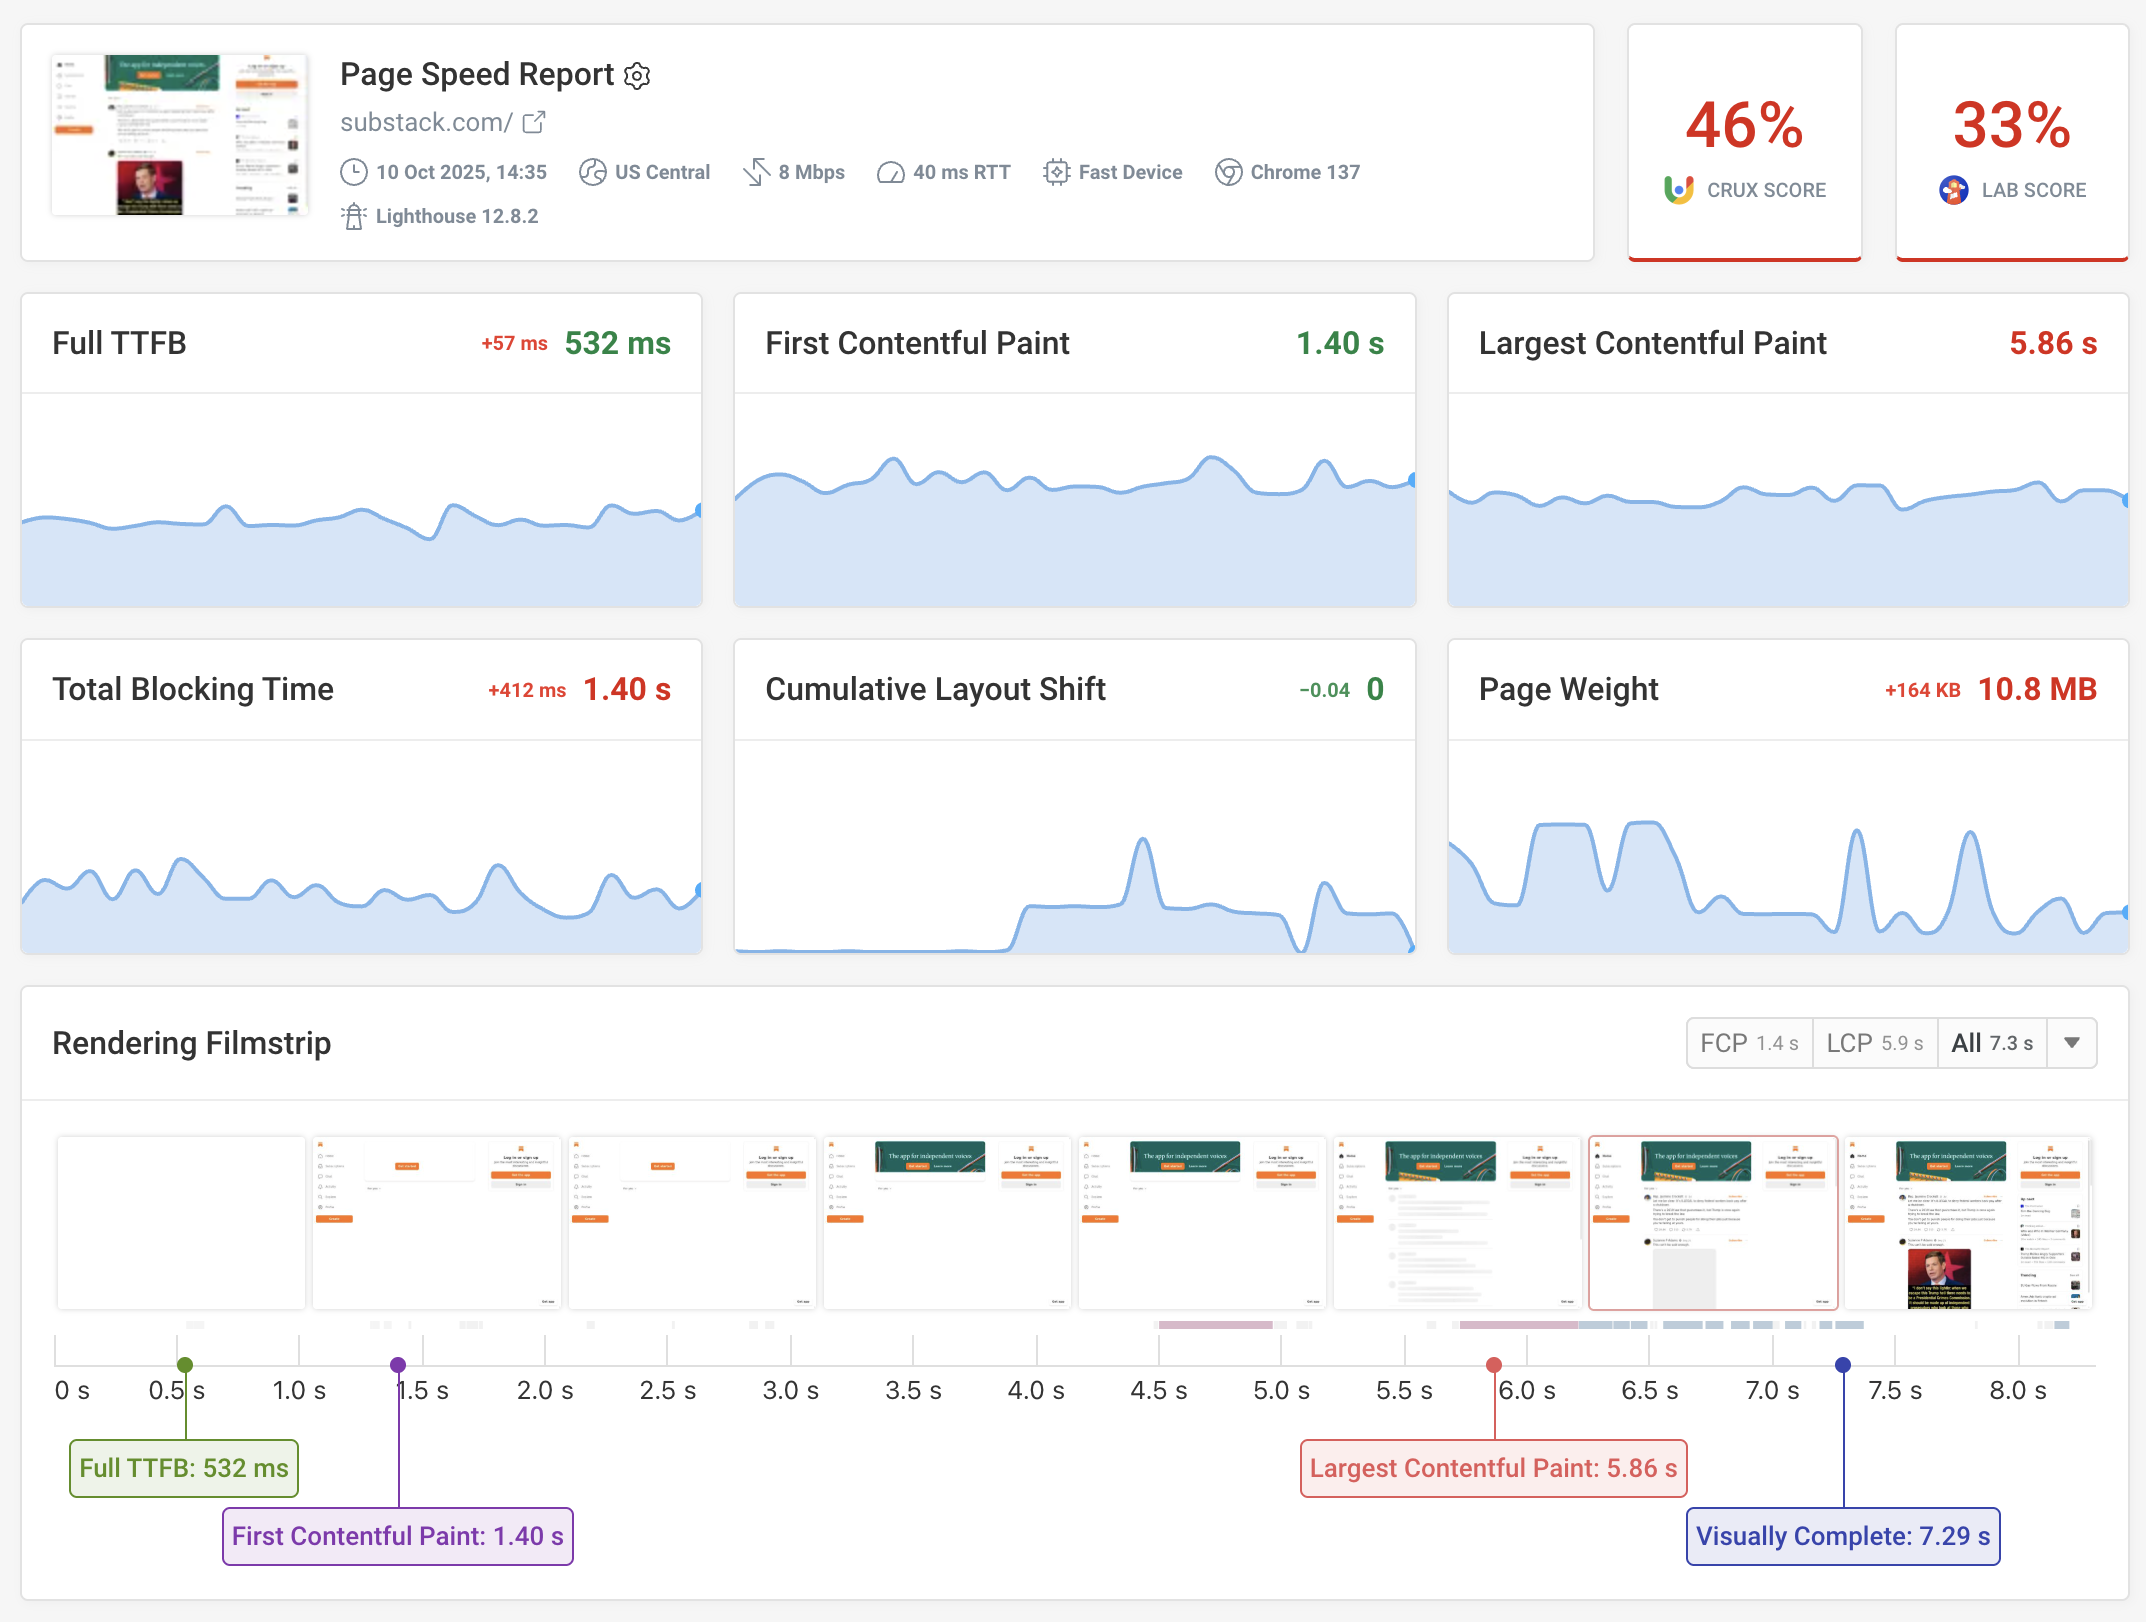
Over 70 different metrics

We track everything from Web Vitals to Lighthouse scores and page weight. We also provide debug data for each metric to help you improve it.

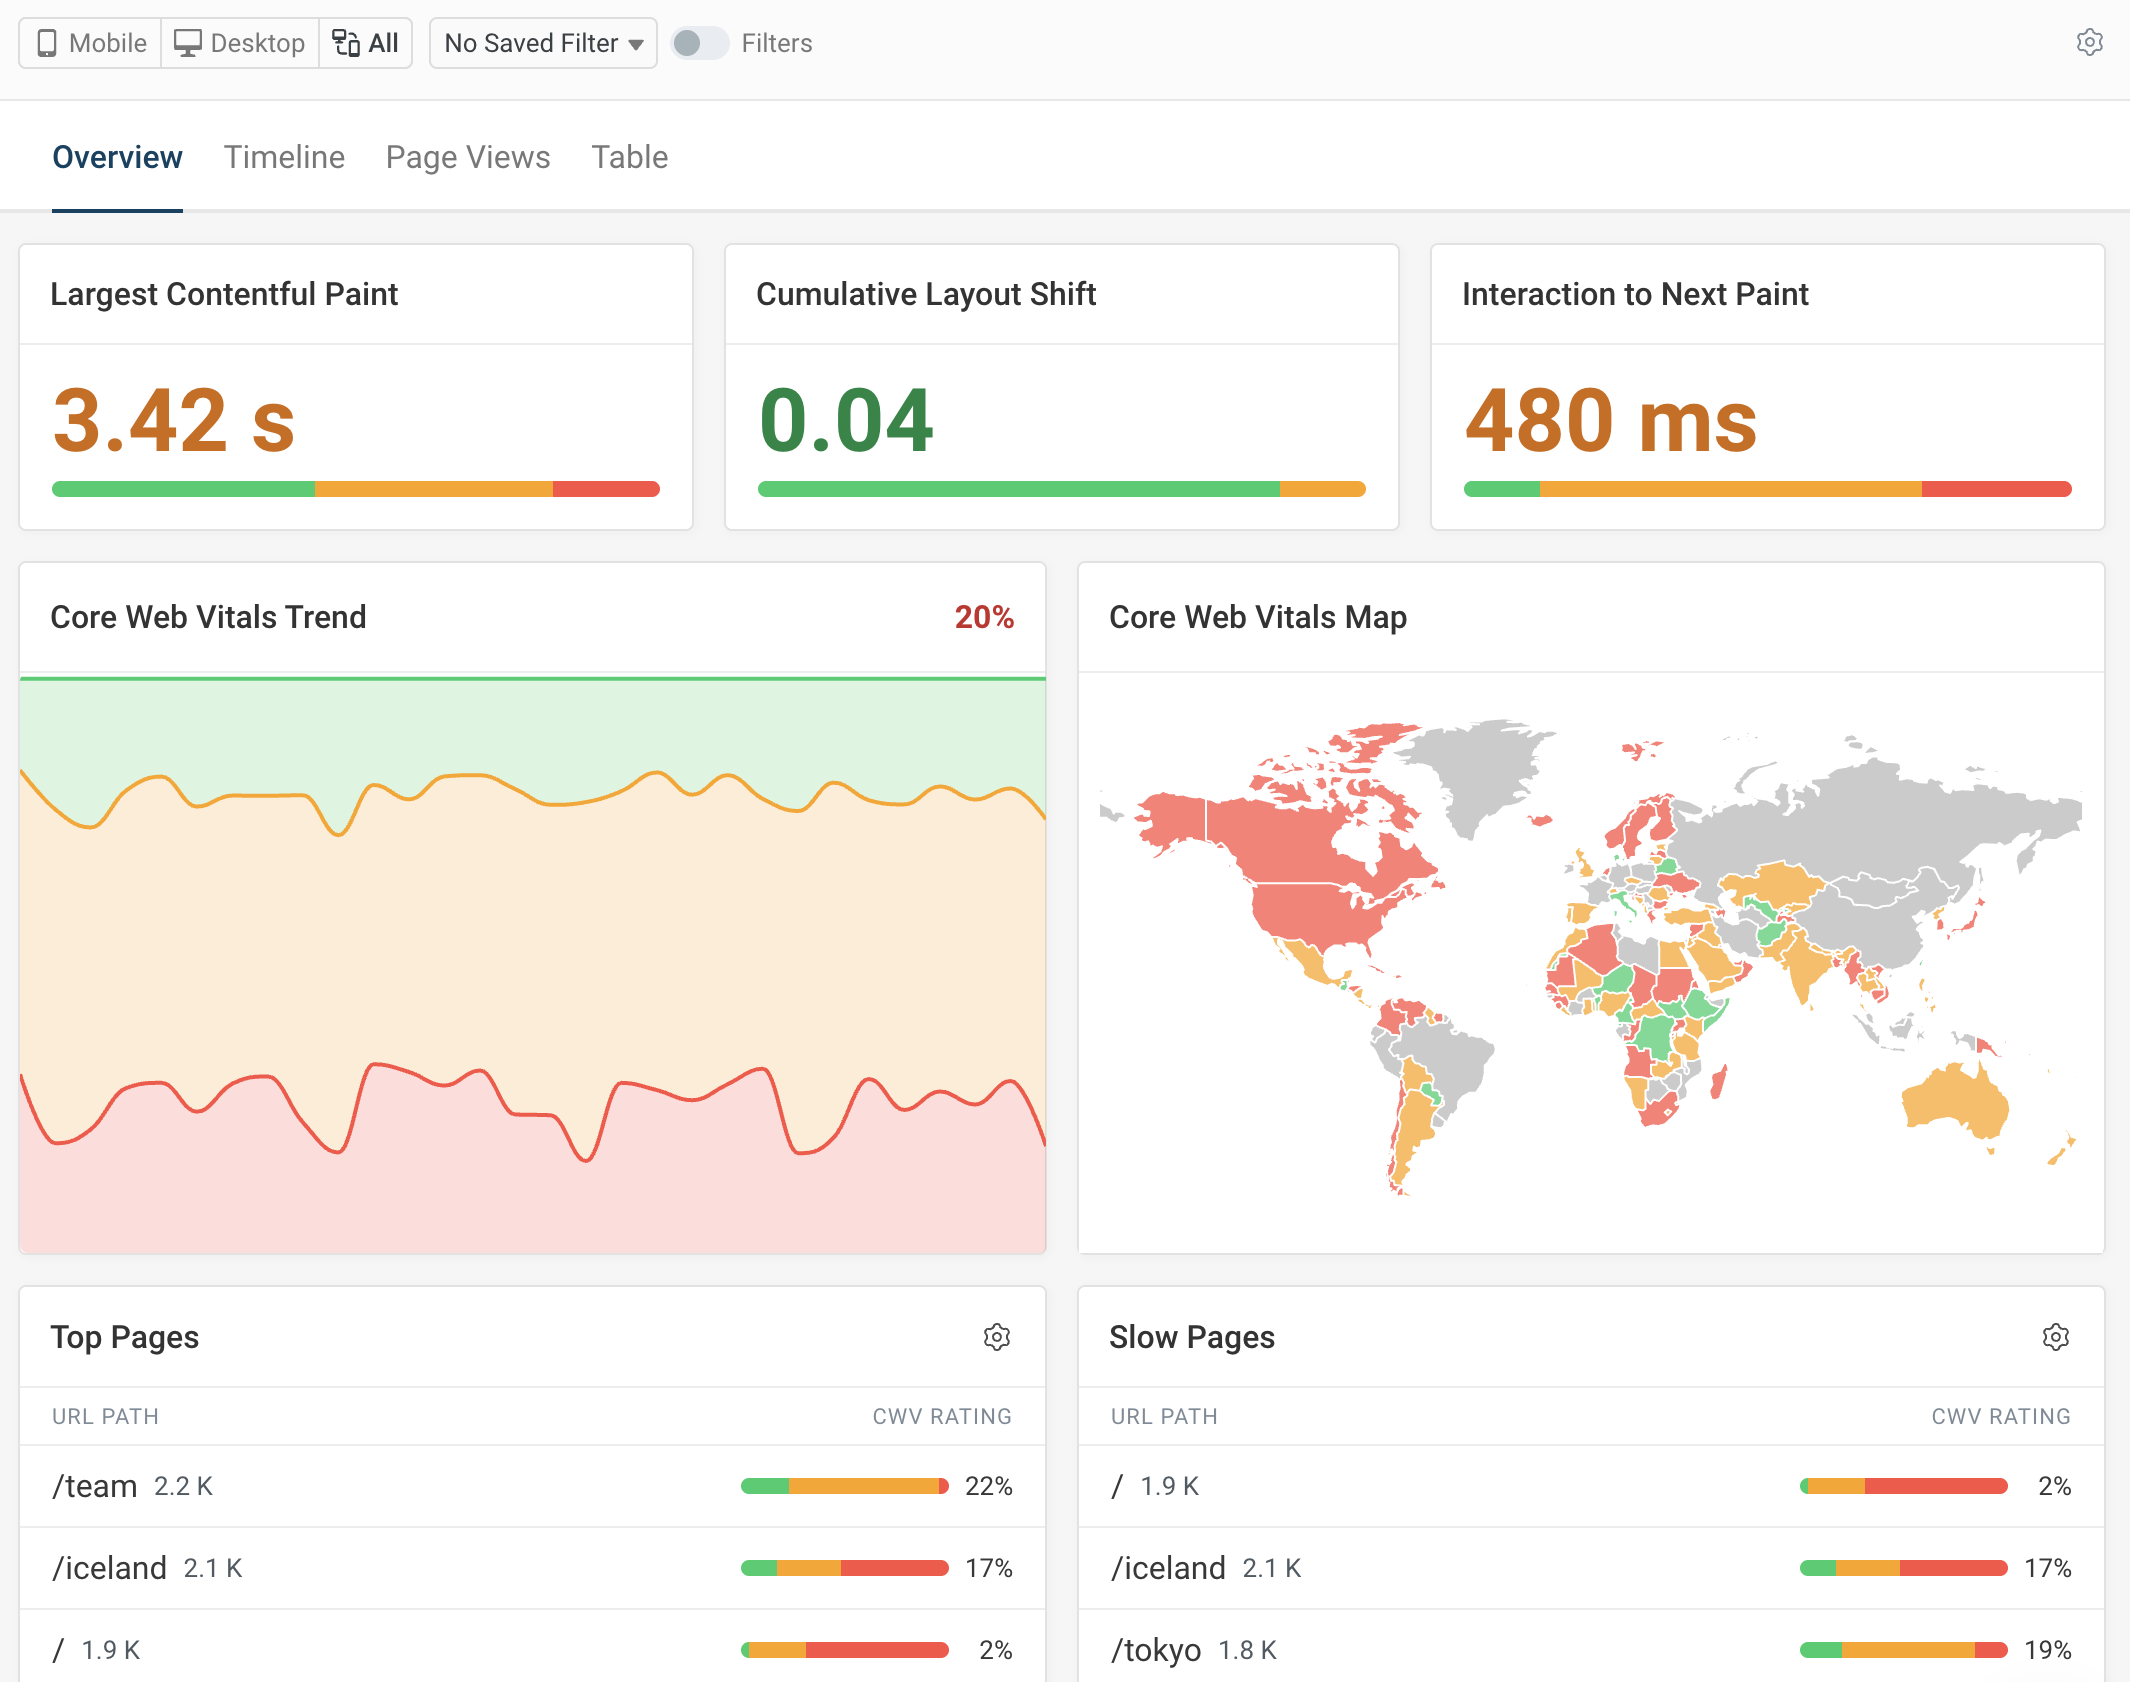
Easily filter data to focus on what you need

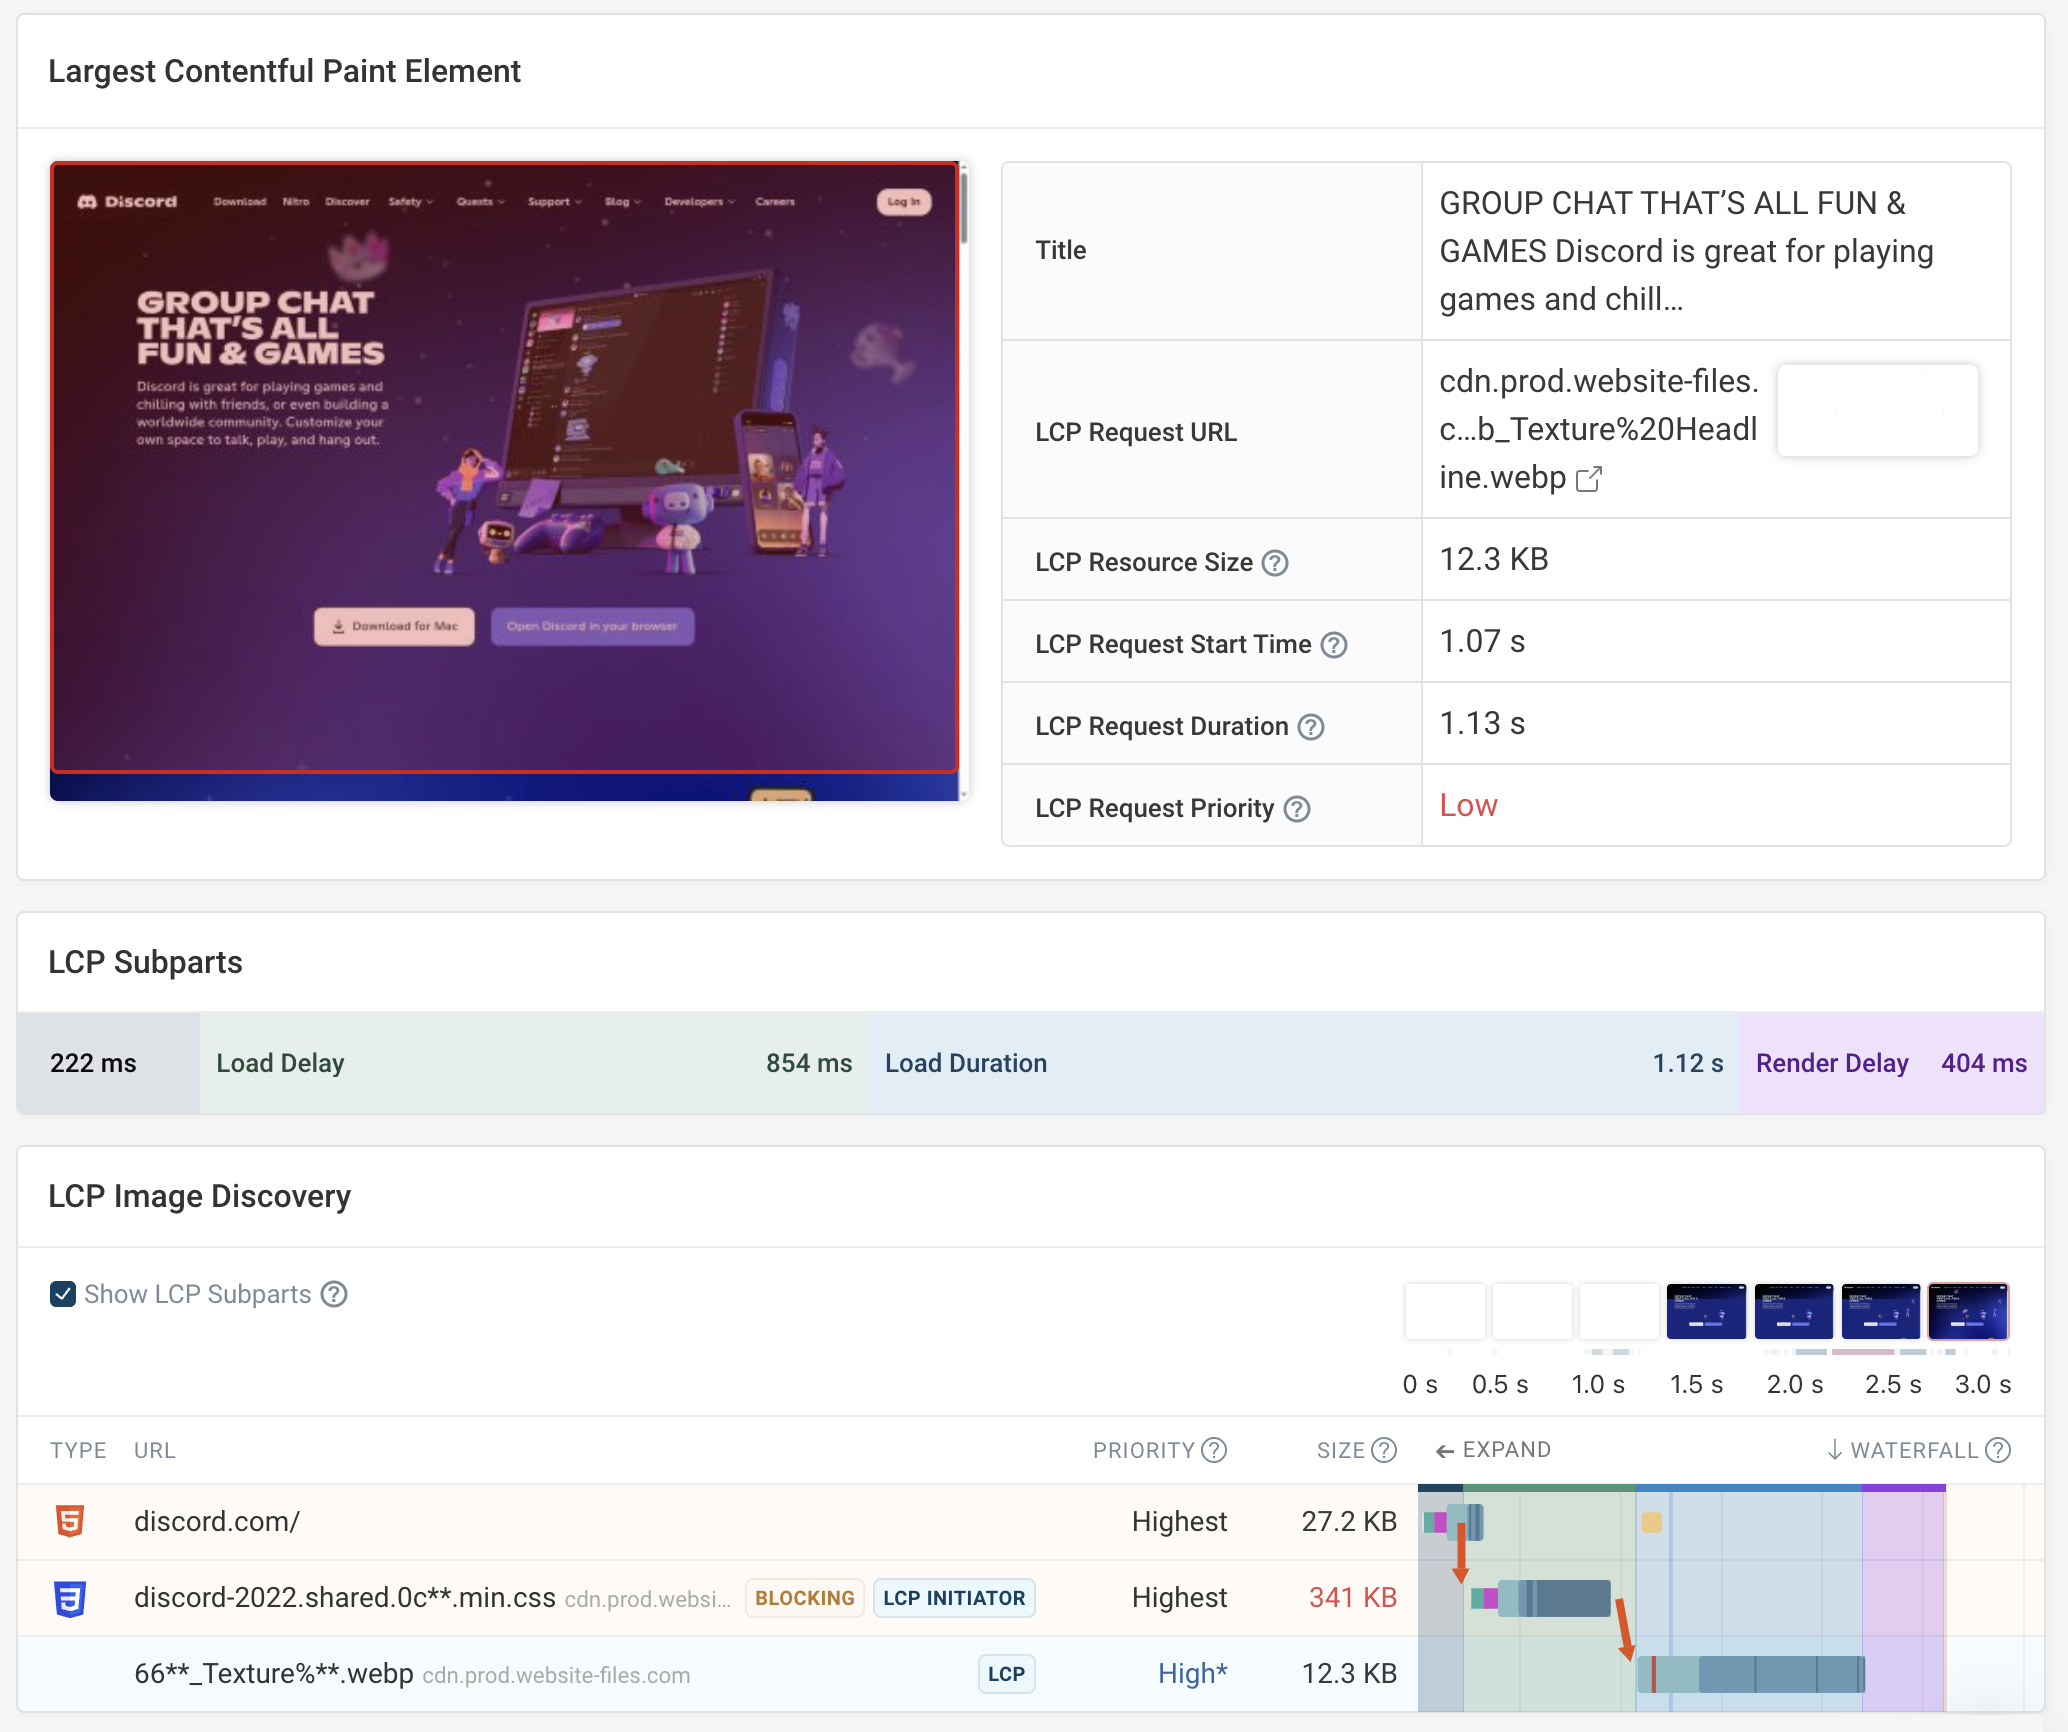
Want to optimize the Largest Contentful Paint? No problem! We'll show you the responsible DOM element and what network requests you need to speed up.

Industry-leading request waterfall

What requests are render-blocking? Are any resources preloaded? Does the LCP image use the fetchpriority attribute? How is bandwidth allocated across requests?

Our waterfall chart shows all of this information and puts it into context.

LCP Data

Detailed regression reports

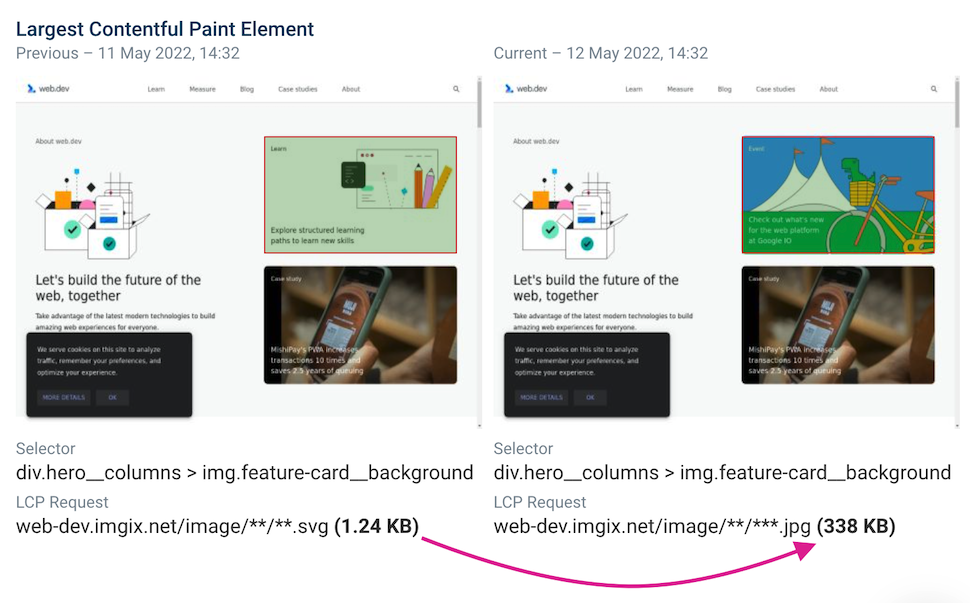
Understand metric changes with ease

Wondering why your LCP went up? Simply click on the regression in the chart to see what changed between the two test results.

Set up performance budgets

Configure custom alert thresholds and make sure your pages stay in budget.

Regression in LCP

Integrate with your workflow

Front-end monitoring alerts

Send alerts by email, in Slack, or in Microsoft Teams.

API and webhooks

Trigger page tests with the API and save test results to your own infrastructure.

Integrate with GitHub, Vercel, and Netlify

Catch regressions early by testing every pull request an CI.

Export monitoring data

Download metrics as CSV or JSON.

DebugBear Integrations
”DebugBear delivers the best stats for before and after changes in exquisite detail. It also shows clear and easy to find data for Google's Web Vitals.
Web peformance monitoring user profile picture
Tony Cosentino
Owner at The WP Guy
”The reporting data is very helpful in pinpointing what causes site speed issues – immediately actionable. It's well above and beyond the info you get from Lighthouse and the performance tests through Chrome.“
Web peformance monitoring user profile picture
Loren McDonald
IT Director
The most actionable-info packed page speed visualization available. DebugBear provides unique features that are crucial to debugging complex issues, like request-chain visualization."
Web performance testimonial photo
Robin Marx
Web Protocol and Performance Expert

Set up monitoring for your development team.

No credit card required.
Start free 14-day trial

You are using an old browser that is not supported anymore. You can continue using the site, but some things might not work as expected.