Earlier this month Google released the CrUX History API. CrUX is the Chrome User Experience Report which provides real-user page speed metrics for millions of websites. The History API allows us to see how the speed of a website has changed over time.
This article explains how you can use the API to look up page speed data for a website.
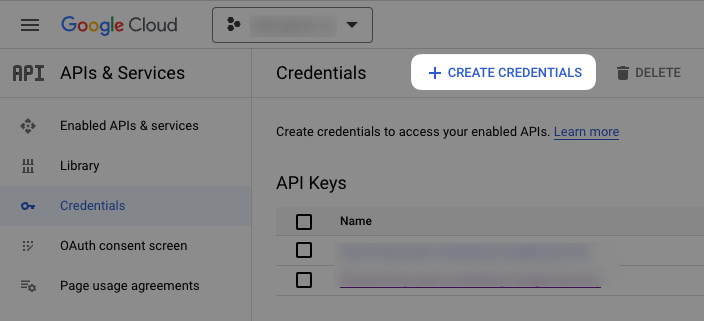
Obtain an API key
To use Google’s API you need a Google Cloud account. Then you can click Create Credentials on this page.
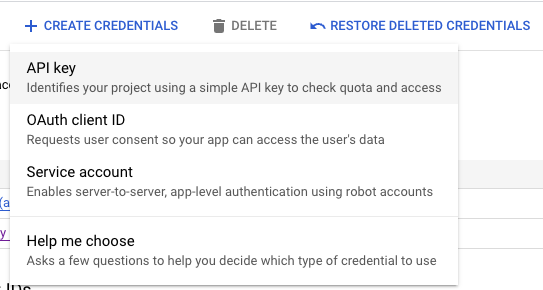
Select API key in the dropdown.
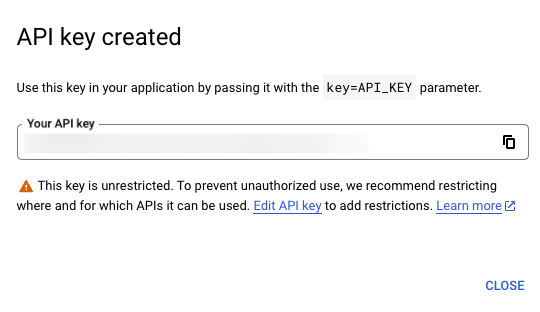
After waiting a bit the new API key will be presented to you. Copy it so you can use it later.
Set up a Node.js project
To set up your Node project:
- Create a new folder on your computer for the project code
- Run
npm init --yes - Run
npm install axios - Create a
crux.jsfile for your code
We’ll use the axios library to make requests to the API.
Make your first request to the CrUX History API
You are now ready to use the API. Copy the code below into crux.js and replace PASTE_API_KEY_HERE with your API key.
const axios = require("axios");
const API_KEY = `PASTE_API_KEY_HERE`;
const url = `https://chromeuxreport.googleapis.com/v1/records:queryHistoryRecord?key=${API_KEY}`;

axios
  .post(url, {
    origin: "https://www.youtube.com",
    metrics: ["largest_contentful_paint"],
  })
  .then((res) => {
    console.log(JSON.stringify(res.data, null, 2));
  });
Run this code with node crux.js. The output will look something like this. I’ve removed some of the data to make it more readable. The full response shows 40 weeks worth of data.
{
  "record": {
    "key": {
      "origin": "https://www.youtube.com"
    },
    "metrics": {
      "largest_contentful_paint": {
        "histogramTimeseries": [
          {
            "start": 0,
            "end": 2500,
            "densities": [0.38177490234375, 0.37835693359375]
          },
          {
            "start": 2500,
            "end": 4000,
            "densities": [0.23614501953125, 0.239227294921875]
          },
          {
            "start": 4000,
            "densities": [0.382080078125, 0.382415771484375]
          }
        ],
        "percentilesTimeseries": {
          "p75s": [5881, 5845]
        }
      }
    },
    "collectionPeriods": [
      {
        "firstDate": { "year": 2022, "month": 8, "day": 7 },
        "lastDate": { "year": 2022, "month": 9, "day": 3 }
      },
      {
        "firstDate": { "year": 2022, "month": 8, "day": 14 },
        "lastDate": { "year": 2022, "month": 9, "day": 10 }
      }
    ]
  }
}
collectionPeriodsshows the week when the data was collected from Chrome userspercentilesTimeseriesshows an average load time for users, in this case the 75th percentile (so 25% of users waited more than 5881 milliseconds for the page to load)histogramTimeseriesshows the Good/Needs Improvement/Poor buckets Google uses to evaluate the Largest Contentful Paint metric (here 38.2% of experiences were good, 23.6% of experiences were ok, and 38.2% were poor)
Analyze the data
Viewing a big blob of JSON isn’t very exciting. Is Youtube getting faster or slower?
We can change the code as follows to view a summary of the Largest Contentful Paint trend.
axios
  .post(url, {
    origin: "https://www.youtube.com",
    metrics: ["largest_contentful_paint"],
  })
  .then((res) => {
    const record = res.data.record;
    const collectionPeriods = record.collectionPeriods;
    const p75s =
      record.metrics.largest_contentful_paint.percentilesTimeseries.p75s;

    const firstLcp = p75s[0];
    const lastLcp = p75s[p75s.length - 1];
    const firstCollectionPeriod = collectionPeriods[0];
    const lastCollectionPeriod =
      collectionPeriods[collectionPeriods.length - 1];

    console.log(
      `75th percentile LCP changed from ${firstLcp} ms to ${lastLcp} ms`
    );
    console.log(
      `Between ${stringifyPeriod(firstCollectionPeriod)} and ${stringifyPeriod(
        lastCollectionPeriod
      )}`
    );
  });

function stringifyPeriod(period) {
  return `${period.firstDate.year}-${period.firstDate.month}-${period.firstDate.day}`;
}
After running our script this is what’s shown in the console:
75th percentile LCP changed from 5881 ms to 5341 ms
Between 2022-8-7 and 2023-1-22
Between August 2022 and January 2023 the Youtube website has become faster. Or at least their visitors started getting faster network connections and devices.
Request more metrics
So far we’ve only requested the LCP, but the CrUX History API supports 6 different metrics:
- experimental_time_to_first_byte
- first_contentful_paint
- largest_contentful_paint
- first_input_delay
- cumulative_layout_shift
- experimental_interaction_to_next_paint
Filtering data
So far we've been looking at data for all users on the website. The formFactor parameter lets us filter that down to just PHONE or DESKTOP users.
axios.post(url, {
  origin: "https://www.youtube.com",
  formFactor: "PHONE",
  metrics: ["largest_contentful_paint"],
});
Fetching URL-level data
To load data for just the Youtube homepage instead of the whole website you can rename the origin parameter to url.
axios.post(url, {
  url: "https://www.youtube.com",
  formFactor: "PHONE",
  metrics: ["largest_contentful_paint"],
});
Handling API errors
What if Google doesn’t have data for a website? To address that we need to add a catch handler to the axios request.
axios
  .post(url, {
    origin: "https://www.abc987.com",
    metrics: ["largest_contentful_paint"],
  })
  .then((res) => {})
  .catch((err) => {
    console.log(err.response.data);
  });
Node now prints the following response:
{
  "error": {
    "code": 404,
    "message": "chrome ux report data not found",
    "status": "NOT_FOUND"
  }
}
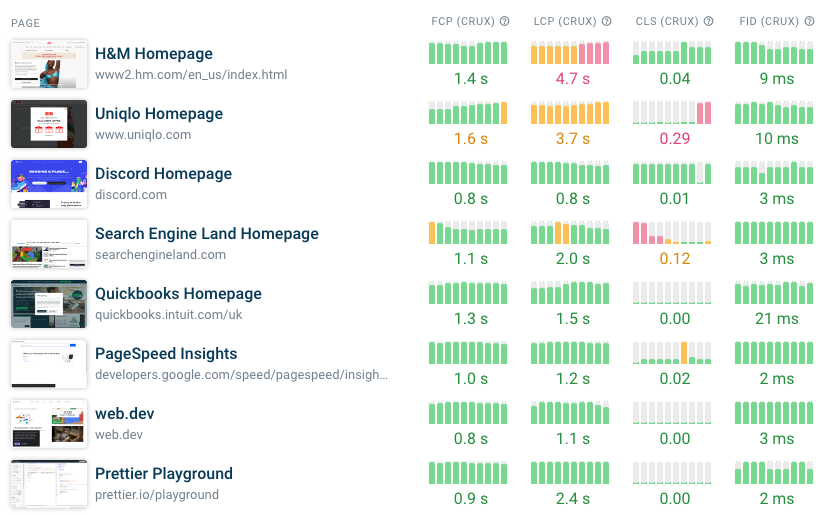
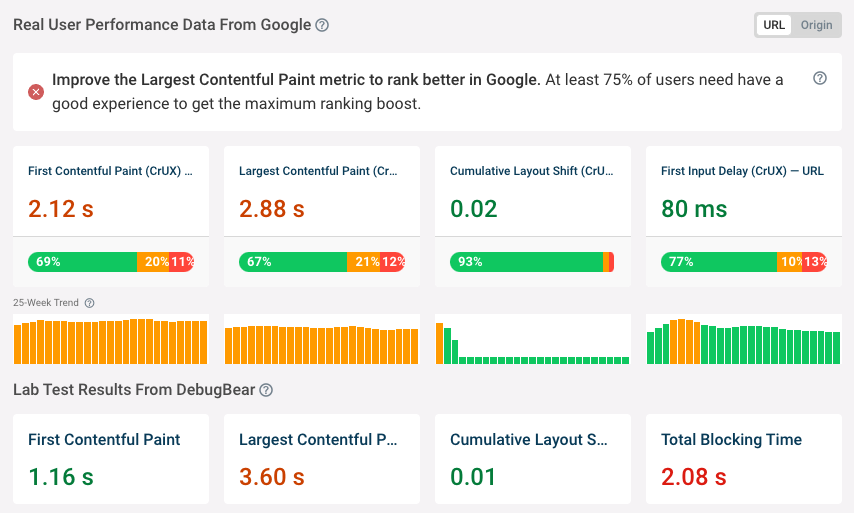
Run a free speed test to view real user Core Web Vitals
You can use the DebugBear website speed test to view Core Web Vitals data for the last 40 weeks.
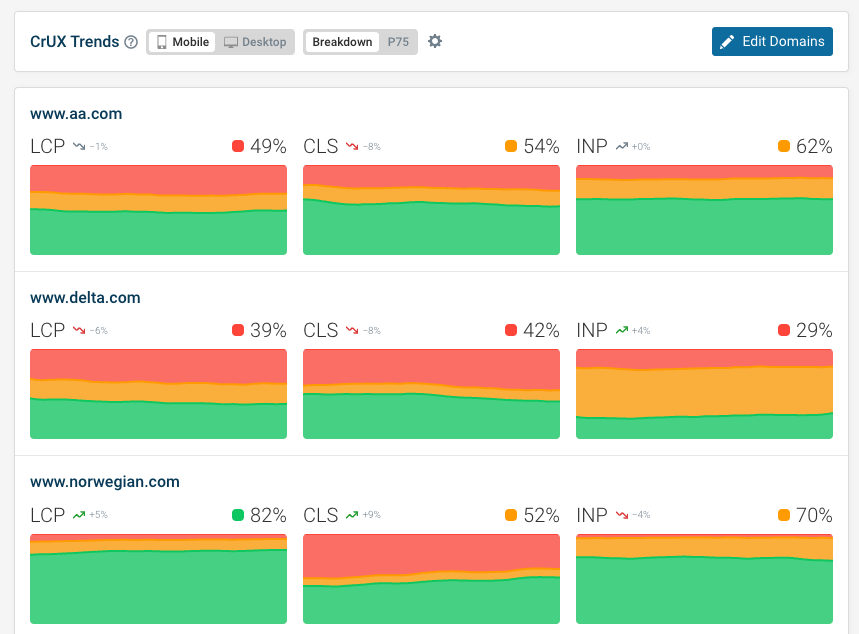
CrUX History dashboards
The CrUX Trends dashboard in DebugBear shows Core Web Vitals scores for your own website and those of your competitors.
See performance trends in your industry, check Time to First Byte and First Contentful Paint scores for debugging, and view either 75th percentile data or the percentage of good experiences.
Monitoring CrUX data continuously
Are you trying to keep on top of Google’s Core Web Vitals data? DebugBear not only runs daily lab tests but also uses the CrUX API to show performance trends over time.
Sign up for a free 14-day trial.