
PageSpeed Insights is a free tool that Google offers to website operators. It automatically analyses your website, focusing on page load time.
This article will look at how reliable PageSpeed Insights data is and what role it plays for SEO.
What is Google PageSpeed Insights?
PageSpeed Insights (PSI) is a free tool by Google that measures the loading time of your website. Website performance impacts user experience and is a Google ranking factor.
PSI reports both field data from real users and lab data collected on Google servers. The real user data is collected as part of the Chrome User Experience Report (CrUX). The lab data is based on the free open-source Lighthouse tool.
In addition to testing performance Lighthouse also assesses SEO, accessibility, and general website best practices.
When running a speed test on PSI Google automatically tests your site on desktop and mobile devices.
Is PageSpeed Insights accurate?
To answer this question we need to look at the real user and the lab data separately.
The real user data is generally reliable – it tells you about real experiences that a subset of your users have had. However, it also excludes some experiences, for example those of Firefox users or Chrome users on iOS.
However, the lab data can sometimes be misleading, due to the network settings used to collect data. Google does also not run tests on a slow device but rather runs a simulation of how a page might have loaded on a slower connection, which can be inaccurate.
Field Data
The real user data in Google PSI is collected from Chrome users who:
- Use Chrome on desktop or Android (no data is collected on iOS)
- Are logged into their Google account
- Have opted into usage statistics reporting
While this does not cover all user experiences, the field data in PageSpeed Insights is pretty accurate overall. In some cases it may not paint a full picture, for example if you have a health-related website where many users use Chrome’s Incognito Mode.
It is also unclear how data from many users is aggregated, and whether a small subset of users who are very active could skew the overall metrics. If you want more control over how data is collected from real-world users of your website, DebugBear offers a comprehensive performance monitoring solution.
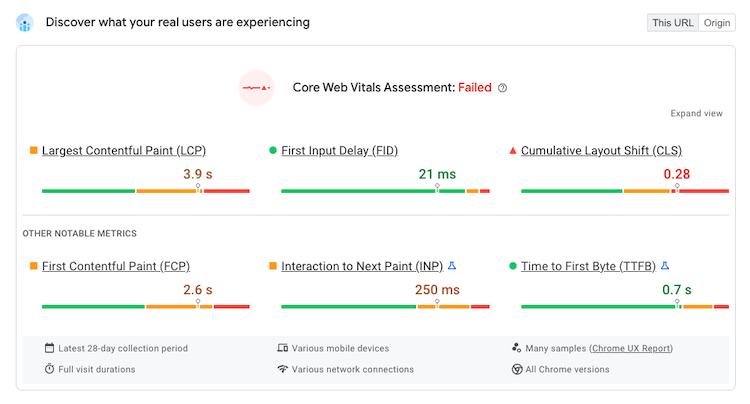
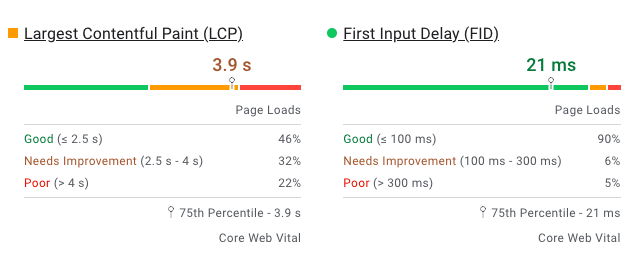
Keep in mind that the primary number reported by Google is the 75th percentile of experience. So if your Largest Contentful Paint (LCP) is reported as 3 seconds then that means that 75% of users had an LCP below 3 seconds and 25% had an LCP that took more than 3 seconds.
Google aggregates data over the last 28 days, so if you’ve recently optimized your website the field data may no longer be accurate. You should start to see improvements after a few weeks.
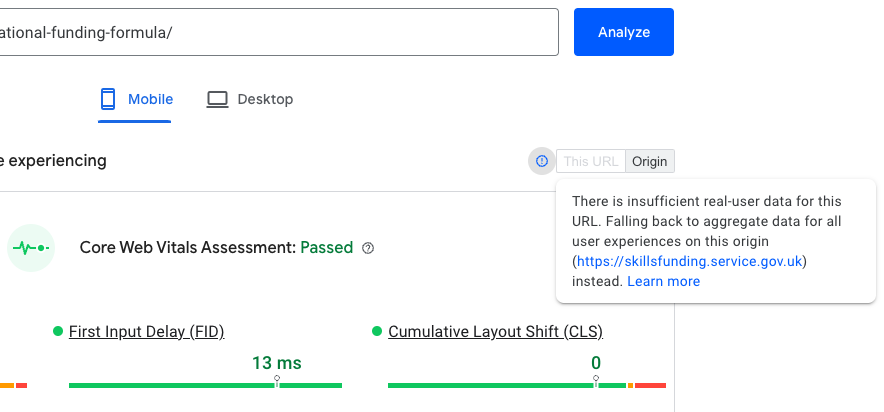
Origin-level and URL-level data
Not all pages on the internet get enough traffic for Google to provide page speed data. In those cases PageSpeed Insights will show this message:
There is insufficient real-user data for this URL. Falling back to aggregate data for all user experiences on this origin.
If you're not able to replicate performance issues on a page it may just be that this particular URL isn't affected by the issue.
Lab Data
The lab data in PageSpeed Insights is generally less reliable than the field data. Lab data is collected in a controlled lab environment by loading your website from a Google server.
A big factor here is that Google uses something called simulated throttling. That means data is collected quickly on a fast connection, so that running the test doesn’t take too long.
But after running the test Google simulates how the page might have loaded on a slower connection. Running a simulation instead of collecting real data can introduce inaccuracies.
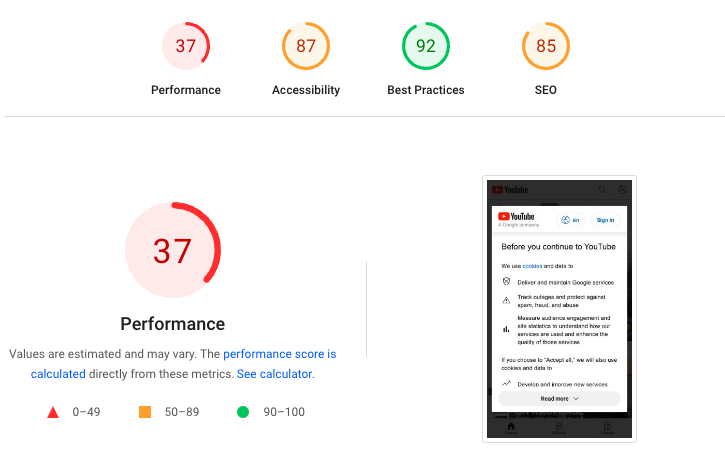
When looking at PageSpeed Insights data you might sometimes find you have a fast website but a poor Performance score.
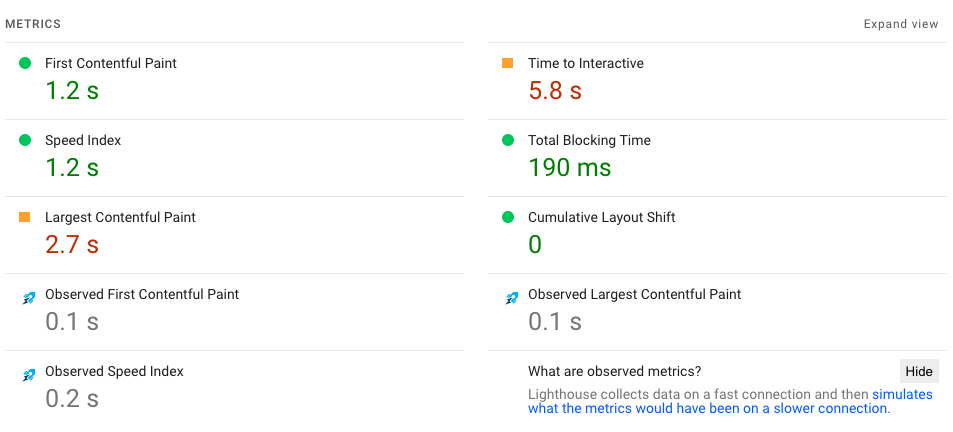
View observed metrics
You can use the site speed Chrome extension to view the original data collected in Chrome.
For example, in this result the original “observed” data shows that the First Contentful Paint and the Largest Contentful Paint happened at the same time. However the simulated data shown by PageSpeed Insights incorrectly suggests that the LCP only happened much later.
Other page speed tools like DebugBear use the more reliable packet-level throttling approach.
Also keep in mind that the lab test assumes a very slow network with a bandwidth of just 1.6 Mbps. Real users will often have a much faster connection.
That means that the field data often ends up looking better than the lab data. And if the lab data is better than the field data that often means the lab data is wrong.
So while the field data looks at the slowest 25% of experiences, the lab data might be more representative of the slowest 5 to 10% of experiences. However, that does not mean it’s wrong – a small percentage of users really will have very poor experiences.
Lab data also has other limitations that don’t apply to field data. For example, lab data often does not consider user interactions that happen after the initial load of the page. Your visitors may experience a lot of layout shift when going through a checkout flow on your site, but a lab test may show no layout shift at all.
Does PageSpeed Insights affect SEO?
Yes, the real user data in PageSpeed Insights does impact how high you rank in Google. If you get “Good” scores across all three Core Web Vitals metrics this will help your SEO.
The lab test is only run to provide diagnostics data that you can use to speed up your website. Even if you get a low Performance score your website can still rank well as long as real users have a good experience.
You can also use Google Search Console to learn more about how site speed is impacting your rankings.
How does PageSpeed Insights work?
When you enter your website URL into Google PSI two things happen:
- Google looks up your website in the real user CrUX dataset
- Google starts loading your website from their own servers using Lighthouse
You then receive a performance report. Use the field data to decide whether your users have a good experience or if you need to make your website faster. The more detailed lab data can then be used to identify potential opportunities for improvement.
What is a good Google PageSpeed Insights score?
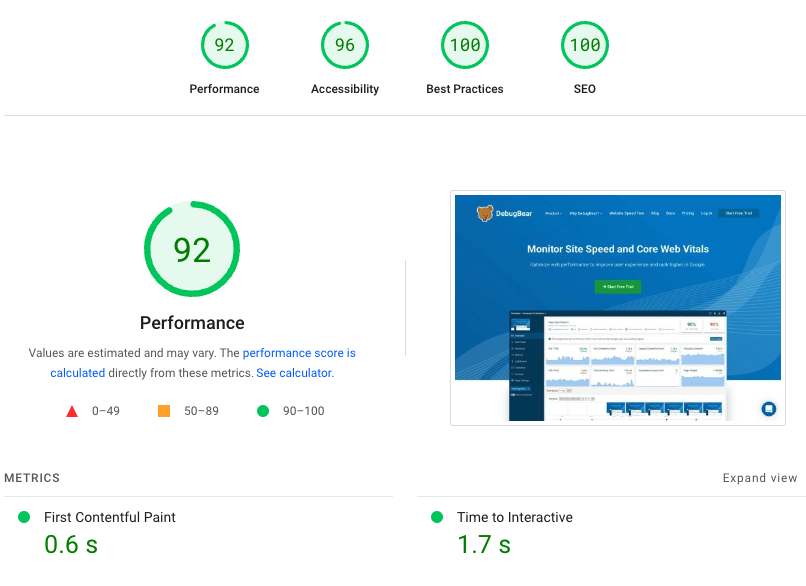
A good Performance score in PSI is 90 or over. However, the Performance score is not the most important factor, and users can still have a good experience if your score is 50 or even lower.
You should instead focus on the real user data in PageSpeed Insights. At least 75% of users should have a good experience for each of the three Core Web Vitals metrics.
How can I improve my PageSpeed Insights score?
To make your website load faster and score better in PSI you can:
- Optimize server response time
- Speed up render blocking resources
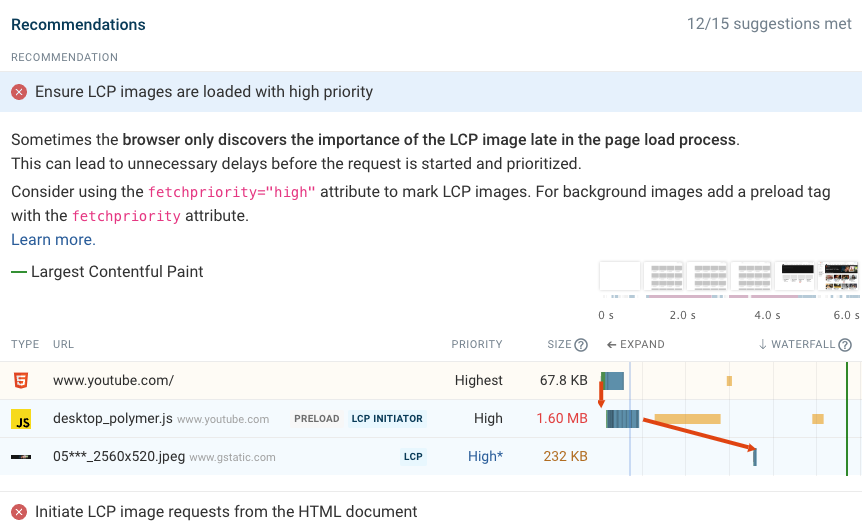
- Use Priority Hints to load your main image faster
- Avoid unnecessary server connections
What can I use instead of PageSpeed Insights?
To get more reliable lab data you can use the free DebugBear speed test. Enter a URL just like on PSI to check the loading speed of your website.
Instead of simulating a slow device, the DebugBear test slows down the network and then opens your website in Chrome. That may take a bit longer but you get more accurate data as a result.
Each test result includes recommendations that you won’t find in PageSpeed Insights. For example, you can:
- Identify oversized web fonts, HTML, or CSS
- Check if styling is hiding content
- Validate resource hints
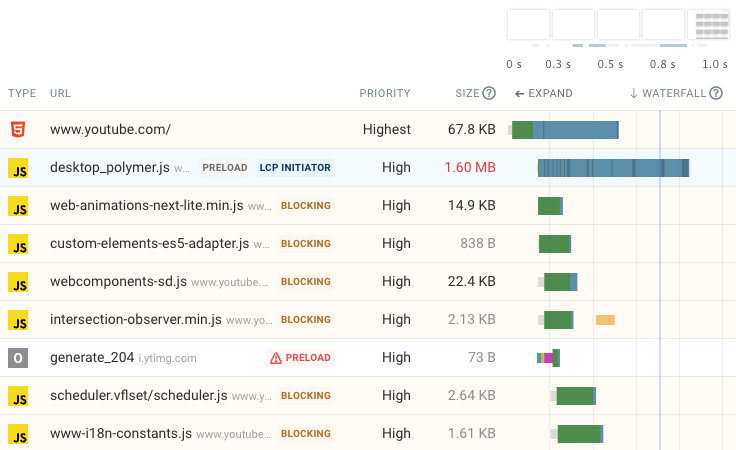
The request waterfall is also really helpful to identify render blocking network requests and optimize them. Use DebugBear as an alternative to PageSpeed Insights for testing website performance.
Monitoring page speed over time
Running tests continuously can save you time and lets you see how the performance of your website is changing. Get alerts when there's a performance regression and compare test results to identify the cause of metric changes.
Learn more or sign up for a free 14-day trial.

DebugBear keeps track of Google CrUX data alongside the synthetic test results, allowing you to correlate metric changes across the two data types.
Here we can see an increase in the Largest Contentful Paint score that is gradually reflected in the CrUX data. At the same time, Cumulative Layout Shift improves in the lab test and then in the field data.

Our real user monitoring feature allows you to track Core Web Vitals across your whole website in real time.
You also get detailed debug data to identify visitor segments with poor experience and debug slow performance. For example, you can see what page interactions are slow and what scripts are delaying them. This provides a solid foundation to fix the Interaction to Next Paint metric.


Monitor Page Speed & Core Web Vitals
DebugBear monitoring includes:
- In-depth Page Speed Reports
- Automated Recommendations
- Real User Analytics Data