Measure And Optimize Time To First Byte (TTFB)
Nothing on a page can render before the first byte of HTML arrives, so every other page speed metric waits on Time to First Byte (TTFB). It's also the metric where tools disagree most about what they're measuring, which makes a slow TTFB easy to misdiagnose.
This article explains what TTFB covers, why different tools report different numbers, how to measure it, and how to bring it down.
What is Time to First Byte?
Time to First Byte (TTFB) is the time between the browser requesting a page and receiving the first byte of the response. It covers everything that happens before the server starts sending HTML: any redirects, the DNS lookup, establishing the TCP and TLS connection, and the time the server spends generating the response.
This is what Google reports as TTFB in its Chrome User Experience Report (CrUX) dataset. DebugBear calls it the Full TTFB to distinguish it from the narrower definitions some tools use.
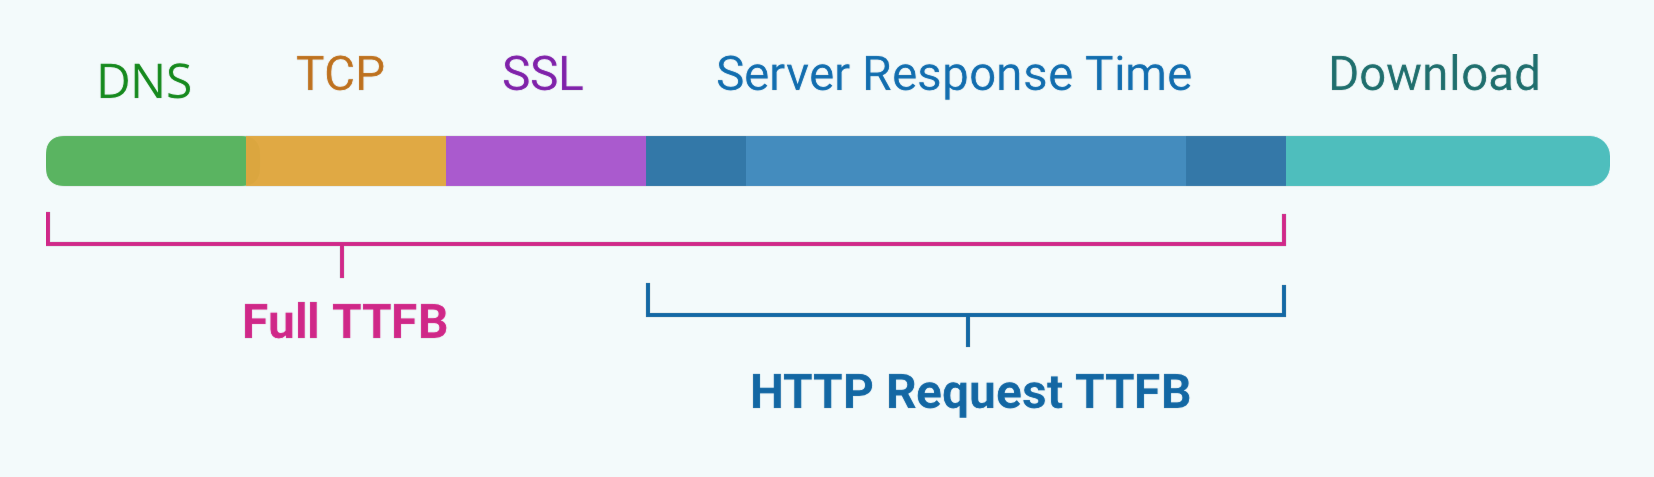
However, different tools use different definitions for TTFB.
When looking at the individual components of a request, TTFB often only measures the duration of the HTTP request itself. Time spent establishing a server connection is not included. We've marked this as HTTP Request TTFB in the diagram.
Chrome DevTools used to describe this as Waiting (TTFB) but now uses the term Waiting for server response to avoid ambiguity. In Lighthouse this metric is called server response time.
Robin Marx's Performance Calendar article TTFB doesn't mean what you think it means goes into these differences in depth.
It identifies three common definitions that start the clock at different points in the navigation timeline, and shows how subparts like DNS lookup, connection setup, and redirects are often zero depending on caching and connection reuse, which makes TTFB values from different tools and page loads hard to compare.
You can check the Full TTFB of any page, measured from several locations around the world, with the free DebugBear TTFB test.
Why is Time to First Byte important for user experience?
The longer the server response time, the longer website visitors have to wait for content to become visible. The Time to First Byte for the HTML document is the essential first step when loading a website.
In this request waterfall you can see a slow document request with a 3.1 second TTFB. That contributes significantly to the overall page load time of 5.7 seconds.
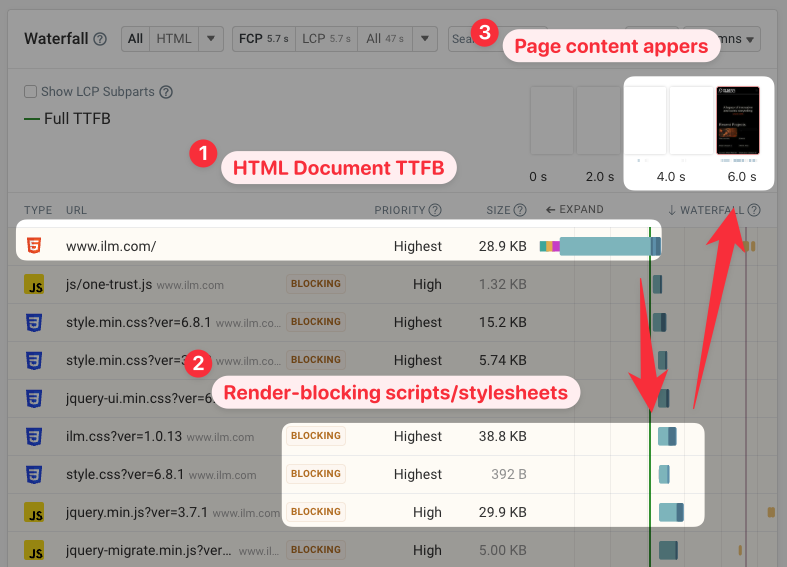
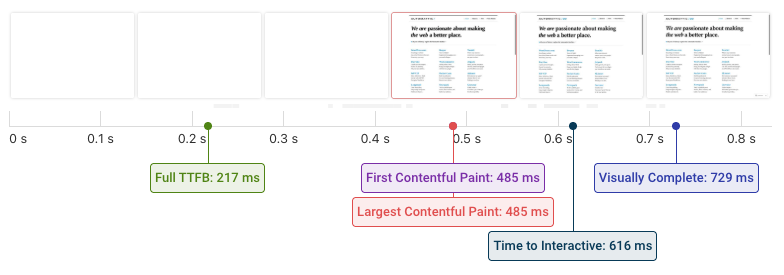
In contrast, a low TTFB makes your website render more quickly.
On this website, we can see that the server responds within 217 milliseconds, and the page is fully loaded in less than half a second.
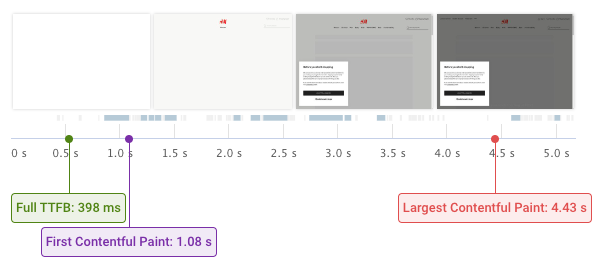
However, receiving the first byte often isn't sufficient as most pages have additional render-blocking resources that are loaded after the initial document request.
The First Contentful Paint (FCP) and Largest Contentful Paint (LCP) metrics measure when content actually becomes visible to the user.
This filmstrip shows a website with a fast TTFB that still takes a long time to load. In this case you need to take additional steps to improve your website performance.
What are the components of TTFB?
The four core components of the Time to First Byte metric are:
- DNS lookup
- TCP connection
- SSL connection
- HTTP request time
Before downloading a resource on the internet, browsers first need to establish a connection to the website server. After that, the actual request for the file can be made using HTTP.
Sometimes there are additional components to TTFB, for example:
- Wait time, waiting for service workers or cache lookups
- Redirect time if the initial URL the user opens redirects to a different URL
When viewing TTFB data you'll also often see the download time listed. But download time is not part of the TTFB, as it covers all bytes of the response instead of just the first byte.
Does TTFB include redirects?
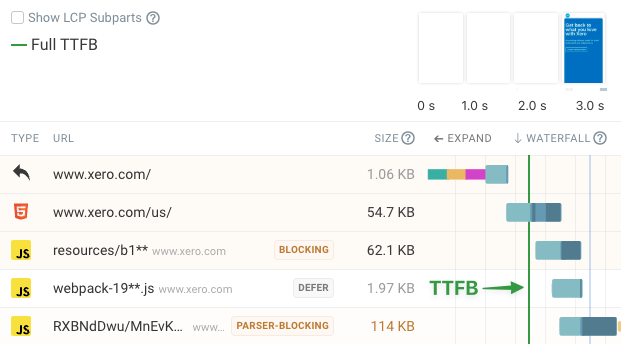
Redirects are included in the Full TTFB measurement.
In the example below, the initial server response consists of an HTTP redirect rather than HTML in the response body that the browser can display. The actual First Byte time is recorded when the second HTTP request returns an HTML document.
HTTP Request TTFB
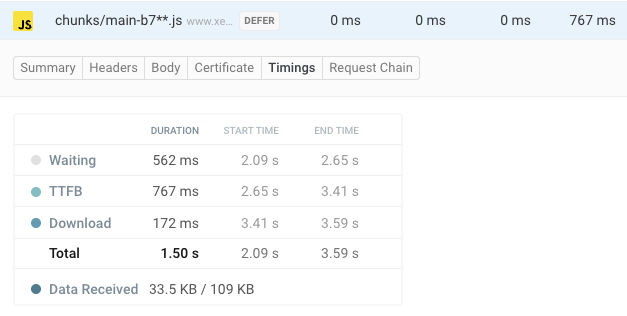
Every HTTP request that receives a response has a Time to First Byte. When talking about requests after the initial document request, TTFB usually only refers to the time spent waiting for a response to the HTTP request.
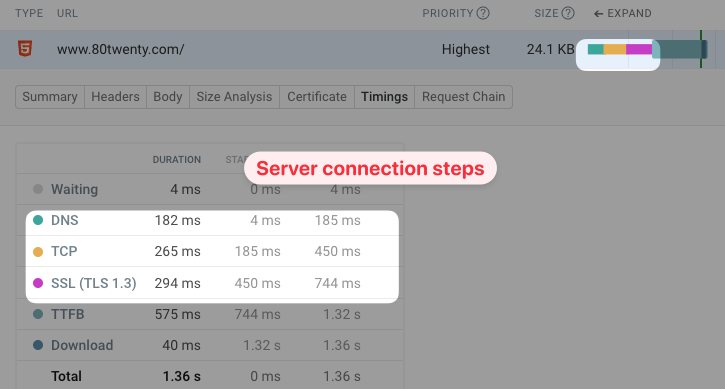
For example, you can see the per-request TTFB in DebugBear's Requests view by clicking on any request and then selecting Timings in the detail view. Here it forms only one part of the overall request duration.
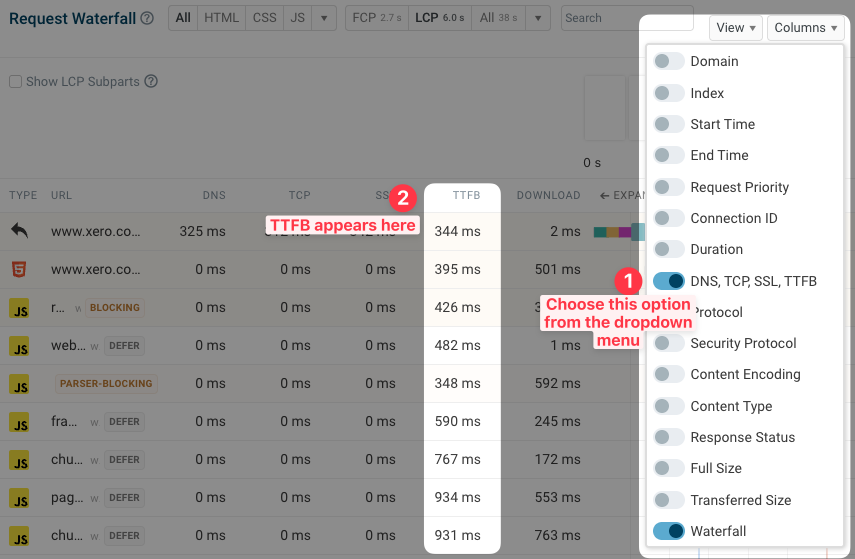
We can also show all TTFB timings as part of the request waterfall. Just select 'DNS, TCP, SSL, TTFB' in the Columns dropdown in the top-right.
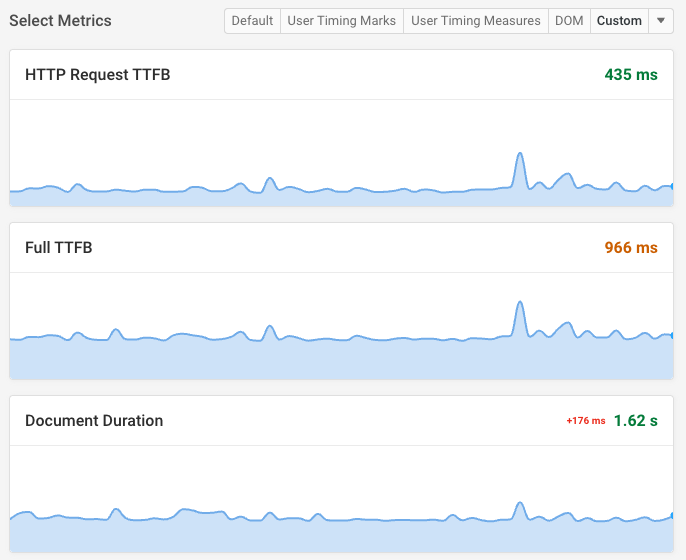
You can also view different document timings:
- HTTP Request TTFB: only looks at the HTTP request itself
- Full TTFB: measures Time to First Byte including connection setup and redirects
- Document Duration: measures HTML request duration including download time
Early hints and Time to First Byte
Early Hints are a protocol technology that lets servers tell the browser about additional page resources before the HTML document has started loading.
You can see an example of this here, where two fonts start loading before the first byte of the document arrives.
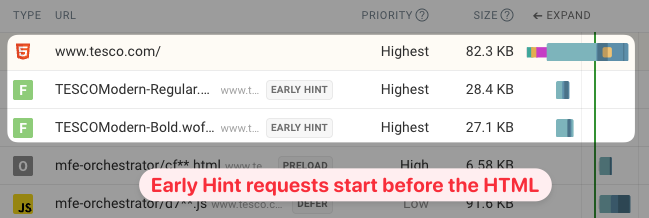
Is the first byte the first document byte or does the early hint response data also count? Currently this is not consistent across tooling.
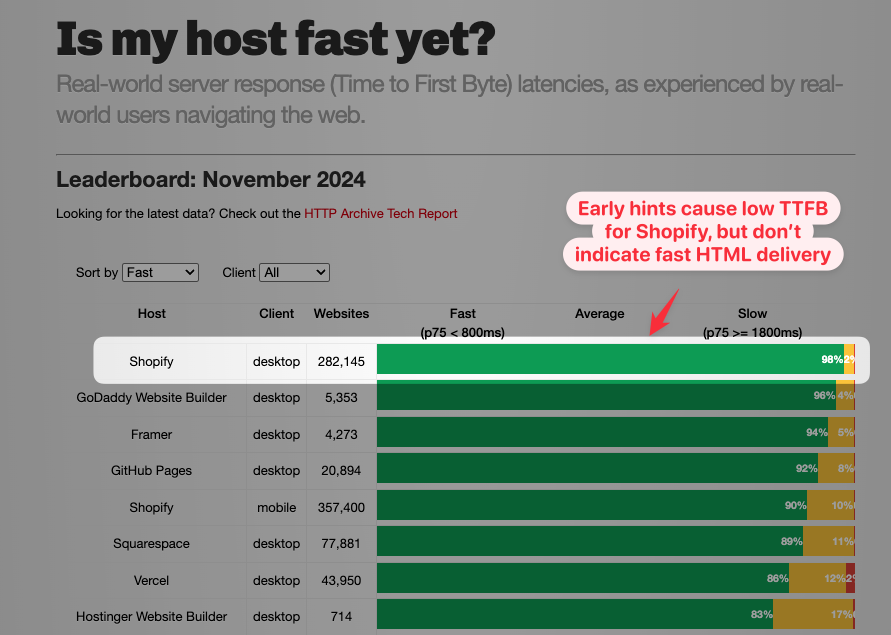
When looking at data, prefer user experience metrics like Largest Contentful Paint. TTFB-based rankings can be confusing, for example the "Is my host fast yet?" website reports great TTFB for Shopify, but this only reports Early Hints and not actual HTML delivery.
Does TTFB impact SEO?
Time to First Byte is not one of the Core Web Vitals metrics and Google does not directly use it as part of its search engine rankings.
However, TTFB does impact the Largest Contentful Paint and a slow server response can still hurt your SEO.
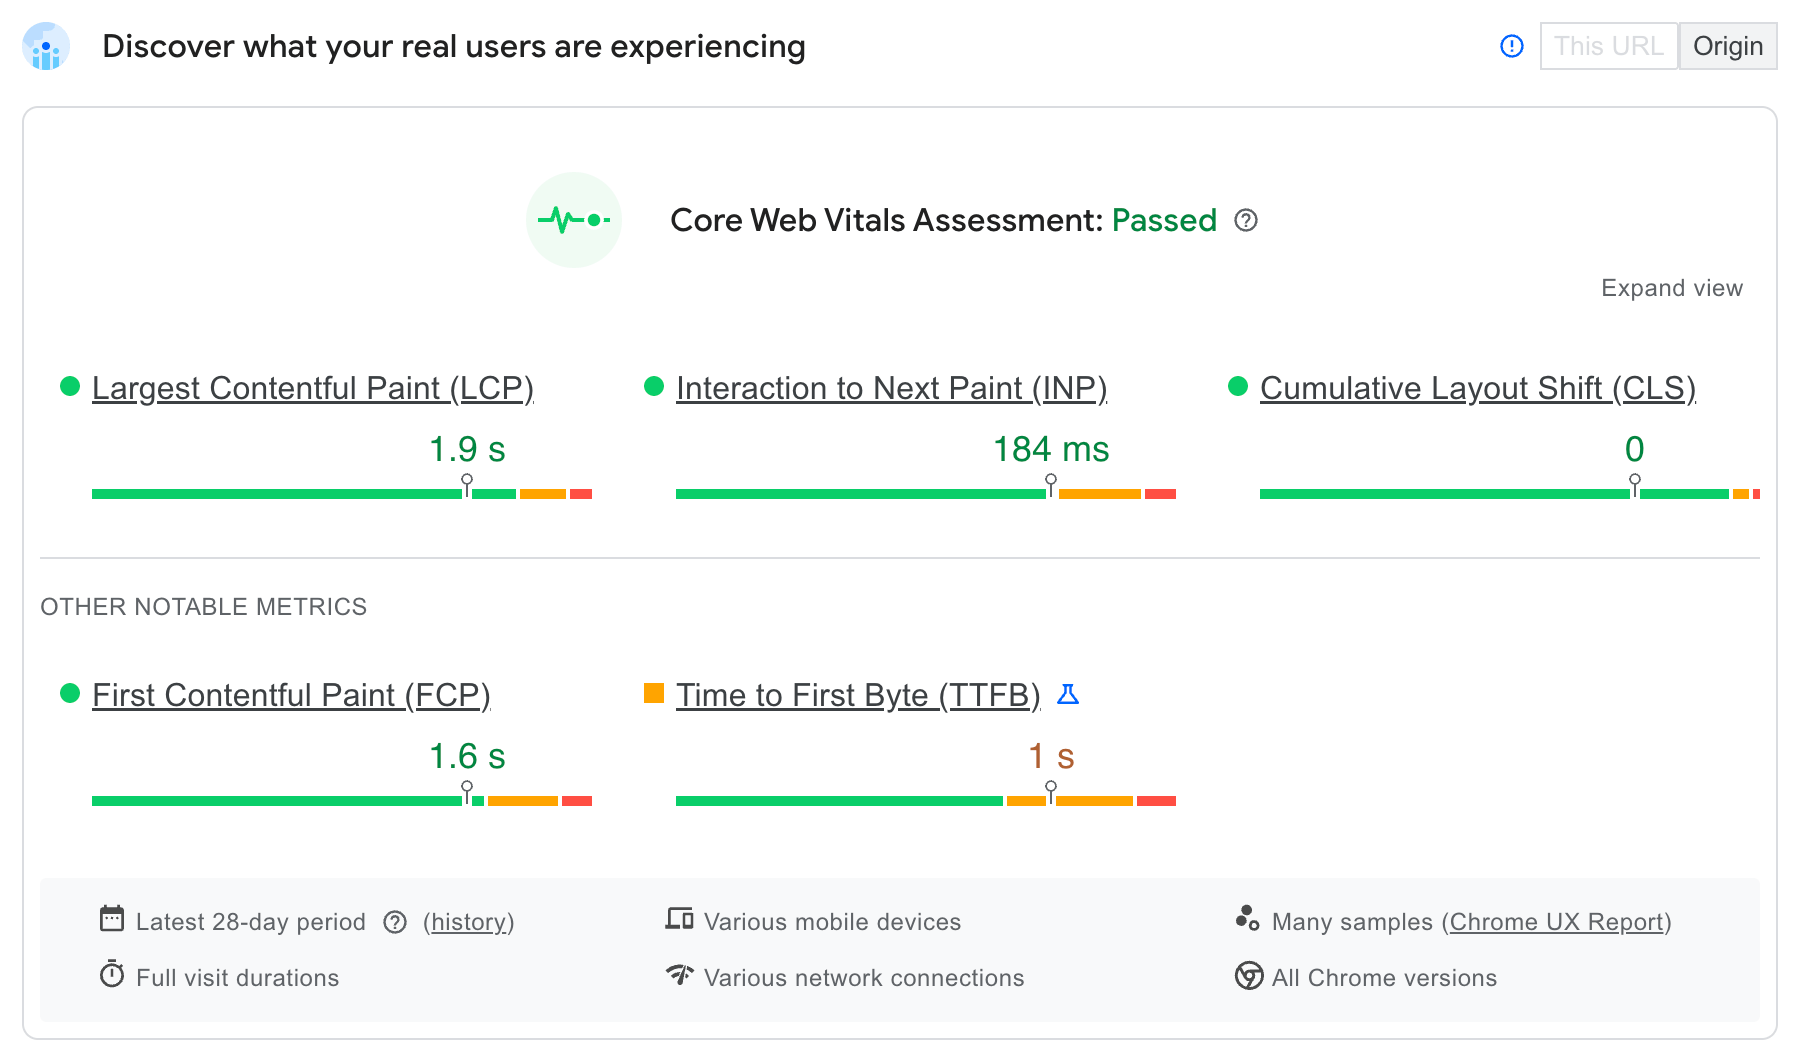
Google does include TTFB as part of the CrUX dataset for debugging purposes. You can use PageSpeed Insights to test what TTFB looks like for real users.
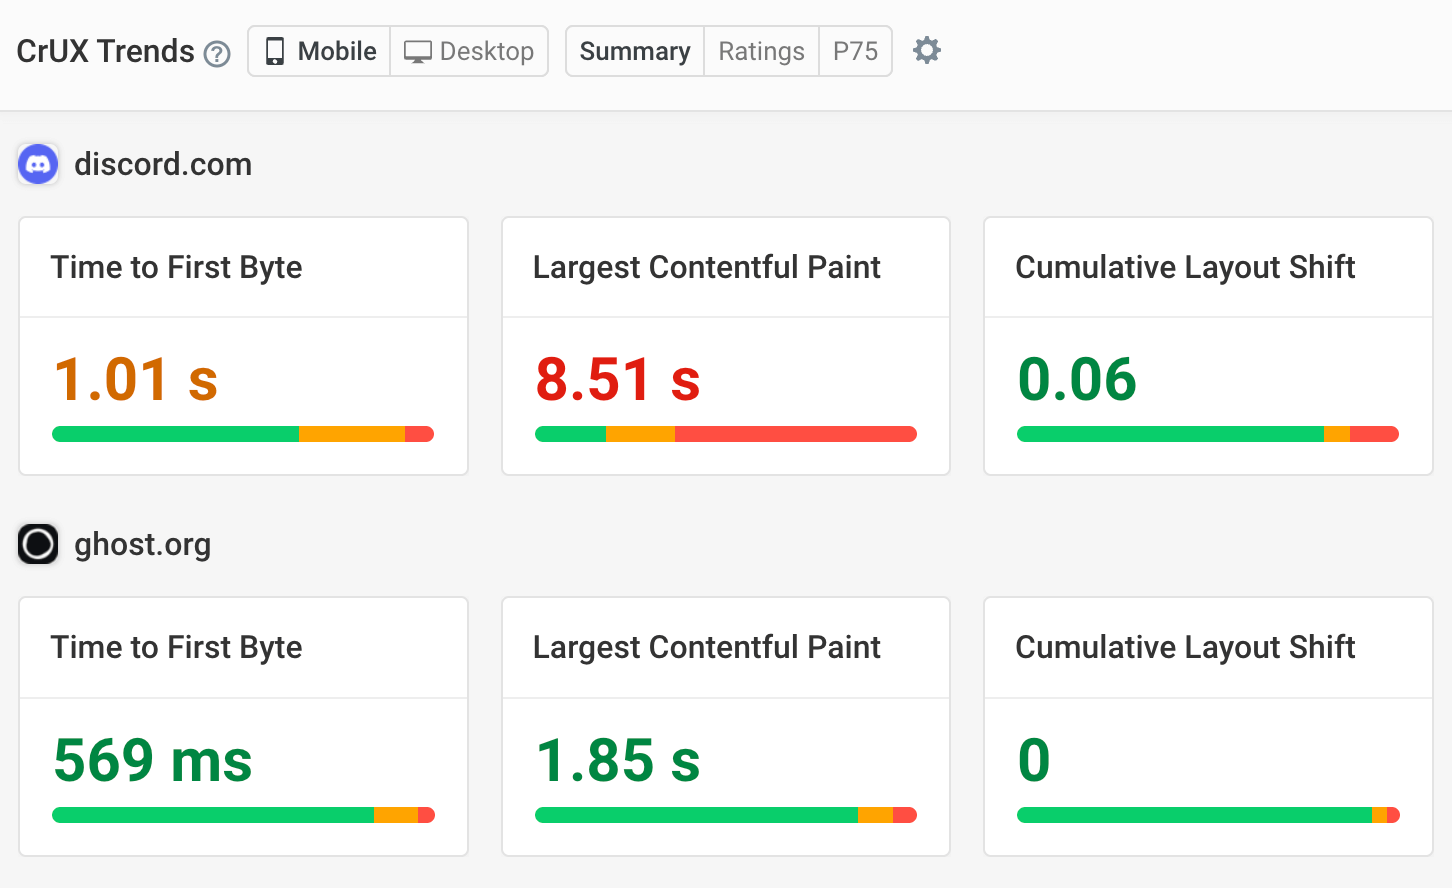
You can use DebugBear Core Web Vitals monitoring to keep track of TTFB and other performance metrics across lab-based tests, Google CrUX metrics, and real user data, and even benchmark your site against others in your industry.
What is a good TTFB?
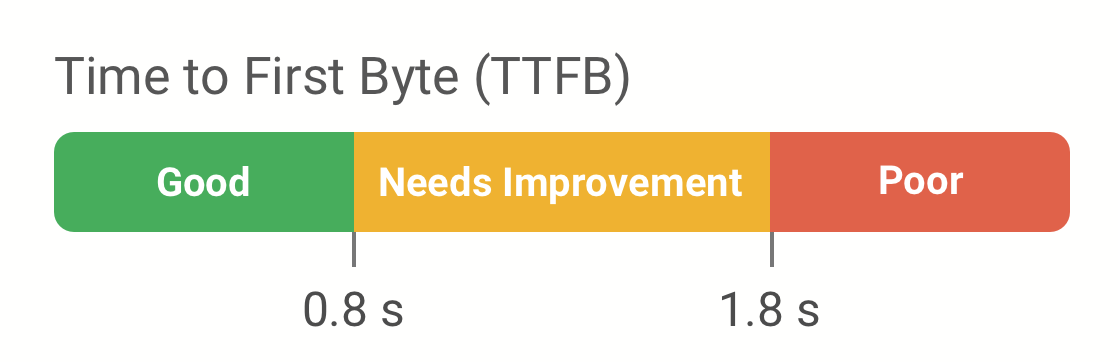
Google considers a Full TTFB of 800 milliseconds or less to be good. Values above 1.8 seconds are considered poor.
| Rating | TTFB |
|---|---|
| Good | 800 milliseconds or less |
| Needs improvement | Between 800 milliseconds and 1.8 seconds |
| Poor | More than 1.8 seconds |
TTFB is not a Core Web Vital, but Google still reports it in CrUX at the 75th percentile, so the value you see in PageSpeed Insights is the one that 75% of page loads were faster than.
In practice you should aim well below 800 milliseconds. The Largest Contentful Paint threshold is 2.5 seconds and TTFB is only the first step, so a server that takes 800 milliseconds leaves little time to load and render the rest of the page.
Which resources are commonly affected by slow TTFB?
Dynamic content that has to be generated for each visitor typically has a higher Time to First Byte. This usually applies to the initial document request or later API requests that load additional data.
Static resources like images and JavaScript files can generally be returned quickly by the server.
How does TTFB compare to other metrics?
TTFB is easy to confuse with a few related measurements. Here's how they differ.
TTFB vs server response time
Server response time only covers the time the server spends generating the response, from receiving the request to sending the first byte. TTFB adds everything before that: redirects, DNS lookup, and connection setup.
Lighthouse's "Reduce initial server response time" audit and the "Waiting for server response" timing in Chrome DevTools both measure the narrower server response time, which is why they often report lower numbers than CrUX. Our guide to lab versus field TTFB covers this in more detail.
TTFB vs First Contentful Paint and Largest Contentful Paint
TTFB measures when the first byte of HTML arrives. First Contentful Paint (FCP) measures when the first content renders, and Largest Contentful Paint measures when the main content is visible. The browser can't render anything before it receives the HTML, so TTFB sets a floor for both metrics.
A fast TTFB doesn't guarantee a fast FCP or LCP, because render-blocking CSS, fonts, and images still have to load afterwards, but a slow TTFB guarantees a slow one.
TTFB vs Time to Last Byte
Time to Last Byte is when the whole response has finished downloading. The difference between the two is the download time of the HTML document, which depends on the document size and the visitor's bandwidth. Large documents with inlined scripts or styles can have a good TTFB but still take a long time to arrive in full.
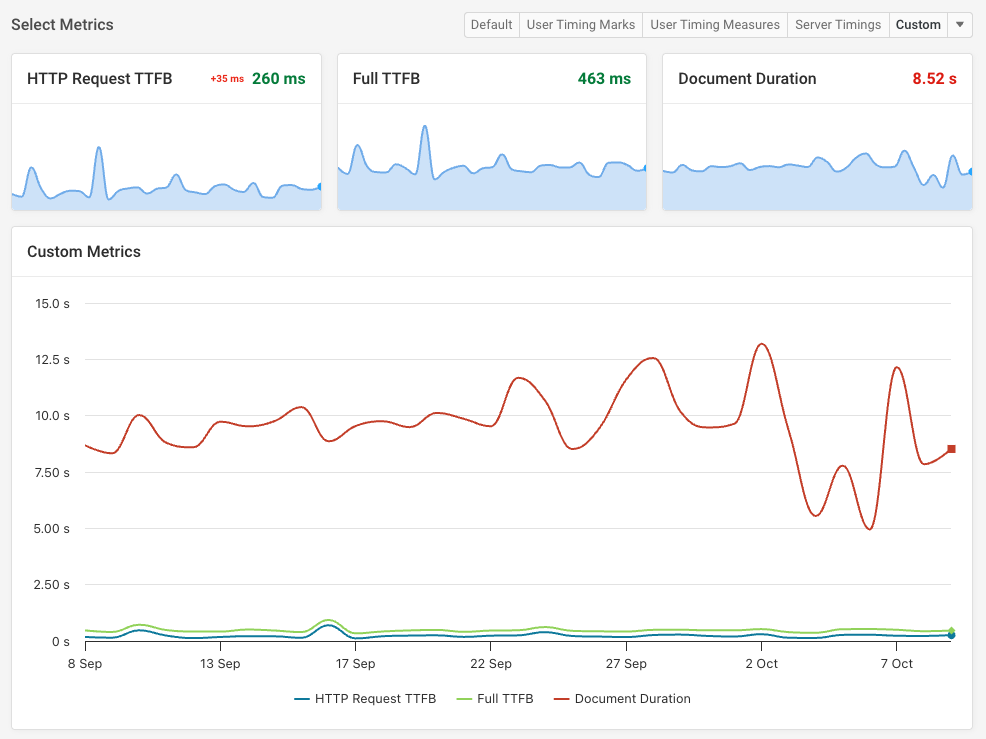
In DebugBear synthetic test data this is reported as the Document Duration metric, and you can chart it alongside HTTP Request TTFB and Full TTFB. In the example below the server responds quickly, with a Full TTFB of 463 milliseconds, but the document takes over 8 seconds to finish downloading. Looking at TTFB alone would hide that problem.
Test TTFB from different test locations across the globe
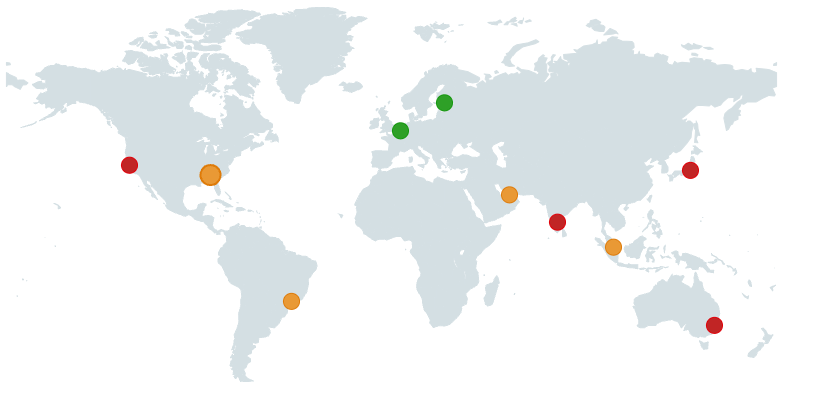
Using a free TTFB testing tool is a quick way to see how your website performs across the world. You simply provide a test URL and it's then accessed from multiple test locations to see how quickly the HTTP response comes in.
This way you'll know how performance varies globally and whether you need to optimize the experience for certain users.
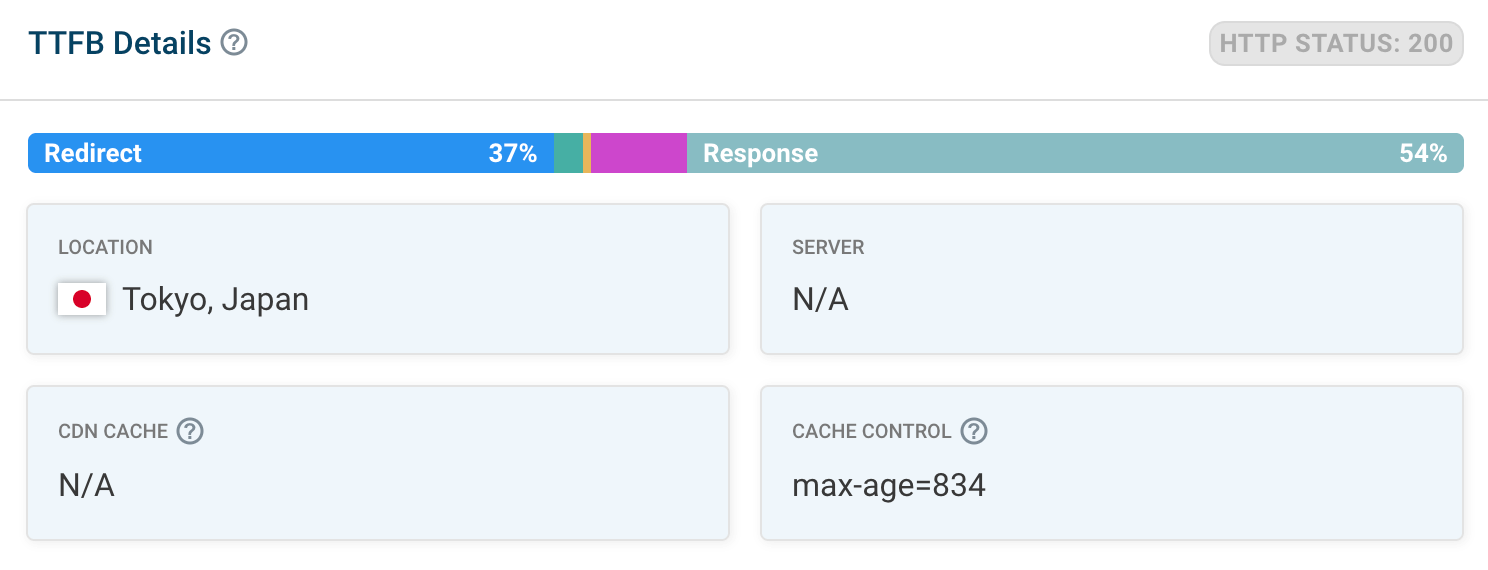
You'll also get a breakdown of the different TTFB components. That way you can see whether poor performance is caused by latency or by server processing.
Measuring TTFB in DevTools
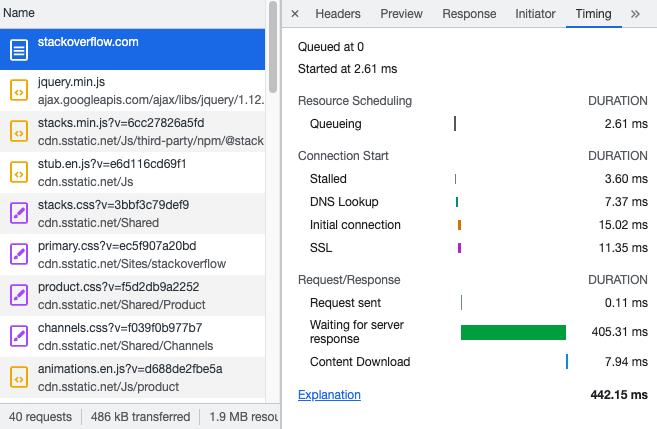
As mentioned above, PageSpeed Insights is a great tool to check if a slow TTFB is a problem for real users. Chrome DevTools can help you test TTFB locally to see if your optimizations are working.
To check TTFB in Chrome:
- Open DevTools and switch to the Network tab, then reload the page
- Click on the first request in the list, which is the HTML document
- Open the Timing tab in the request details
- Read the Waiting for server response value, which is the HTTP Request TTFB
Older versions of Chrome labeled this value Waiting (TTFB), and you'll still see that name in many guides. Either way it covers the time from sending the request to receiving the first byte, without connection setup or redirects.
If DevTools shows a long waiting for server response time, the delay is on the server or in the round trip to it, not in connection setup.
If you are looking for the Full TTFB, add up the DNS, connection, SSL, and waiting values shown in the Timing tab. This sum does not include redirects; if there are any, you'll need to manually check how long those requests took and add them to the total.
TTFB in Lighthouse: Reduce initial server response time
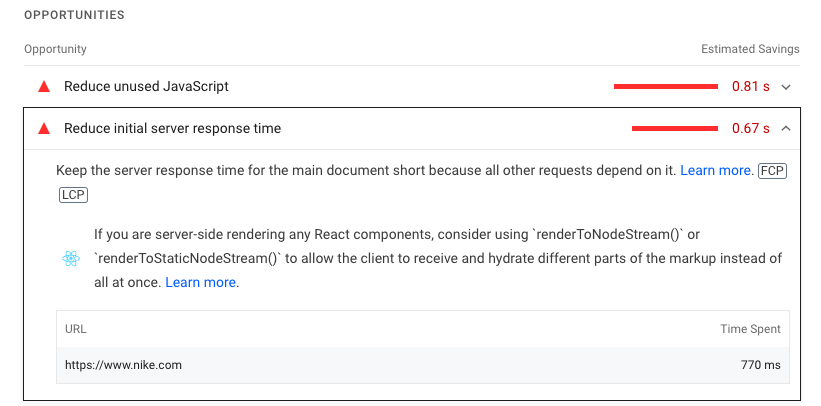
Lighthouse reports include the server response time in the Performance section.
The Reduce initial server response time audit measures how long the server took to respond after the browser sent the HTTP request.
Like in DevTools, this number does not represent the Full TTFB.
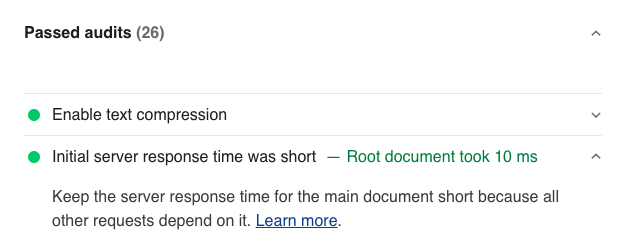
You might need to open the Passed Audits heading to see it.
Measuring real user TTFB with DebugBear
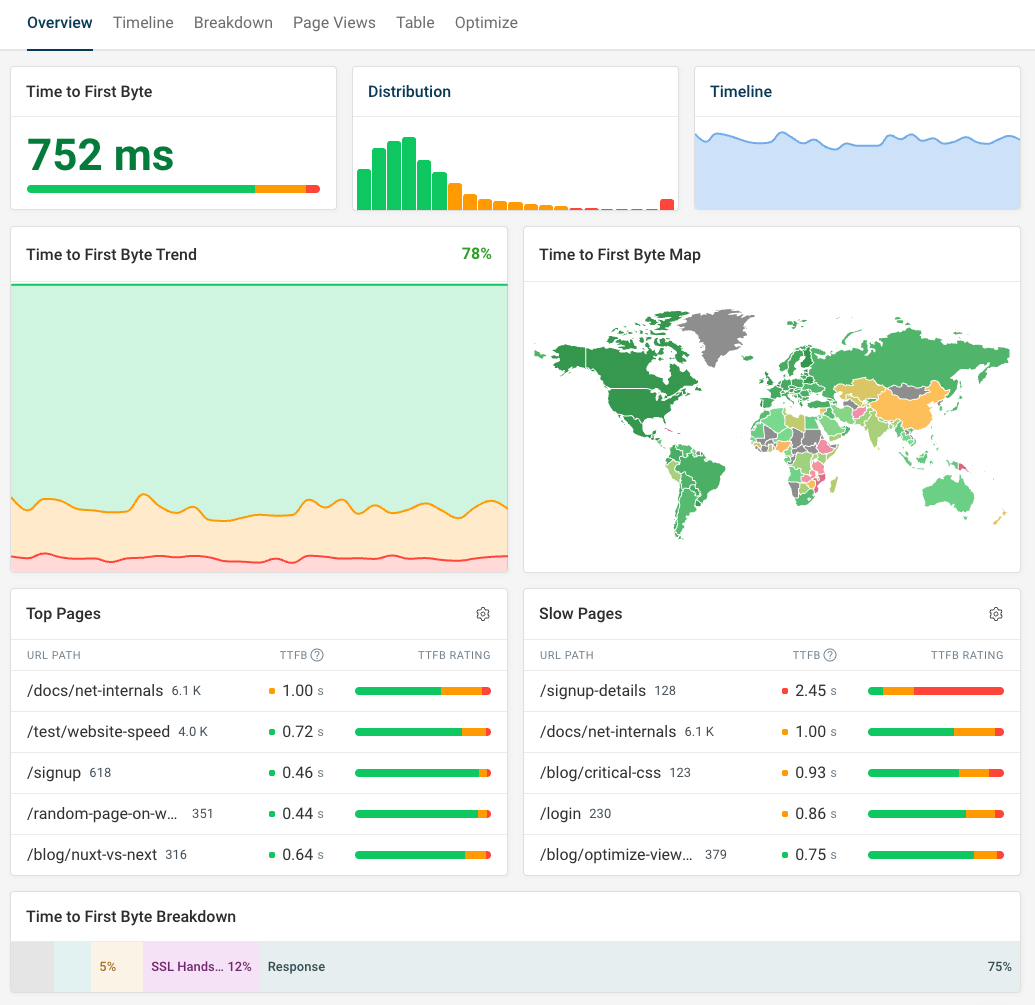
DebugBear real user monitoring (RUM) can measure Time to First Byte for visitors on your website. After setting up RUM you can open the TTFB metric dashboard.
The dashboard shows you:
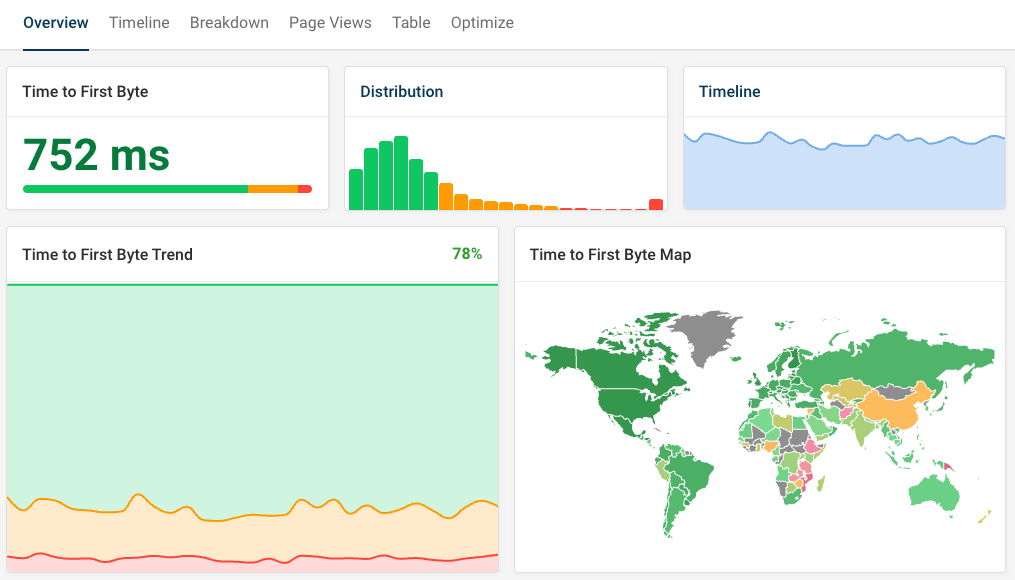
- Your overall TTFB score (the 75th percentile by default)
- A histogram showing the distribution of visitor experiences
- A trendline showing TTFB over time
- A global breakdown of your TTFB scores
- TTFB on your most popular pages
- Pages with poor TTFB scores
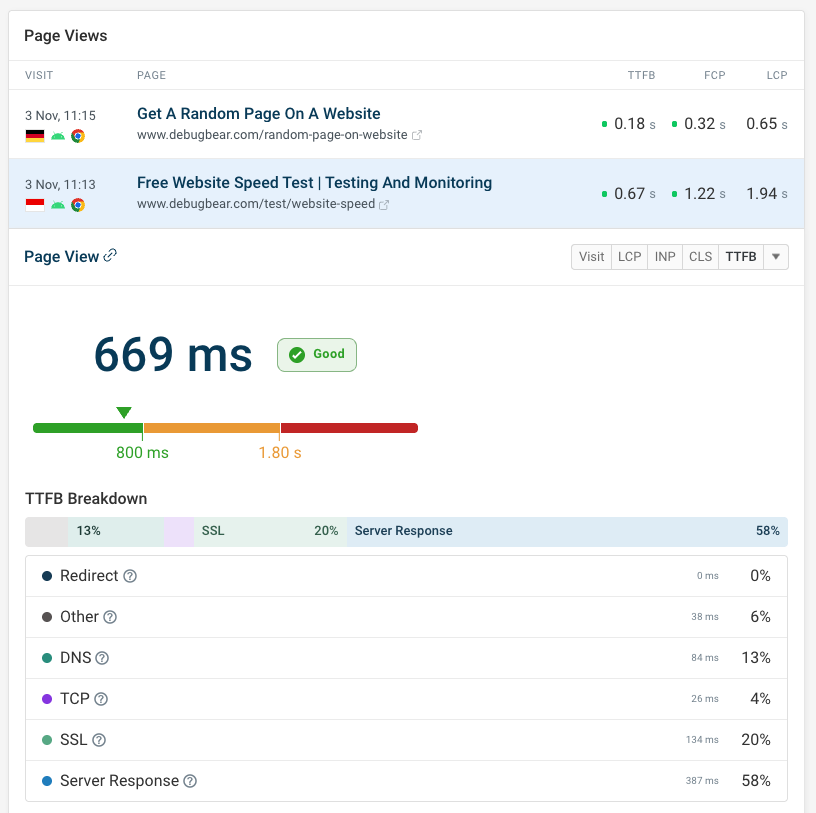
You can also look at specific website visits to see the TTFB component breakdown.
The breakdown tells you how much time different components like redirection or connection time contributed to the overall TTFB score.
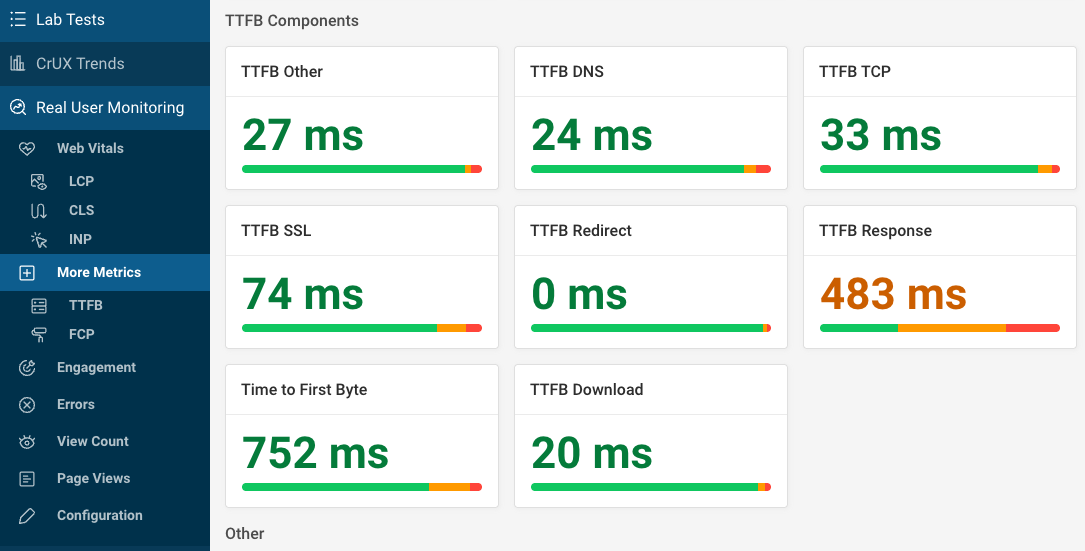
Alternatively, use the More tab to view TTFB breakdown metrics across all visits on your website. Click on each component to view a dedicated monitoring dashboard for that metric.
Here you can also see how long it took for the browser to download the HTML document.
How can redirect time be measured in real user data?
For privacy reasons, browser APIs often restrict what performance information is reported. This applies especially when making cross-origin requests.
When a RUM tool reports a redirect time, this means a same-origin redirect occurred. For example, a website might redirect from example.com/hello to example.com/home.
If a cross-origin redirect occurs, then browsers don't report this as redirect time. For example, if bit.ly/abc123 redirects to example.com/home, then this redirect will be reported as Wait time instead.
What does wait time refer to in real user data?
Wait time can occur for a few different reasons, for example:
- Cross-origin redirects
- Cache lookups
- Service worker request processing
How to improve Time to First Byte
A slow server response time can have a wide range of causes, for example:
- CPU-intensive work on the web or database server
- Slow network round trips and server connections
- Third-party API calls
- Cold launches of "serverless" instances
Why is my TTFB so high?
Before changing anything, find out which TTFB component is slow. The TTFB test and the DebugBear request waterfall break TTFB down into redirect, DNS, connection, and server processing time, and each of those points to a different fix:
- Redirect time means the URL visitors open isn't the final URL. Link directly to the final URL and avoid redirect chains.
- DNS and connection time are dominated by network latency. A Content Delivery Network (CDN) with servers close to your visitors, TLS 1.3, and connection reuse help here.
- Server processing time is the server itself. This is where profiling, database optimization, and caching come in, which is what the rest of this section covers.
If TTFB is fine in a lab test but slow for real users, the usual culprits are logged-in visitors bypassing the cache, cache misses in regions far from your servers, and traffic arriving via redirects. Our guide to why field TTFB is worse than lab TTFB walks through each of these.
The rest of this section covers each server-side cause in turn.
Reduce CPU-intensive server processing
The more work your server has to do to generate the HTML document, the longer it will take your visitors to get a response. If your page contains a lot of content that is complex to generate, then your website will have a higher TTFB score.
For WordPress-specific causes like slow plugins and uncached pages, see the WordPress section below.
Profile server code
A profiler measures where in the code your app is spending most of its time. We'll walk through a real example of profiling a Node.js server here, but most popular languages have a similar profiler you can use.
When launching your Node server, enable the debugger by passing in the --inspect flag.
node --inspect server.js
// Will print something like this:
// Debugger listening on ws://127.0.0.1:9229/62953438-d65e-4cf6-866a-63a26f8aa57f
Now, go to the browser and open Chrome DevTools on any page.
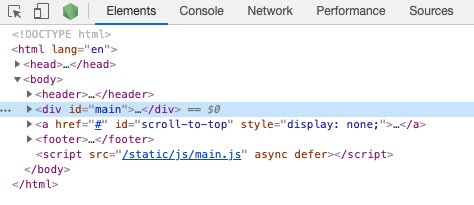
You'll find a green icon in the top left corner, saying Open dedicated DevTools for Node.js. Click on it to open the inspector window for the Node process.
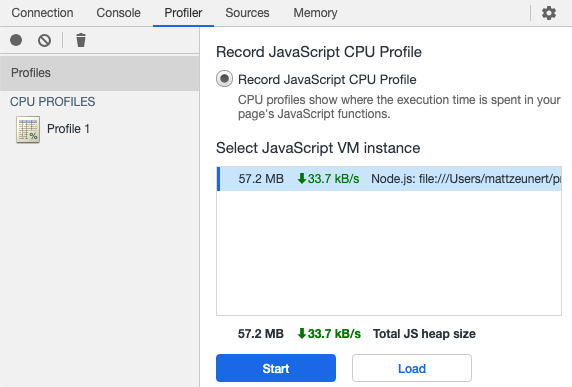
In the inspector window, switch to the Profiler tab. Click Start and make a request to your local server, so that there's some activity in the profiler recording.
Stop the recording and switch the dropdown from Heavy (Bottom-up) to Chart. You'll see a flame chart showing what the server was up to at any given moment.
Each bar shows a function call in your code. When one function calls another function, that function is placed below the calling function in the flame chart.
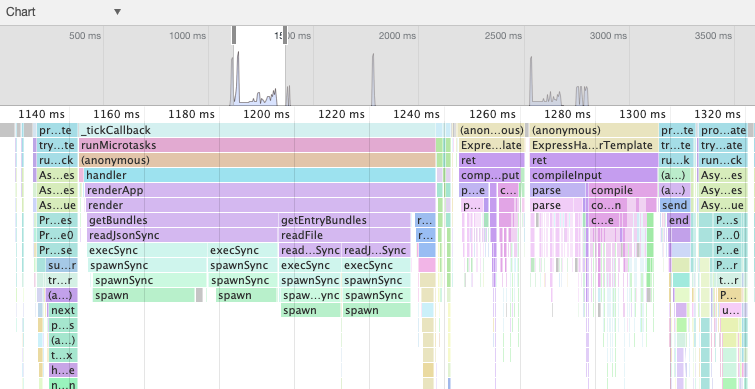
In this case the server spent a lot of time getting the list of JavaScript bundles and rendering a Handlebars template. Neither step depends on the request, so both results can be cached in memory after the first request. That removes most of the server processing time without touching the rest of the code, which is the kind of fix profiling usually surfaces.
Add print statements when profiling isn't an option
Sometimes it's difficult to profile your code, for example when you're running production code in a Platform as a Service (PaaS) environment. You can try just logging how much time was spent to narrow down what's causing a performance issue.
console.time("Request");
// ...
console.timeLog("Request", "After authentication");
// Request: 156.22ms After authentication
// ...
console.timeLog("Request", "Template rendered");
// Request: 319.23ms Template rendered
// ...
console.timeEnd("Request");
// Request: 588.71ms
Optimize slow database queries
If server responses are slow but the profile doesn't show a lot of processing, your code might be waiting for responses from the database.
To check if this is the case, try logging every SQL query and measure how long it takes. For example, if you're using Sequelize, you can use this code to log the duration of each query.
const db = new Sequelize("database", "username", "password", {
  benchmark: true,
  logging: function (sql, timeInMs) {
    console.log(sql, timeInMs + "ms");
  },
});
If the server is making a lot of small queries, consider if they can be merged into one. For example, you might use joins to fetch related data or use WHERE id in (12, 23) to fetch multiple records.
Some queries might be duplicated or altogether unnecessary.
If specific queries take a long time to run, try prepending the SQL command with EXPLAIN ANALYZE to see how the database server is spending its time.
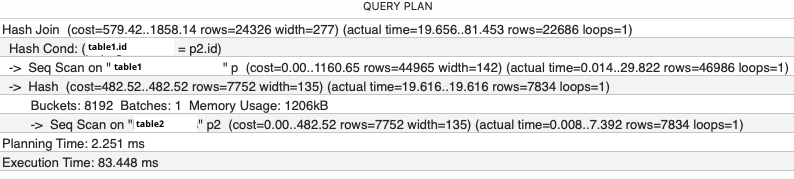
Adding an index to a column that's used for sorting or filtering often speeds up slow queries. This will slow down inserts into the table, but speed up lookups later on.
Speed up server connection time
Establishing an HTTP connection requires multiple network round trips. If your web servers are located far from where your users are, each round trip will take longer. A CDN with many global locations can help with this.
Upgrading to TLS 1.3 can avoid unnecessary round trips. Avoiding Extended Validation certificates prevents expensive certificate revocation requests (OCSP) as part of the connection process.
Avoid accessing third-party APIs
Using external APIs can slow down server response time significantly. Making these API calls means nesting HTTP requests, so your TTFB now also includes the TTFB of the third-party request.
Consider caching responses from these third parties for later use or requesting third-party data through a separate fetch request instead of including it in the initial document HTML.
Choosing API providers with locations close to your own server can reduce the impact of third-party API calls and lower TTFB.
Optimize instance warm-up
If you're using cloud scaling solutions some of your requests may end up being handled by VM instances that are still being provisioned. These cold starts can mean response times of 10 seconds or more.
To avoid this, check your scaling configuration or ensure significant warm server capacity always exists.
Speed up TTFB by lazy loading secondary content
Is all content on the page necessary for the user to benefit from seeing the page? Or can you show the most important content first and then lazy-load additional information?
For example, let's say that rendering a sidebar is slow. You could initially render the page without the sidebar and then load the sidebar via Ajax later on.
Use more and faster servers
This option will cost more, but upgrading to a faster machine can be an easy way to work around performance problems. If multiple requests are competing for resources you can also increase the number of servers used to serve your website.
Reduce TTFB with caching
Caching means saving a value so that you can use it again later, without having to redo the processing that was necessary to get the value originally.
For example, you can cache a response you received from a database, or the HTML for a fully-rendered page template. The cached data can be stored in memory or in a separate cache server.
A simple in-memory cache can look something like this:
const cache = {};
async function getData(dataId) {
  if (!cache[dataId]) {
    cache[dataId] = getDataWithoutCache(dataId);
  }
  return cache[dataId];
}
async function getDataWithoutCache() {
  /* slow logic */
}
Note that we are caching the promise rather than the result of the getDataWithoutCache call. That way, we don't end up calling getDataWithoutCache again if another getData call is made before the result is available.
While an in-memory cache allows very fast access, it will also increase the memory consumption of your server. To mitigate this, you can use a cache that discards infrequently used items.
Caching HTML on CDN edge nodes
If you can serve the same HTML code to different visitors, then you can achieve minimal TTFB scores by using a CDN cache.
When your server responds with the HTML, the CDN caches the response in addition to sending it to the user. The next time a visitor requests the same resource from the same CDN edge node (i.e., they are in the same geographic region), the CDN can respond without having to contact your website server. This way, the CDN can often respond in under 200 milliseconds.
Reduce TTFB on WordPress websites
WordPress generates every page with PHP and database queries unless something caches the result, so uncached pages are the most common cause of slow TTFB on WordPress sites.
A page cache plugin like WP Rocket stores the finished HTML so it doesn't need to be regenerated for every visitor.
If TTFB is still slow with page caching enabled, check these in order:
- Logged-in users and carts. Page caches usually skip logged-in visitors and WooCommerce sessions with items in the cart, so those visitors hit PHP every time. An object cache like Redis speeds up the database queries behind those uncached requests.
- Slow plugins. Every active plugin runs on every uncached request. A profiling plugin such as Query Monitor shows which plugins and database queries take the longest.
- Plugins calling external APIs. Plugins that fetch data from third-party services during page generation add that service's response time to your TTFB. Move those calls to a background job or load the data client-side.
- Shared hosting. On cheap shared hosting, CPU time is limited and TTFB fluctuates with other sites on the same server. Moving to a host with dedicated resources often cuts TTFB by more than any code change.
Make your WordPress site lightning fast with our step-by-step guide to WordPress speed optimization.
Google CrUX data for TTFB debugging
Data from Google's Chrome User Experience Report can help you see how your TTFB scores have been trending and identify potential improvements.
If your page has enough traffic Google provides a 40-week metric history. Run a free website speed test on your website to see this data.
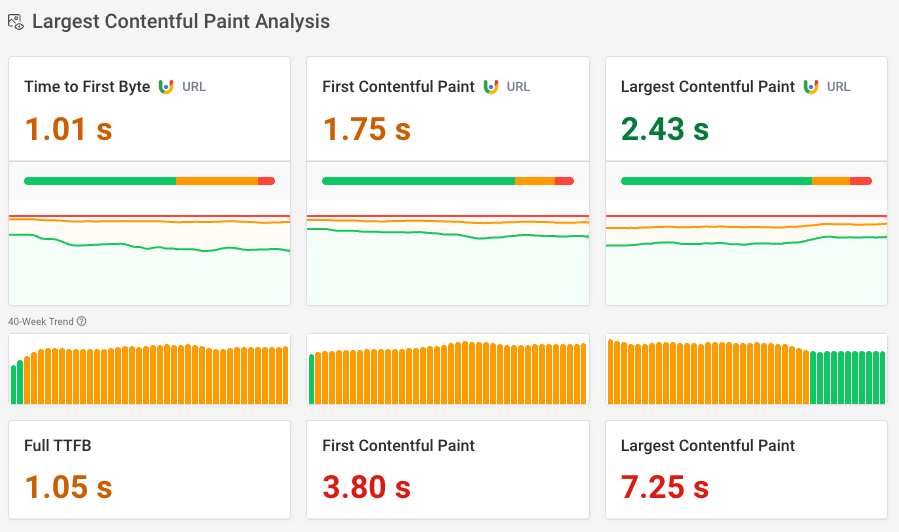
Google also provides additional insights into how visitor behavior and characteristics are impacting the TTFB metric.
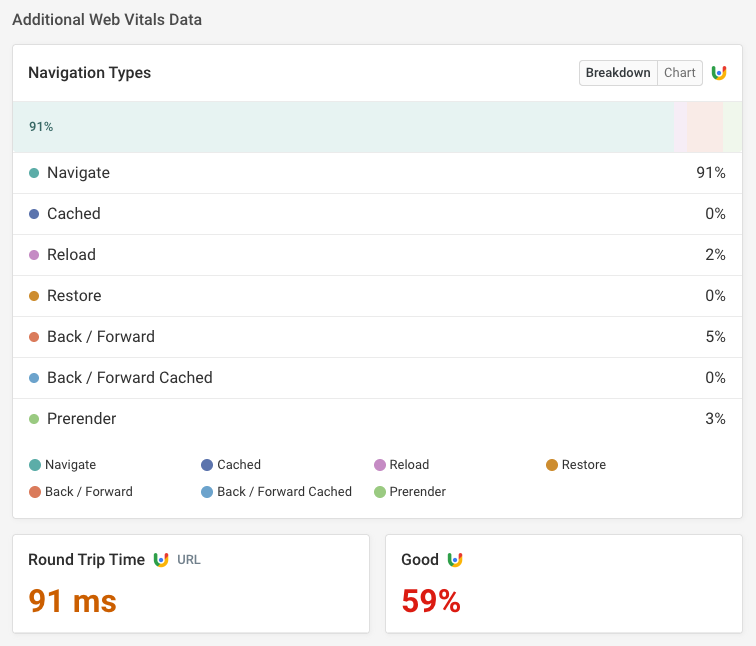
For example, in the screenshot below we can see that:
- Visitor connections have a 91-millisecond round-trip time, impacting how quickly the server and the browser can communicate
- 5% of navigations are back/forward navigations, but none of these are currently served from the back/forward cache
Monitoring Time to First Byte
You can use DebugBear to keep track of TTFB and other Web Vitals metrics. Identify slow pages on your website, find out how to speed them up, and check if your optimizations are having the impact you hoped for.
Alerts over email, Slack, or Microsoft Teams flag regressions as soon as they happen.
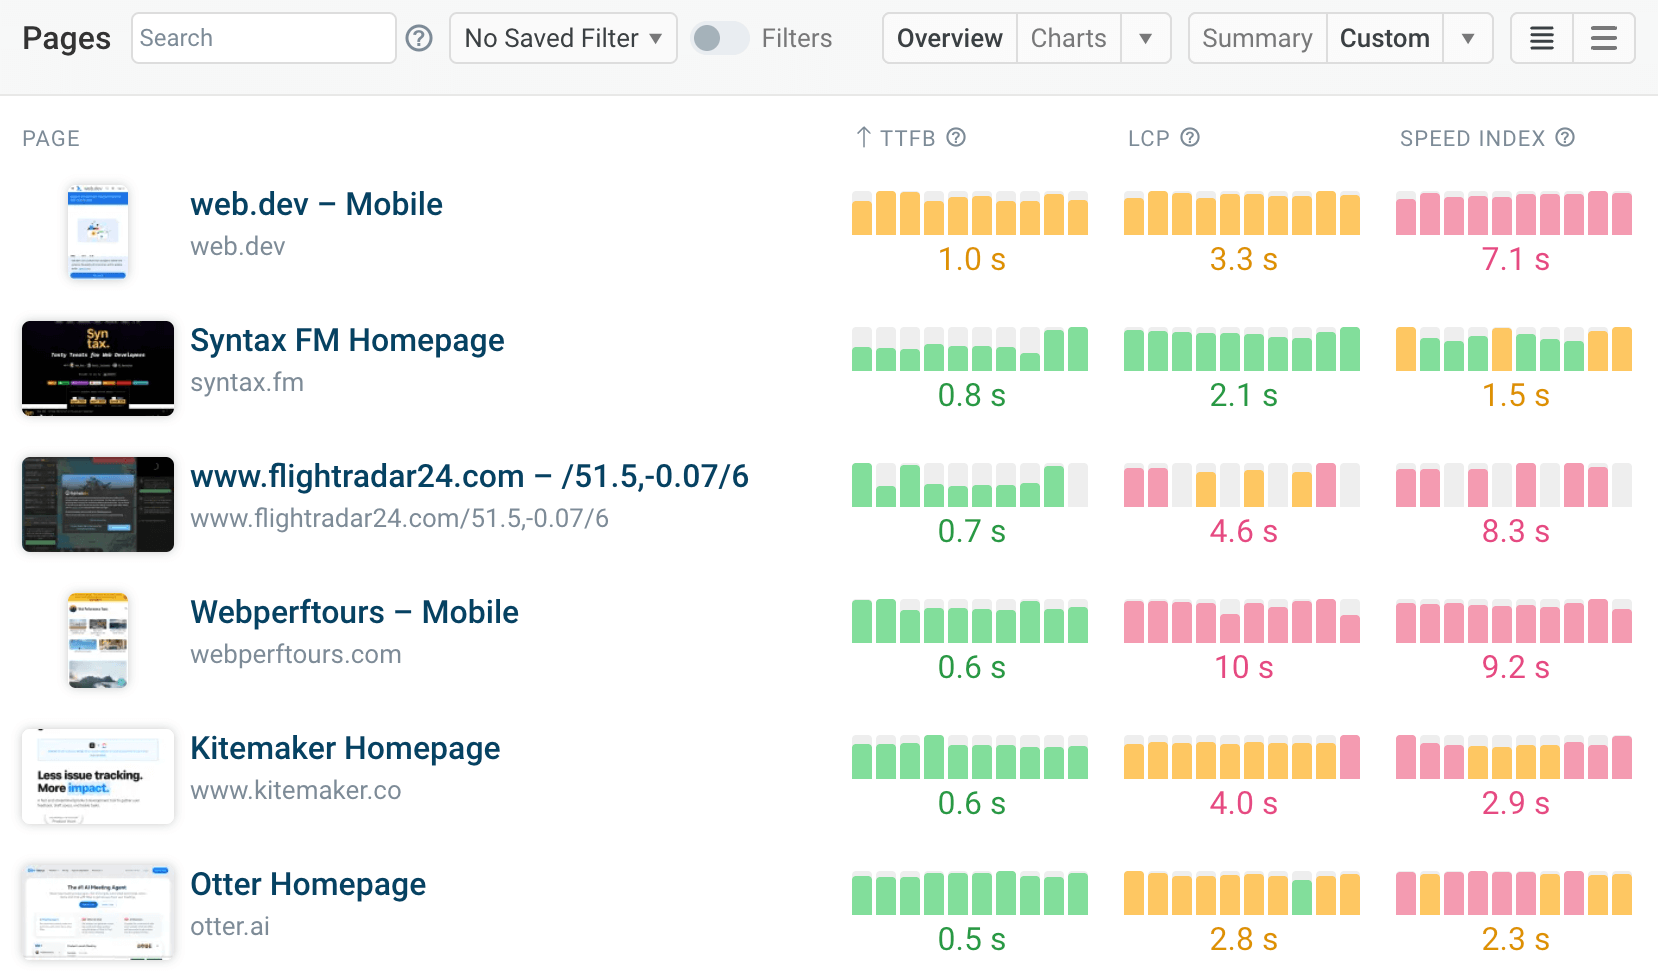
Scheduled synthetic website performance tests and in-depth real user monitoring together show how different visitors experience your website.
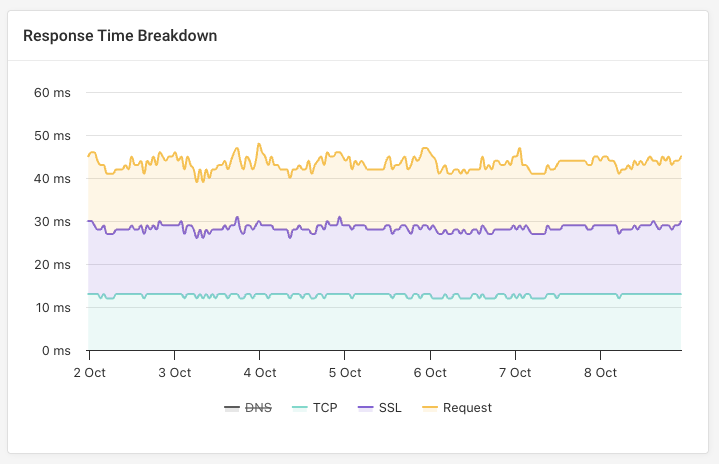
For a closer look at server response time specifically, uptime monitoring checks your pages as often as every minute and records the TTFB of every check. The response time breakdown chart splits it into DNS, TCP, SSL, and request time, so you can see whether a spike comes from the network or from the server, and catch short-lived slowdowns that an hourly page test would miss.
In addition to TTFB you can also track user-focused metrics like the Largest Contentful Paint. DebugBear also keeps track of the two other Core Web Vitals metrics that impact Google rankings, Interaction to Next Paint and Cumulative Layout Shift.
Sign up for a free trial to start optimizing your website performance.
Monitor Page Speed & Core Web Vitals
DebugBear monitoring includes:
- In-depth Page Speed Reports
- Automated Recommendations
- Real User Analytics Data