
Interaction to Next Paint (INP) is a performance metric that became one of the three Google Core Web Vitals in March 2024.
INP tends to be harder to improve than other page speed metrics, as it requires a page interaction to be measured and optimizing it often involves debugging complex JavaScript logic.
This article will explain how you can use Chrome DevTools to analyze page interactions and make your site respond to them more quickly.
How to measure INP for a page interaction in Chrome DevTools
You can use the DevTools Performance tab to measure the Interaction to Next Paint metric.
- Open DevTools by right-clicking the page and selecting Inspect
- Open the Performance tab
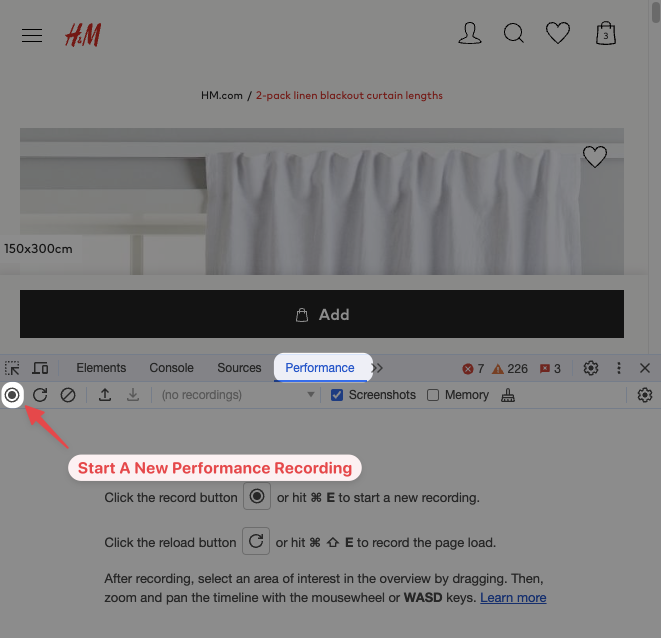
- Start a new recording by clicking the record button in the top left
- Interact with the page, for example by clicking a button or typing in a text field
- When you're done, click the Stop button in DevTools and wait for the recording to process
Once the recording is complete, DevTools will display a lot of data, showing the start of your recording on the left and the end on the right. Don't worry, you can ignore most of it for now and focus on the INP value.
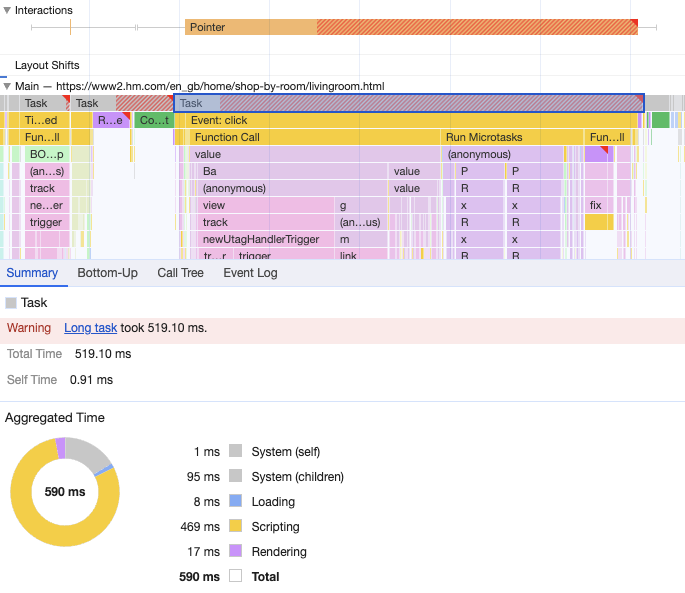
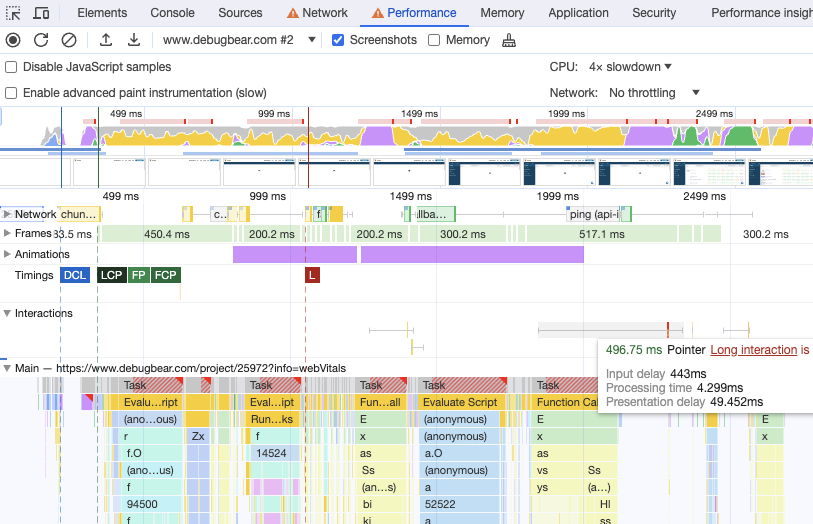
Find and expand the Interactions lane and then hover over the interaction you're interested in. We then see the duration of the interaction as well as the interaction type, in this case a mouse pointer interaction. (You may find that even if you clicked on an element DevTools will focus on the pointer interaction instead.)
The red striped area shows when the interaction duration exceeds 200 milliseconds. If the 200-millisecond threshold is exceeded, DevTools will also show a note saying "Long interaction is indicating poor page responsiveness".
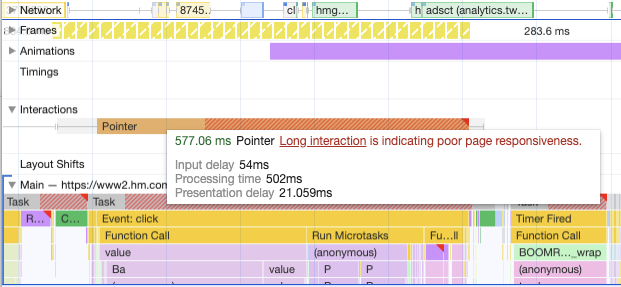
You can also see the breakdown of the INP metric into three components:
- High input delay indicates that background activity on the page is preventing the page interaction from being processed
- High processing time means the event handlers for the interaction take a long time to run
- High presentation delay indicates that styling, layout, and painting the updated UI is delaying the next paint
The gray whiskers on the left and right show the input and presentation delay.
Consider enabling CPU throttling
If you're on a fast desktop computer you may struggle to replicate the slow laggy experiences your real users are having.
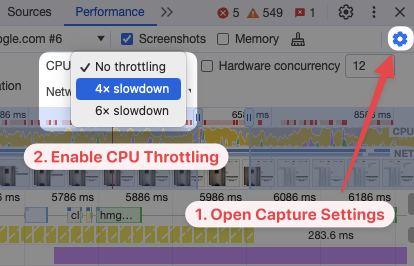
To emulate a less powerful device visiting your website you can enable CPU throttling in Chrome DevTools:
- Open the Performance Capture Settings by clicking on the top right gear icon in DevTools
- Select "4x" or "6x" CPU throttling in the dropdown
This will make CPU processing take 4 or 6 times longer than it otherwise would on your device.
Analyze INP with DevTools
Let's look at the performance recording from above and see what it tells us.
On production sites you'll often see meaningless function names like aHg. To make it easier to interpret your data, consider using source maps or testing on your local server with code that's not minified.
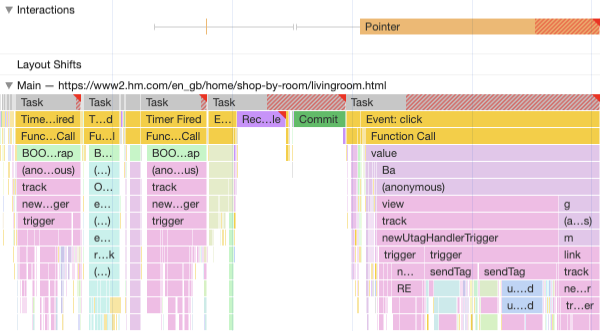
The browser main thread is responsible for rendering content on the page and handling interactions. You can see what the main thread is up to in the "Main" lane in the performance recording.
Here we can notice that the main thread is busy even before the user interaction, and this leads to input delay. The multiple "Timer Fired" events show that the browser is running tasks that have been scheduled by the page. If a user interaction happens while this background task is in progress, then the browser first has to finish the scheduled task before handling the input event.
Reducing the amount of scheduled tasks running in the background can reduce the input delay. You can also try to speed up those tasks so the delay is less significant.
In this case the processing time accounts for the vast majority of the INP value. JavaScript minification makes it hard to read what's going on, but let's still try and analyze the CPU activity here.
If we click on the "Task" at the top of the main thread lane, we can see a Summary view at the bottom of the screen. In this case, we can see that the task duration is mostly due to JavaScript processing, rather than other types of processing like style recalculations.
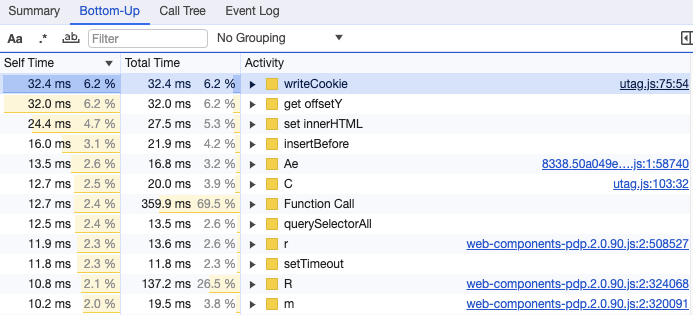
Let's switch to the Bottom-up view, which shows us how much time is spent on individual JavaScript functions or tasks like compiling JavaScript code. Ideally, we're hoping to find one function that stands out as taking much more time than the others. In that case, we can focus on optimizing that function, calling it less, or making it run faster.
Unfortunately that's not quite the case here, though we can see that the function that the browser is spending the most time on is the writeCookie function.
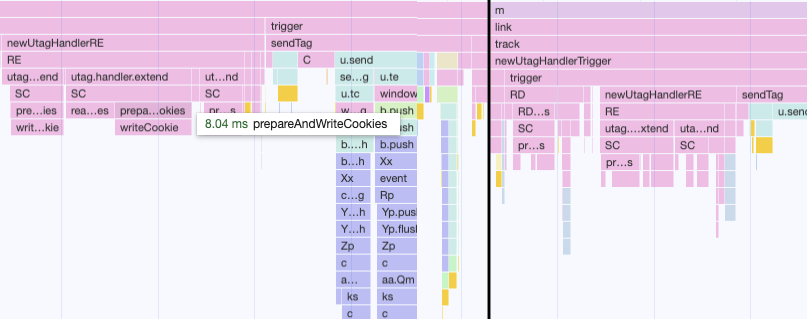
We can search the main thread lane for the writeCookie function (using ctrl+f or cmd+f). This shows us that it's not a single long call, but rather the page is calling this function 24 times in different places. The prepareAndWriteCookies function could likely be consolidated and only called once.
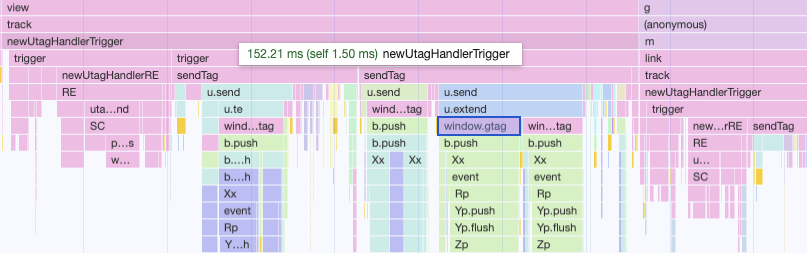
Taking our analysis up a level, we also see that a lot of time is spent as part of the newUtagTriggerHandler function. This suggests that a lot of this code is not core application code necessary to update the UI but rather tracking code, e.g., calling the Google Tag with window.gtag.
Since these tasks are not necessary to display the new page content, they could be deferred until later when the UI has finished updating.
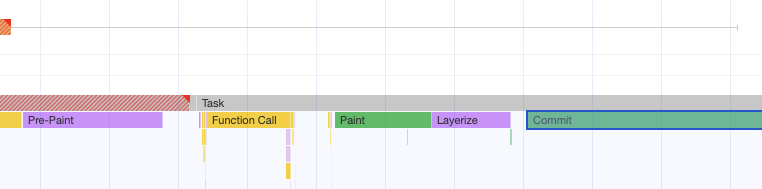
If we look at what's going on in the main thread during the presentation delay time, we can see various rendering-related tasks like Pre-Paint, Paint, Layerize, and Commit. However, they don't take an unreasonable amount of time and the browser rendering tasks are often difficult to optimize.
Run A Free Page Speed Test
Test Your Website:
- Automated Recommendations
- Detailed Request Waterfall
- Web Vitals Assessment
Improving input delay during the initial page load process
Sometimes most interactions on a website are fast, but the initial loading process contains many long CPU-blocking tasks. If the user clicks anywhere on the page, for example to highlight text, you'll get a high Interaction to Next Paint score with a big input delay component.
To test this, click the Start profiling and reload page icon in Chrome DevTools and keep clicking on the page a couple of times per second. You'll then be able to see whether these interactions were slow.
At the top of the recording, we can see that the CPU is fairly busy throughout the loading process, rendering bits of the UI as new data is loaded in.
To reduce these delays you can break processing up into smaller chunks, for example using requestIdleCallback. This way each blocking task is shorter, allowing the browser to schedule processing the user interaction between these tasks.
If users are trying to interact with the UI before it's ready, you can also change the design to clearly indicate that UI components are disabled until after the page is complete.
Get real user data to guide your optimizations
To get the most impact from your optimizations, you need to know what elements most frequently cause interaction delay for users. To find that out, you need to collect data directly on your website as people are using it.
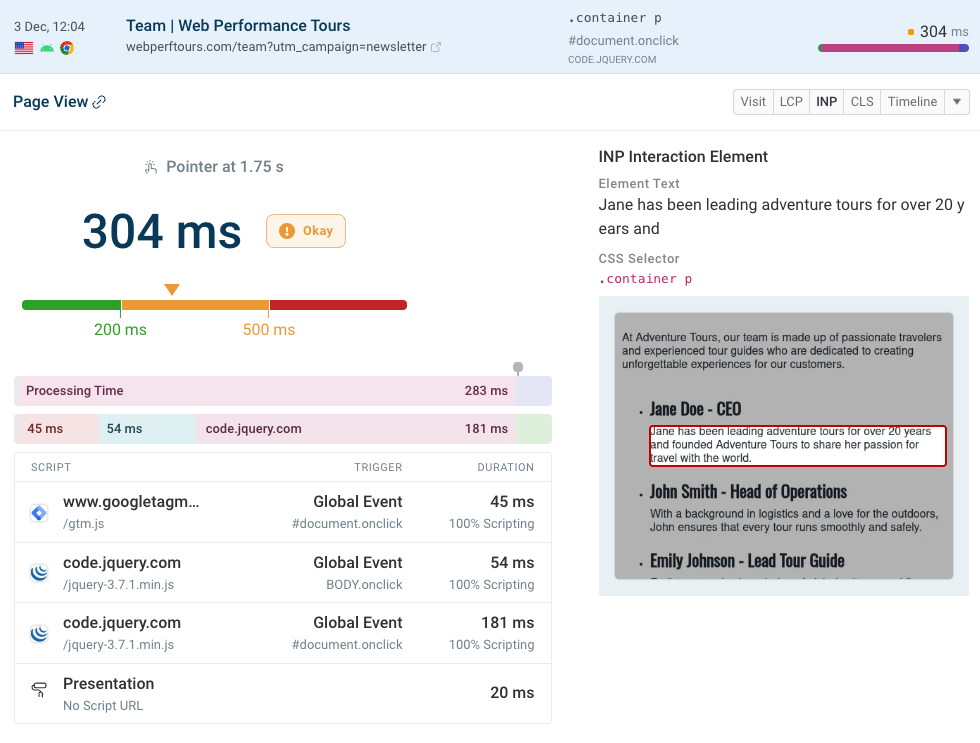
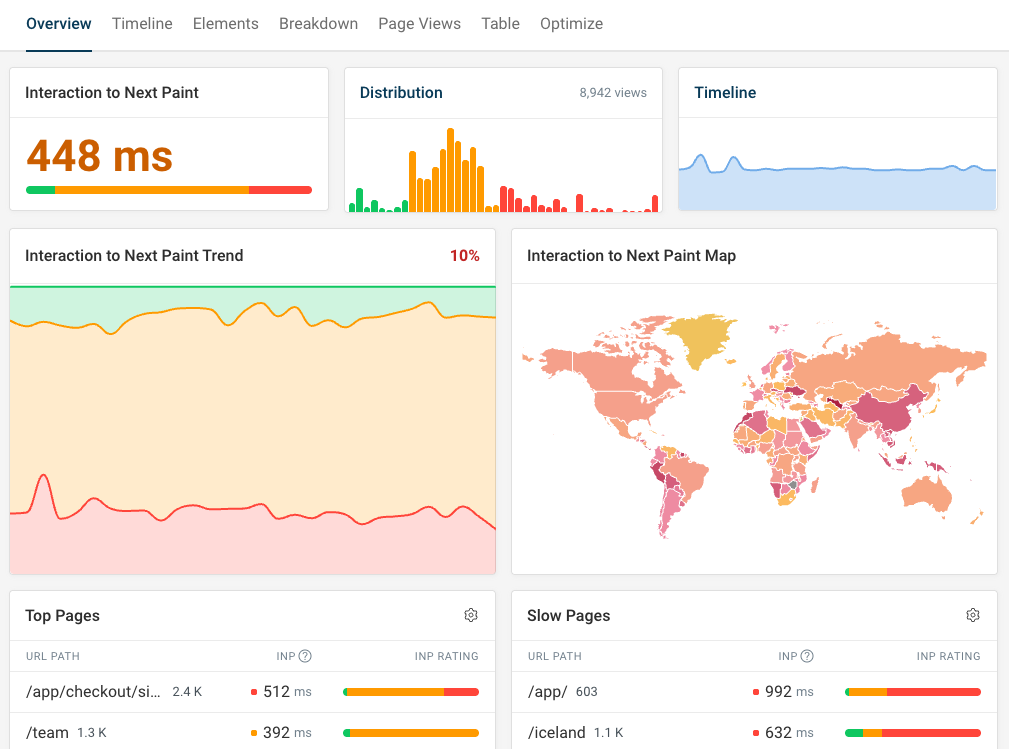
DebugBear real user monitoring helps you get insight into your Core Web Vitals, including INP elements and breakdown into input delay, processing time, and presentation delay.
Debug specific slow interactions, or view aggregate data across your website. For example, DebugBear surfaces what scripts are responsible for delays, based on the Long Animation Frames API.
Continuous Core Web Vitals collection makes it easy to spot trends and lets you get alerted to any performance regressions.
Use conversion tracking to see how performance impacts business results.


Monitor Page Speed & Core Web Vitals
DebugBear monitoring includes:
- In-depth Page Speed Reports
- Automated Recommendations
- Real User Analytics Data