
Page navigations in the browser can be categorized into different types, for example an initial navigation or a reload of an already open page.
This article looks at how different navigation types result in page load time differences and how you can detect the type of navigation in the browser.
You can explore the different navigation types in this demo.
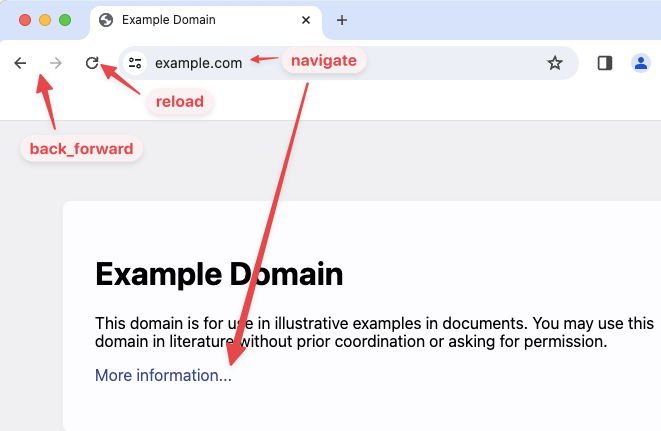
What different types of navigations can happen in the browser?
There are four different types of page navigations:
navigate: a standard navigation triggered by typing in a URL or clicking on a linkreload: the visitor clicked the "Reload this page" button in the browserback_forward: the visitor used the back and forward navigation buttons
There is also a prerender value for the deprecated prerender link tag.
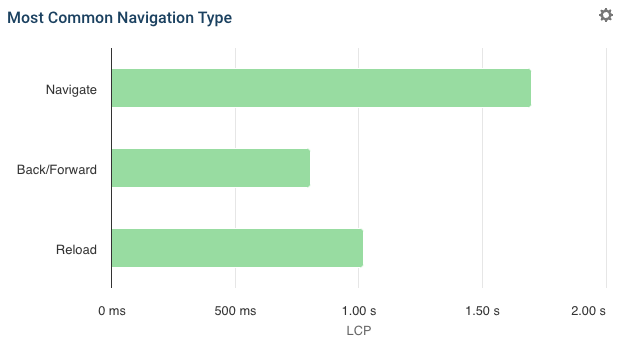
Many Real User Monitoring (RUM) tools like DebugBear will show you how page load times differs between different navigation types.
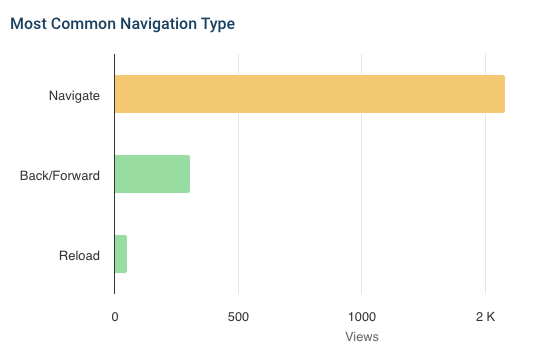
You can also see how frequent different types of navigations are for your website.
Additional types of navigation
We previously specified four types of navigation: navigate, reload, back_forward, and prerender. However, there are additional types of navigation types that DebugBear can present:
Cached: The page was loaded from the HTTP cache.Restore: The page was reopened after the browser was closed or the tab crashed.Back / forward cached: The page was loaded from bfcache. These experiences are faster than normal because the page has already been processed.
Page reloads
When a page is reloaded by the user that means the browser can re-use some resources that have already been downloaded. This is because of browser caching.
Not all resources will be cached – the user likely reloaded the page because they wanted some parts of the page to be updated, for example the contents of the document itself. However, overall you should still see that page reloads are faster than standard navigations.
Back/forward navigations
The back and forward browser navigation buttons are used very frequently:
Chrome usage data shows that 1 in 10 navigations on desktop and 1 in 5 on mobile are either back or forward.
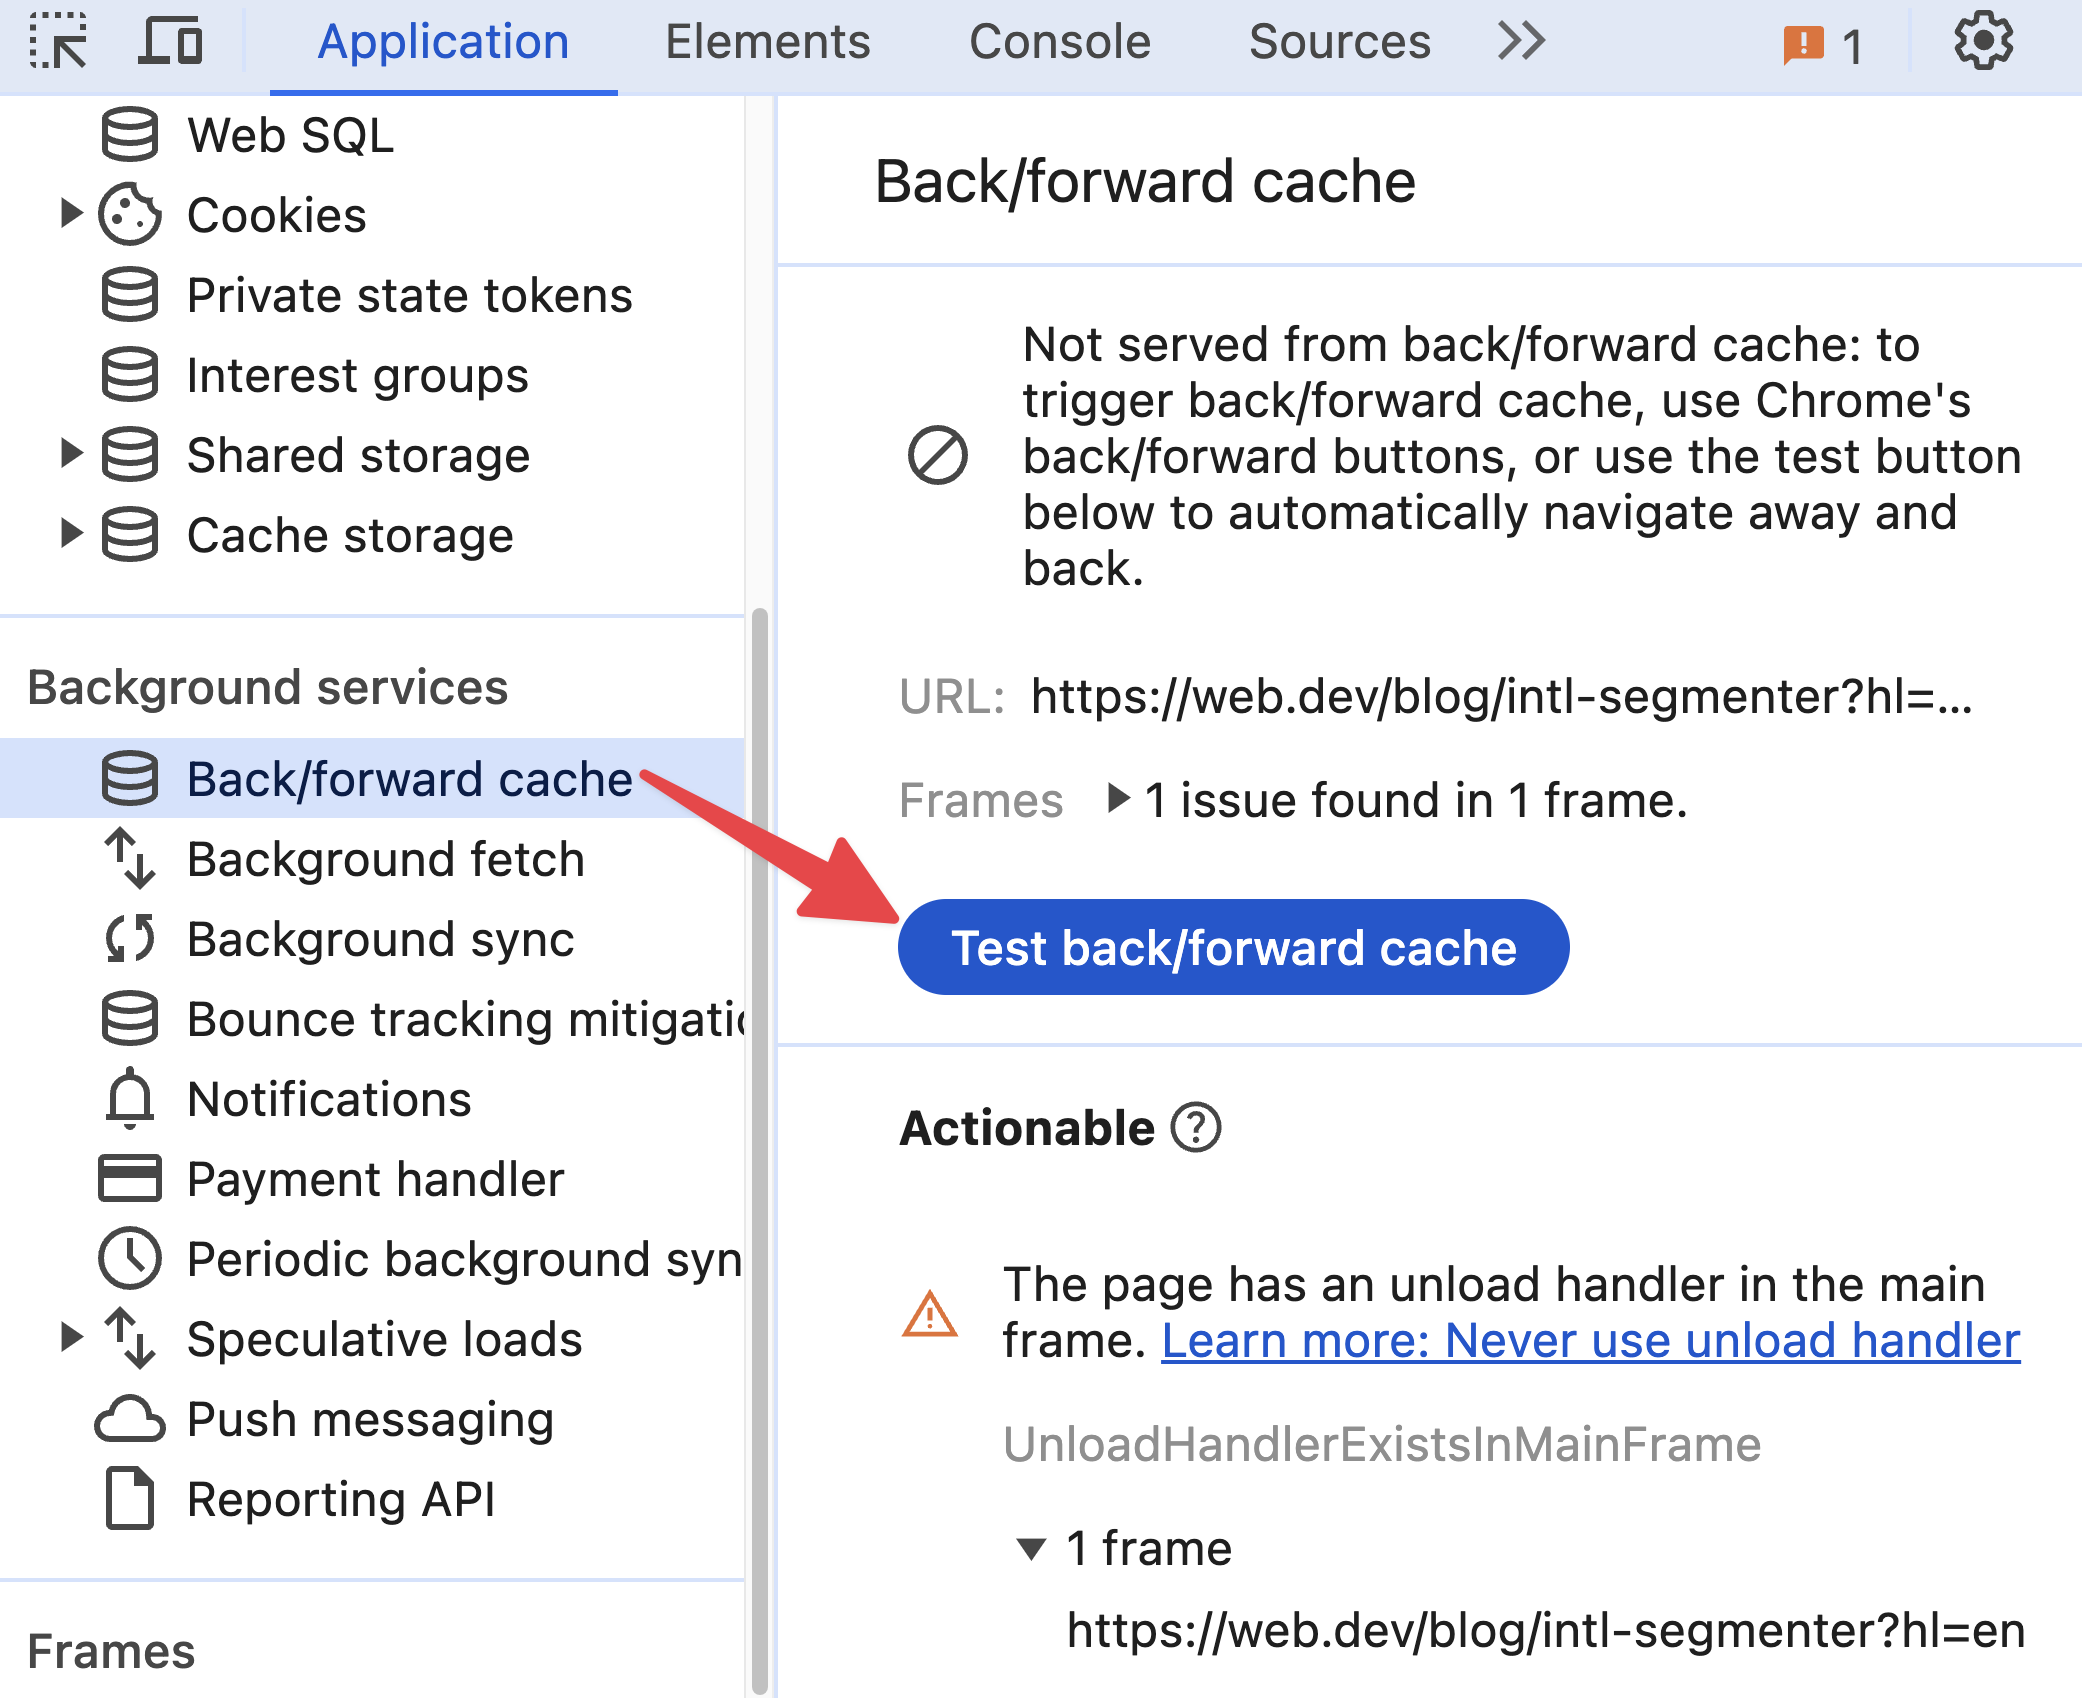
Since these pages have already been loaded previously, this provides an opportunity for performance optimizations. Browsers implement a back/forward cache (or bfcache) to restore previous pages instead of reloading them.
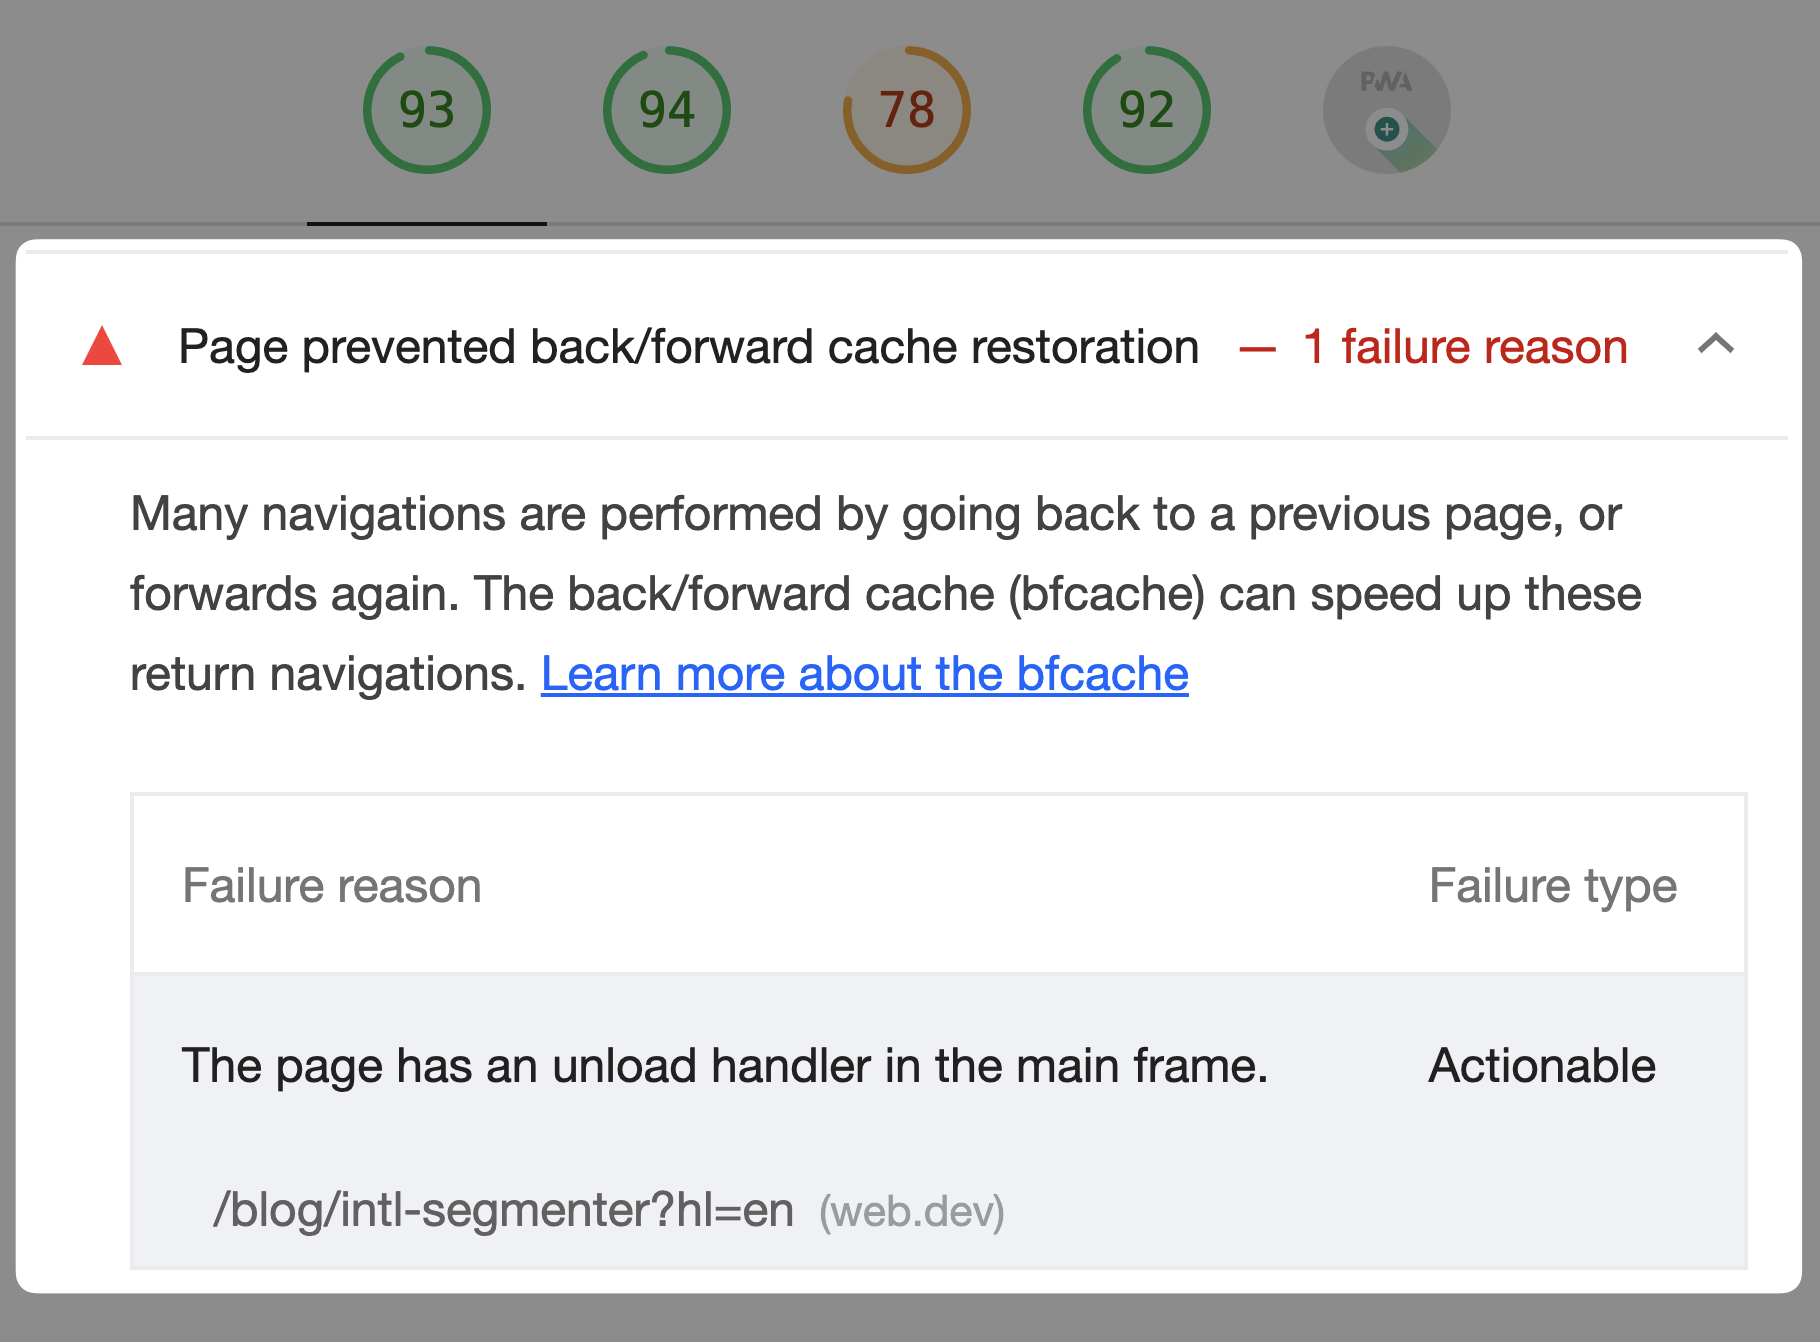
To benefit from better performance you need to make sure that your pages are eligible for the bfcache, for example by checking Chrome DevTools or the "Page prevented back/forward cache restoration" Lighthouse audit.
- Using DevTools:
- Using Lighthouse:
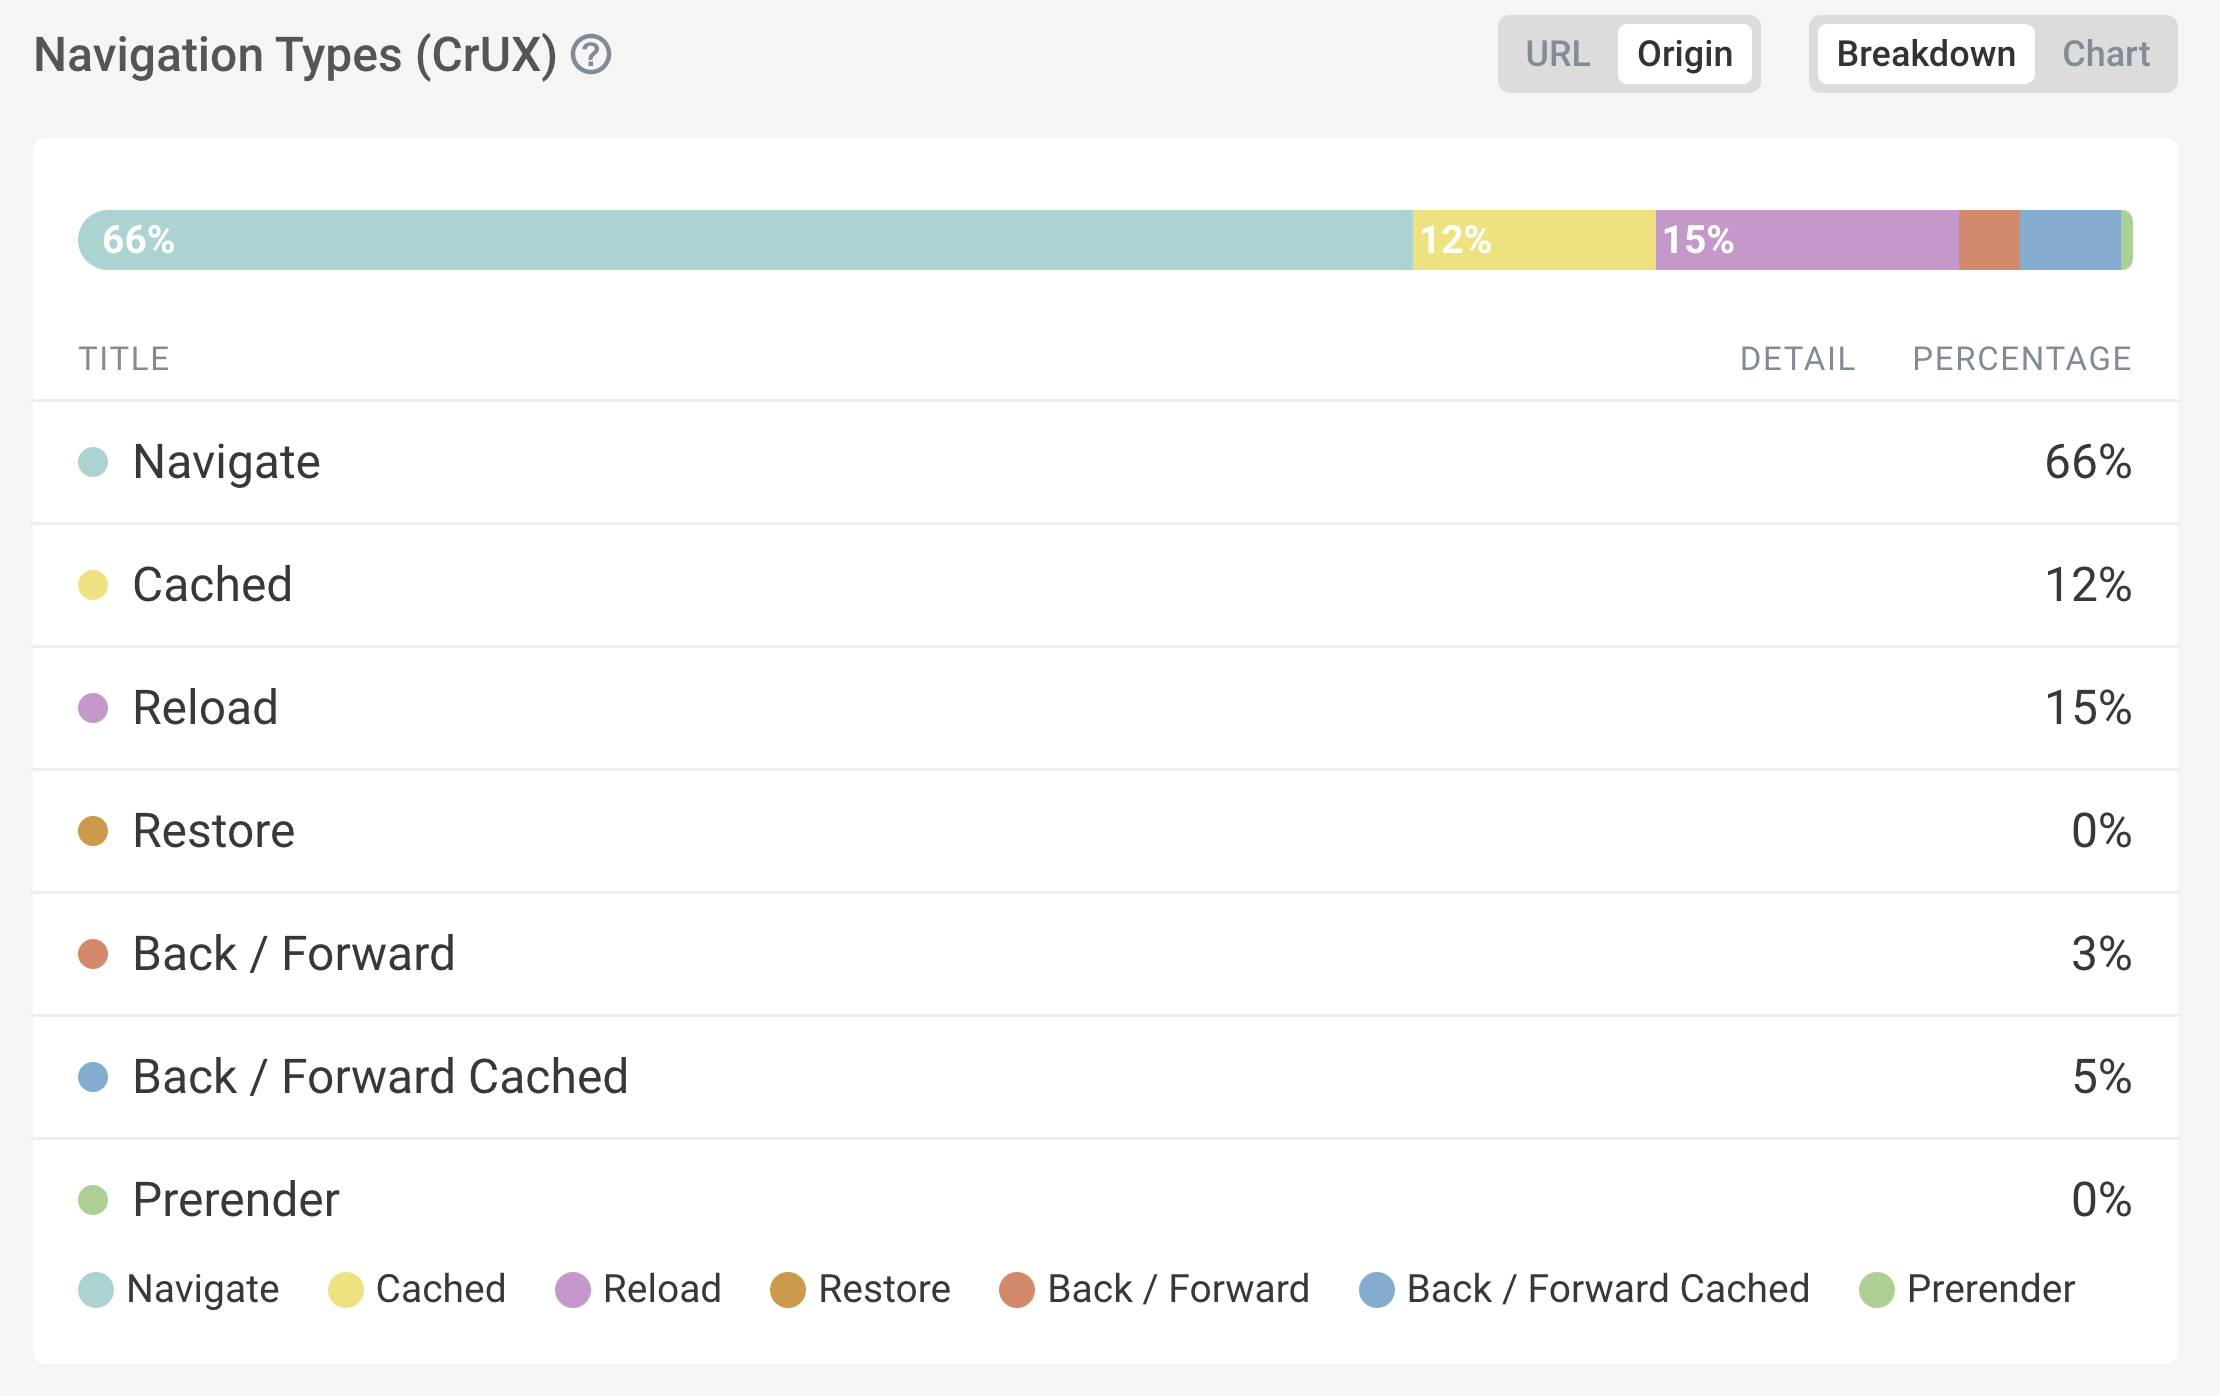
How DebugBear surfaces navigation data
Within the Navigation Types (CrUX) component in lab data
DebugBear uses the Chrome User Experience Report (CrUX) to show how often different navigation types occur on your website. You can find this data in the Core Web Vitals section of a result.
If you do not see any available data:
- Try toggling between URL and Origin level data:
 .
. - Consider whether the website being tested is sufficiently popular to have data available.
Within the Real User Monitoring category
If you use DebugBear's Real User Monitoring (RUM) feature, navigation data is surfaced in a number of ways:
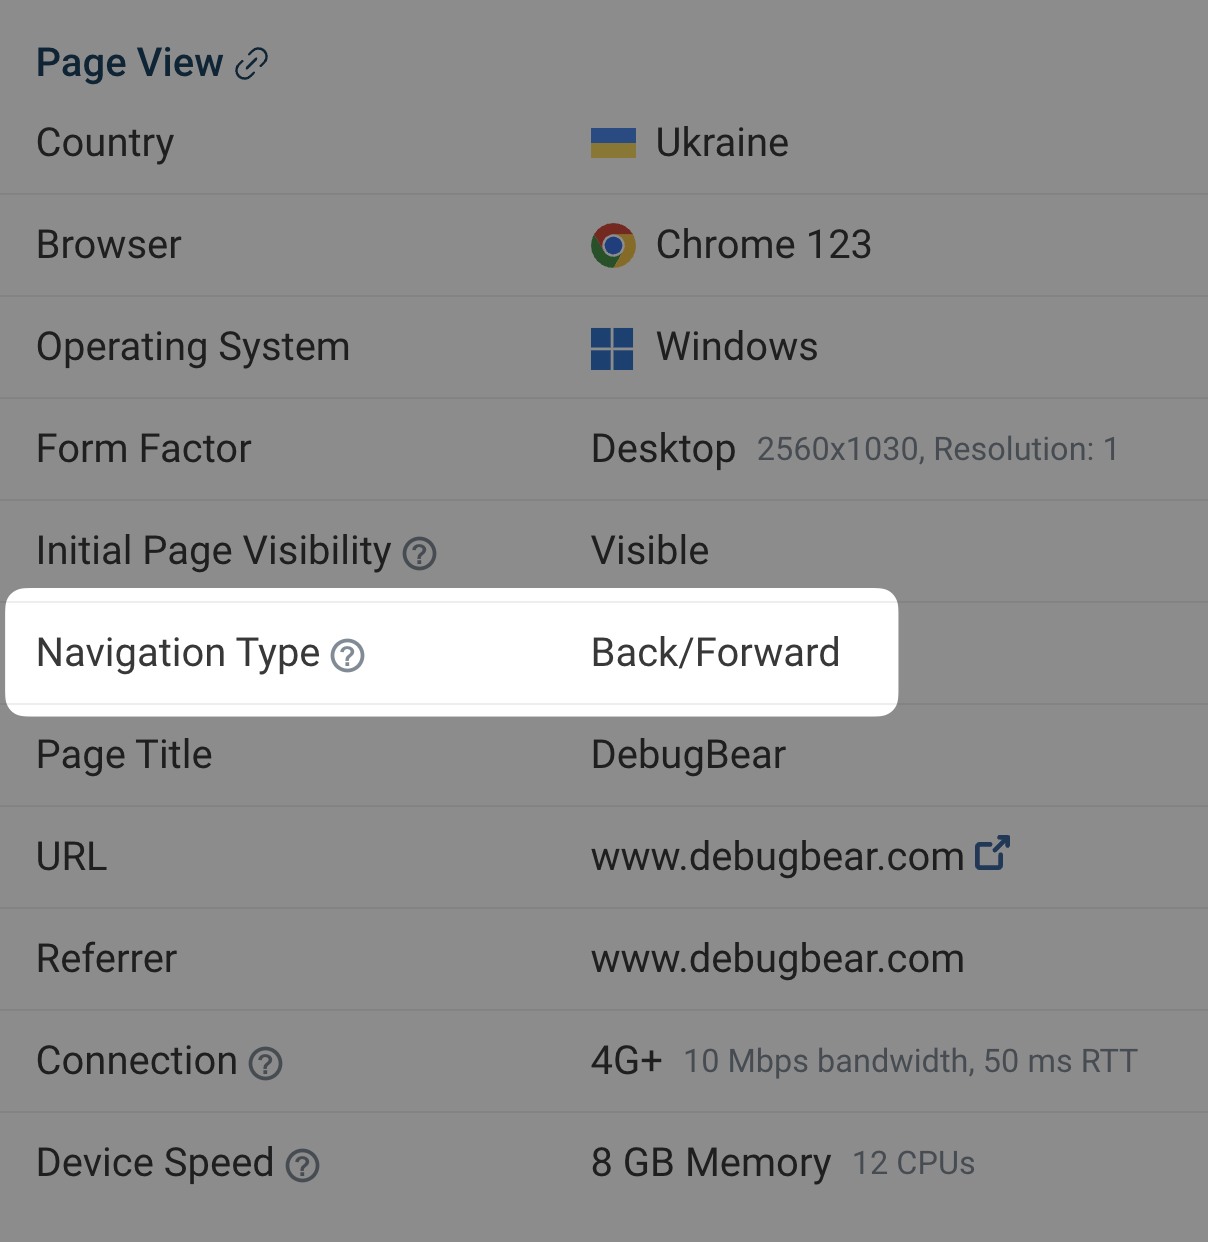
View navigation types within individual page view data
Within a DebugBear page analysis:
- Navigate to RUM > Page Views.
- Select an individual page view.
- Notice that the page view data includes a Navigation Type row.
Viewing granular data like this is helpful when you need to debug a specific page view.
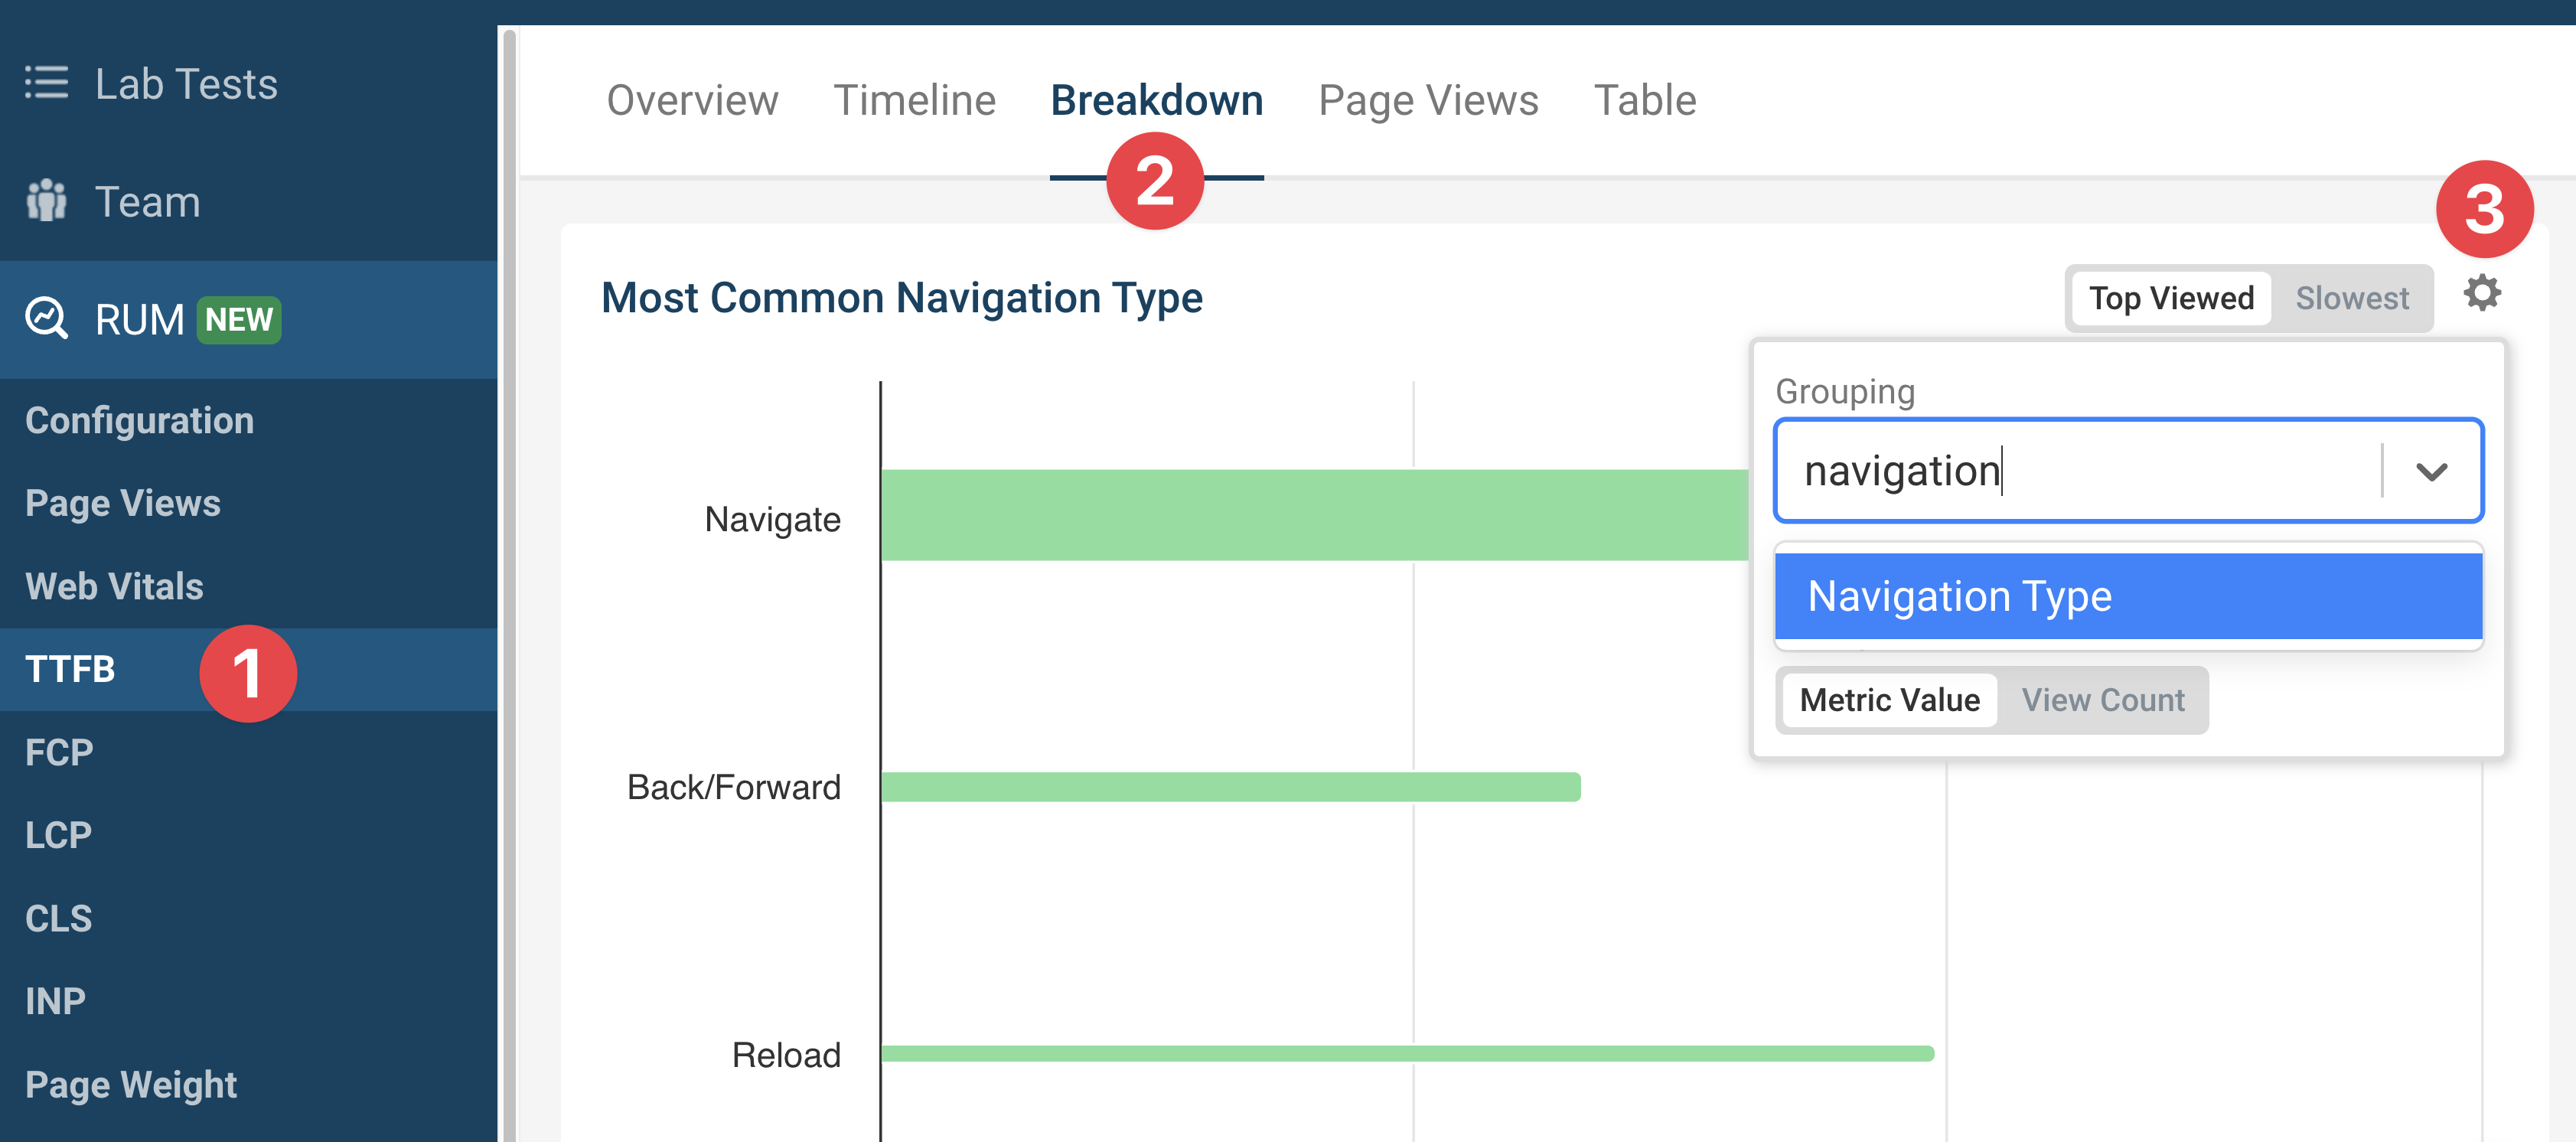
View navigation types for specific performance metrics
To understand how navigation types impact specific performance metrics:
-
Navigate to RUM > TTFB (Time to First Byte).
-
Select Breakdown.
Notice: A Navigation chart is not visible by default
-
For any chart with a cog wheel icon, select the cog wheel icon and select a Navigation Type grouping.
Instead of viewing a chart visualization, you can view the navigation type data in a tabular format:
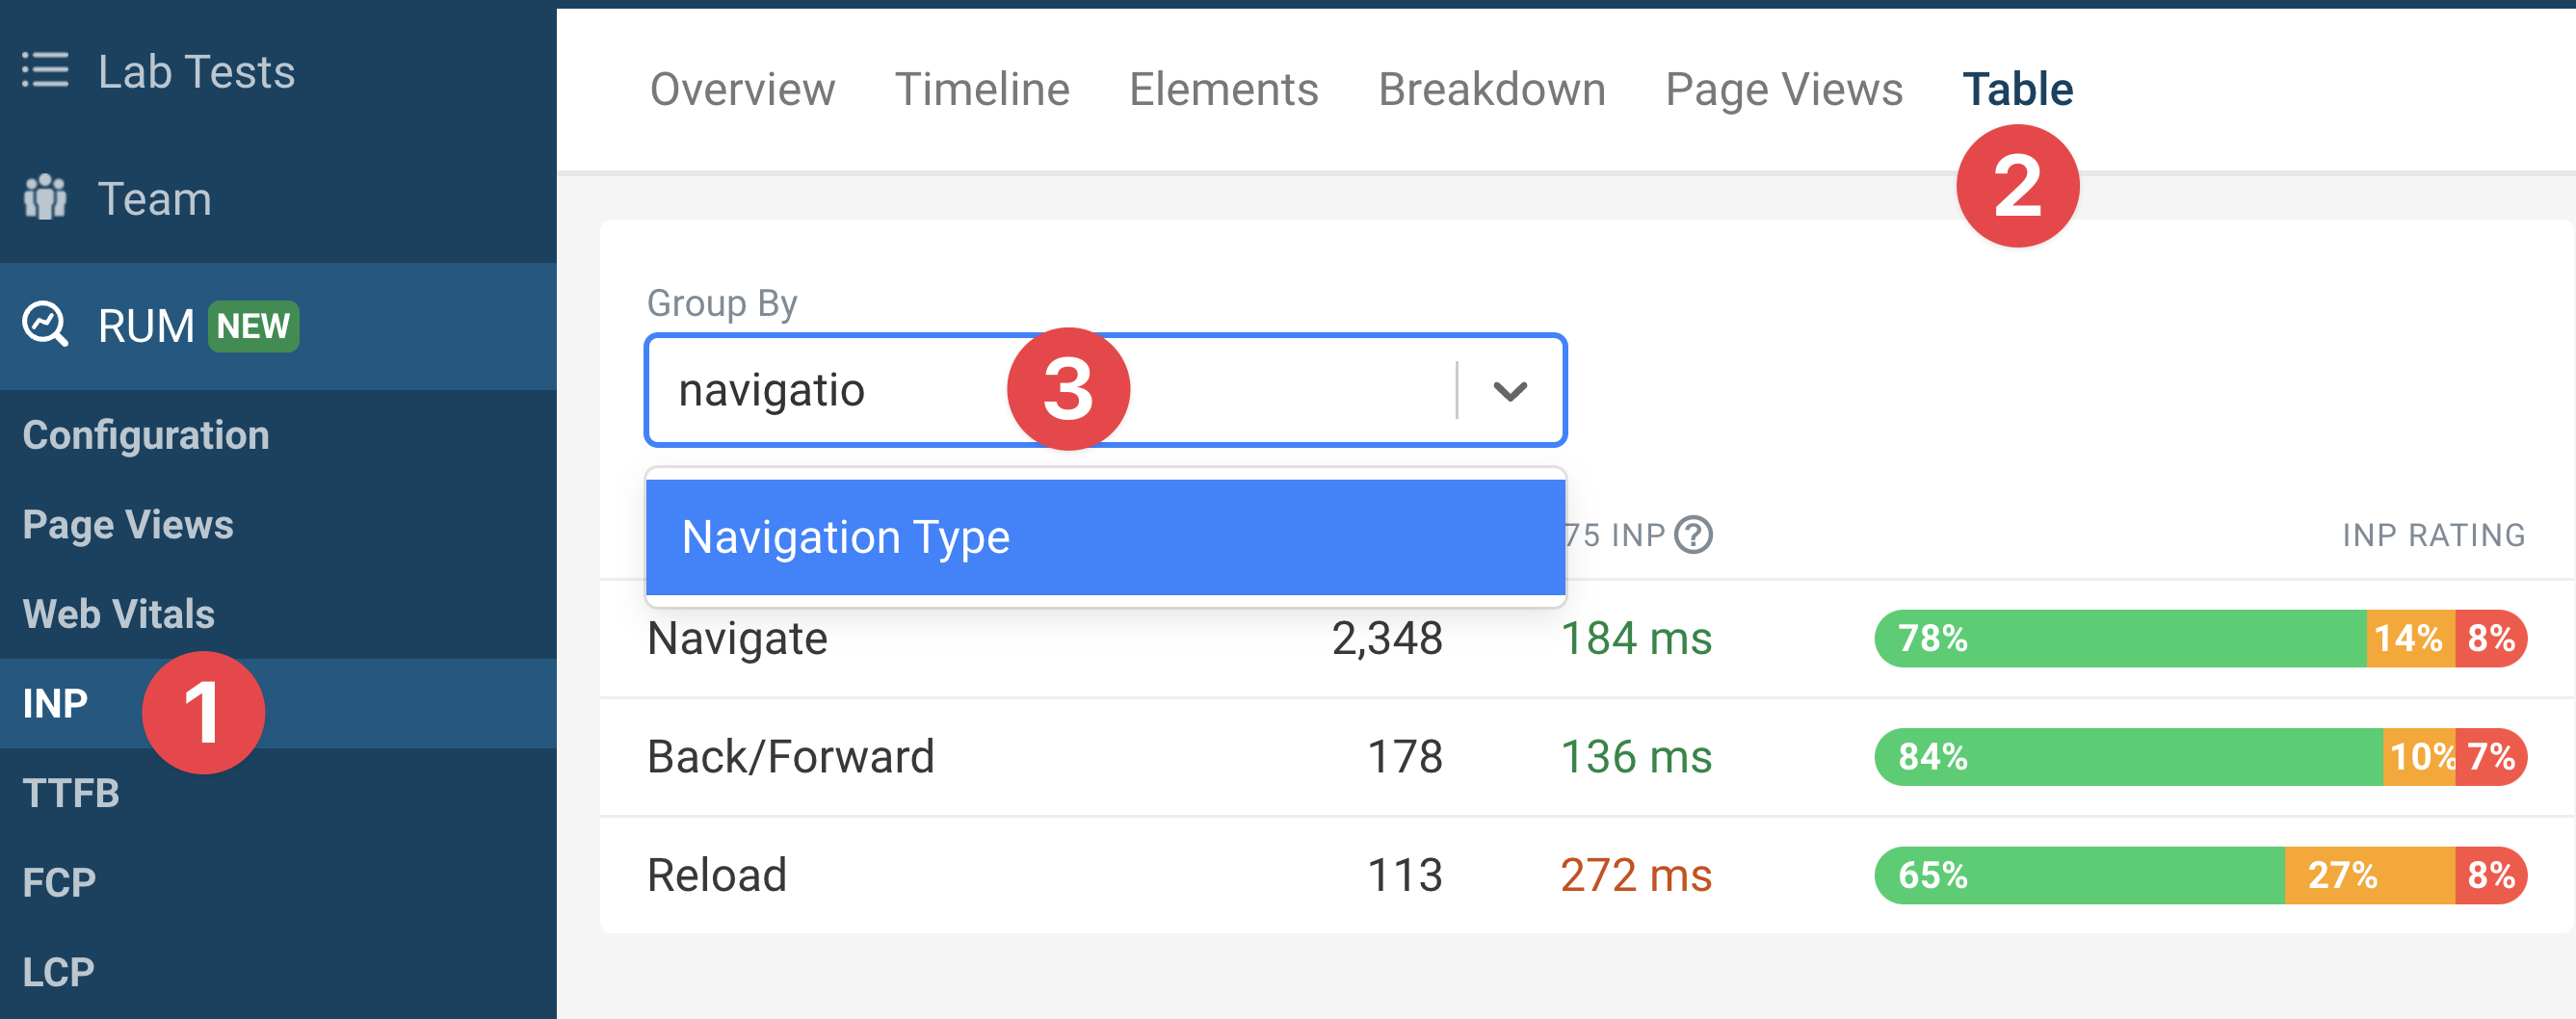
- Navigate to RUM > INP (Interaction to next paint).
- Select Table.
- Select Navigation Type from the dropdown menu.
The Breakdown and Table views are available for a number of useful web performance metrics, such as:
- Time to First Byte (TTFB)
- First Contentful Paint (FCP)
- Largest Contentful Paint (LCP)
- Cumulative Layout Shift (CLS)
- Interaction to next paint (INP)
- Page weight
You should study and understand how navigation types impact your website's performance, and identify opportunities for optimization.
Challenge yourself
As an exercise for yourself, answer the following questions:
-
What is the most common navigation type on your website?
-
Without looking at the data, how would you expect page weight to differ between navigation types?
-
Now check the Navigation Type breakdown within the Page Weight metric. What do you observe?
You should find that Page Weight is generally lower for back/forward navigations, as the browser can reuse resources from the cache.
Finding the navigation type in the browser
You can get the navigation type for the current page from the PerformanceNavigationTiming object with this JavaScript code:
performance.getEntriesByType("navigation")[0].type;
// "reload"
Track navigation types on your website
Rather than manually keeping track of navigation types, you can use a real user monitoring tool like DebugBear to automatically monitor the navigation types on your website. DebugBear collects data on how often each navigation type occurs and correlates it with key web performance areas like Core Web Vitals and more.
This allows you to easily see how performance differs between standard navigations, reloads, and back/forward navigations. (Note that even standard navigations benefit from browser caching).
With this data, you can prioritize optimizations that will have the biggest impact for your users. For example, if a large percentage of navigations are back/forward navigations but the back/forward cache isn't being used, you should focus on making those pages bfcache compatible.


Monitor Page Speed & Core Web Vitals
DebugBear monitoring includes:
- In-depth Page Speed Reports
- Automated Recommendations
- Real User Analytics Data