
We recently fixed a JavaScript memory leak in one of our cloud functions that we'd been ignoring for years.
Joan Leon asked some questions about the issue on Twitter, so in this article I'll explain more about what the issue was and why we didn't fix it sooner.
Out of memory crashes in our Google Cloud Function
There are several components to our synthetic monitoring product. We use Compute Engine instances to collect the performance data, but there are also several cloud functions responsible for processing queued analyses and storing test result data.
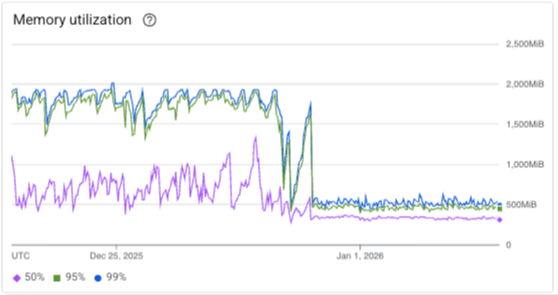
Before the fix, one of our cloud functions crashed like this a few times a day:
FATAL ERROR: Ineffective mark-compacts near heap limit Allocation failed - JavaScript heap out of memory v8::internal::V8::FatalProcessOutOfMemory(v8::internal::Isolate*, char const*, v8::OOMDetails const&)
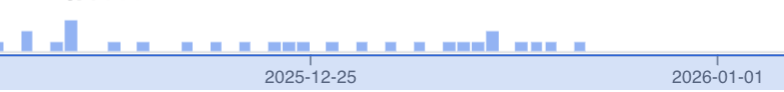
This chart shows the frequency of out of memory logs in Node.js over the past few weeks.
How we fixed the memory leak
I recently worked on some changes to speed up saving test results. Saving a result includes comparing the incoming data to previous test runs to see what changed and if the test result would trigger any alerts. If an alert would be triggered, we retry the test to confirm it's not just a one-off issue that can't be reproduced.
Deploying new versions of the cloud function made me aware of the old memory leak again. When trying to speed up result processing, I also tried using lodash memoize more to avoid unnecessary recalculations.
That's when I realized: lodash memoize keeps references to all previous data in memory unless you explicitly clear the cache!
Luckily, lodash memoize also provides functions to manually edit or clear the cache. We now do that every other time a test result comes in.
import { memoize } from "lodash";

export const getUrlInfo = memoize(function getUrlInfo(url) {});

export function clearGetUrlInfoCache() {
  getUrlInfo["cache"].clear();
}
We could also use an LRU cache (Least Recently Used). That way older items would be cleared automatically as new items are added.
Why didn't we find it earlier?
Back in 2019, I just increased the cloud function instance memory because I wasn't able to find the cause.
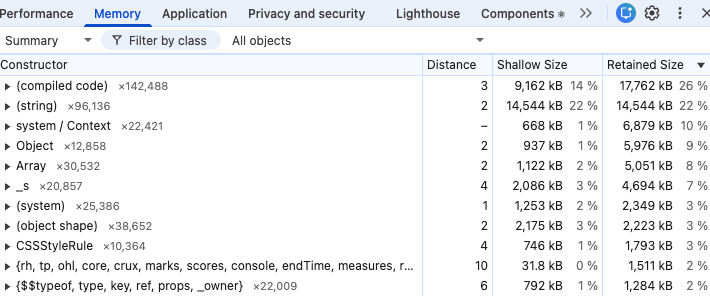
We can't access a heap snapshot in the production environment. However, I did try to replicate the issue locally but I wasn't able to.
Now I know why: the getUrlInfo memory leak only happens for unique URLs. If I run the same test several times, there is no noticeable memory increase. Only when processing URLs from thousands of requests made on different websites does the memory leak become apparent.
The out of memory crashes also didn't really have any adverse impact: the cloud function invocation would fail, we would retry the request, and the test result would be saved successfully on the next attempt.
Overall our synthetic test infrastructure is built to be resilient to occasional failures. If you test enough pages you'll eventually run into page crashes, Chrome errors, or hanging JavaScript code. So we make sure that tests are still completed correctly even if the initial attempt didn't work.
Was there any business impact from fixing the issue?
While it's nice to have the issue fixed, overall it didn't make a big difference. It likely saved a few minutes a day in CPU time since, as cloud function invocations were slow when the crashes happened. We also avoid the need to retry the invocation.
We could reduce the instance memory now, but that's also tied to CPU speed. And the savings wouldn't be worth the potential performance impact of that.
The fix should also improve memory usage in our front-end code. However, while users are likely to view data for 10s of different test results in a session, the browser typically doesn't need to process thousands of test results like our backend does.


Monitor Page Speed & Core Web Vitals
DebugBear monitoring includes:
- In-depth Page Speed Reports
- Automated Recommendations
- Real User Analytics Data