
We've been busy making web performance monitoring better through the year. In case you've not been reading our monthly changelog updates, here's an overview of some of the major improvements we made in 2025.
Real User Monitoring improvements
Our real user monitoring lets you see how fast your website is for actual visitors. We've made it easier to identify performance issues, get notified of regressions, and measure the impact of performance optimizations.
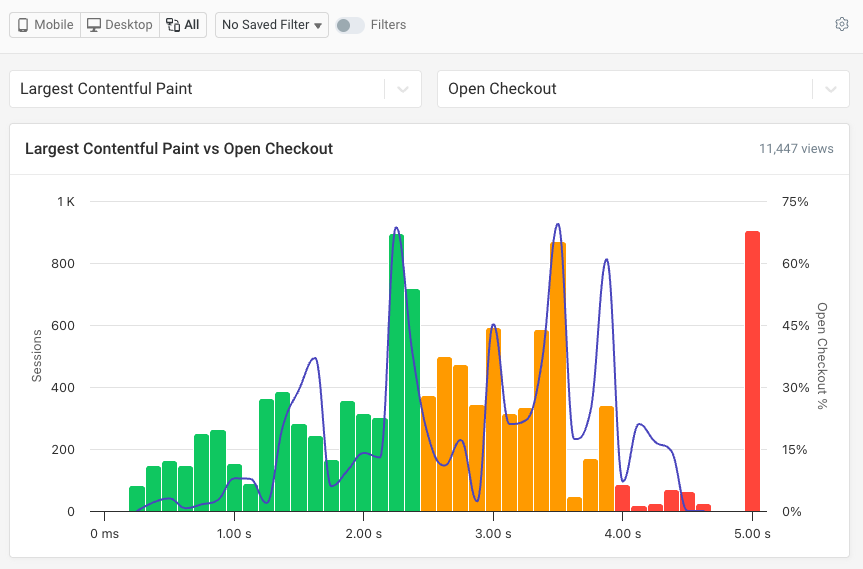
Measure business impact with conversion tracking
Performance matters for user experience. But does performance work pay off financially?
Conversion tracking lets you record conversion events along with your performance metrics in DebugBear. You can then see how conversion rates and page speed correlate.
A more intuitive design to go from metrics to insights
At DebugBear, our strength has always been in providing in-depth technical data to help development teams diagnose and fix performance issues. But in the past we've done less well at providing an overall assessment of how your website performs and pointing out where to look for issues.
Our new RUM dashboard addresses that, highlighting overall performance trends and specific pages to check.
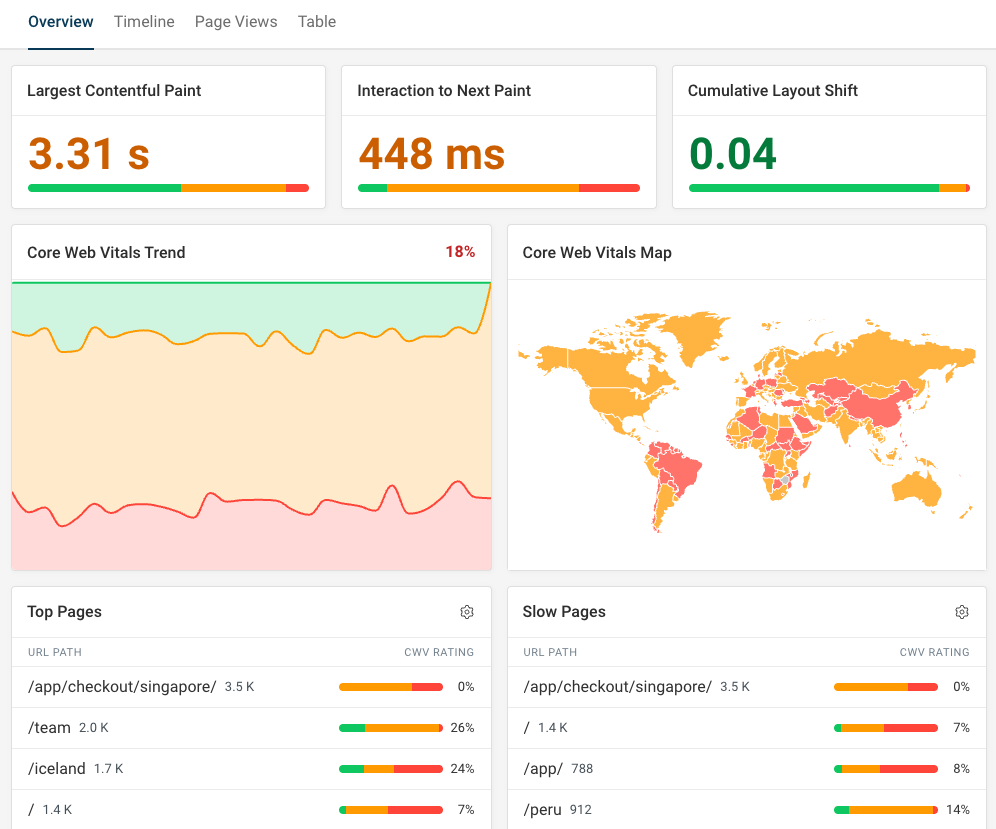
That doesn't mean the detailed debug data isn't there any more. We've just updated it to look nicer and be easier to interpret.
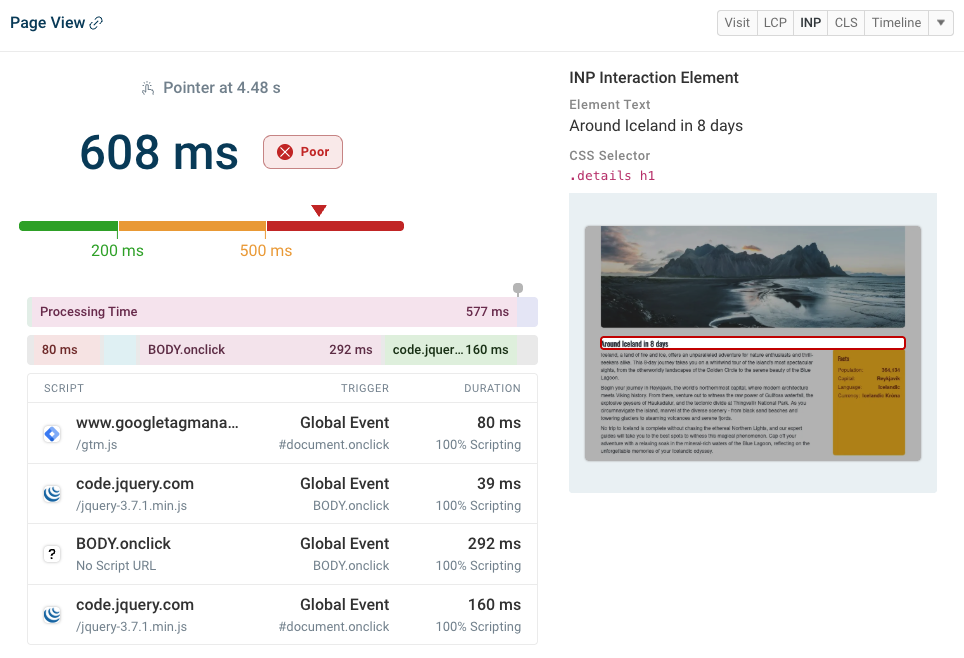
For example, here's how we visualize Long Animation Frames data for slow interactions.
Define custom RUM alert thresholds
You can now define advanced performance budgets for your RUM data:
- Alert on absolute or percentage changes
- Alert right away or only on consistent breaches
- Filter data for specific pages, browsers, etc.
Get alerts sent by email, in Slack, or in Microsoft Teams.
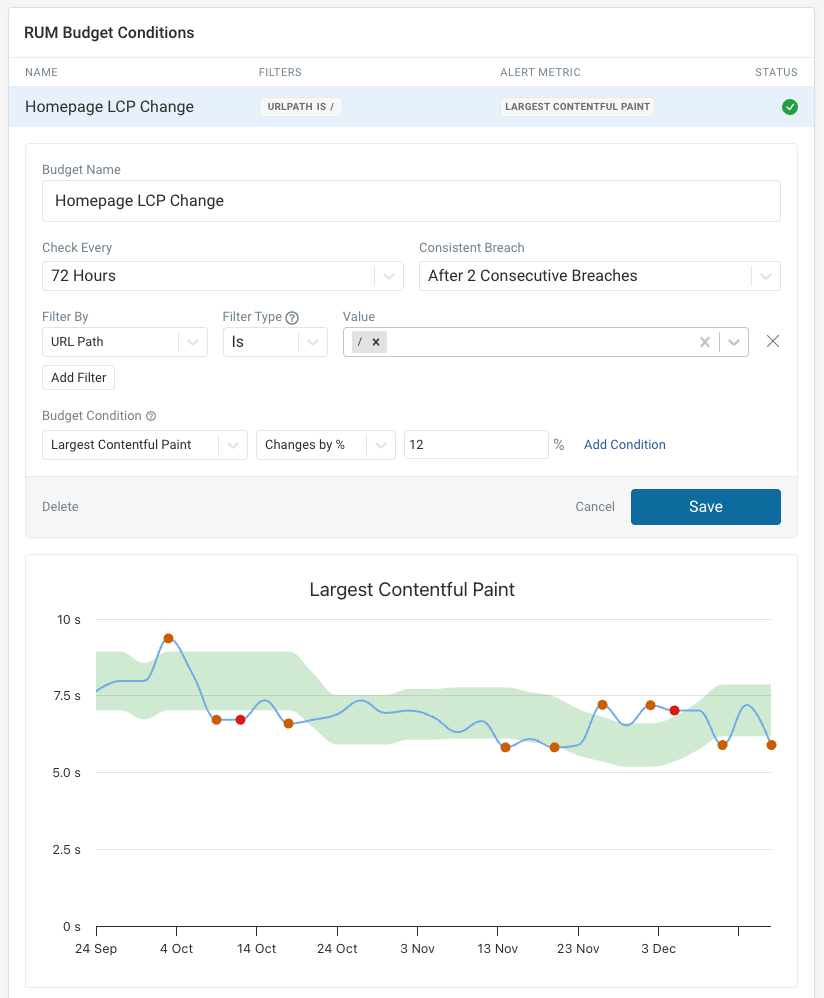
For 2026 I really hope we can get those ugly gray select boxes sorted out 😬
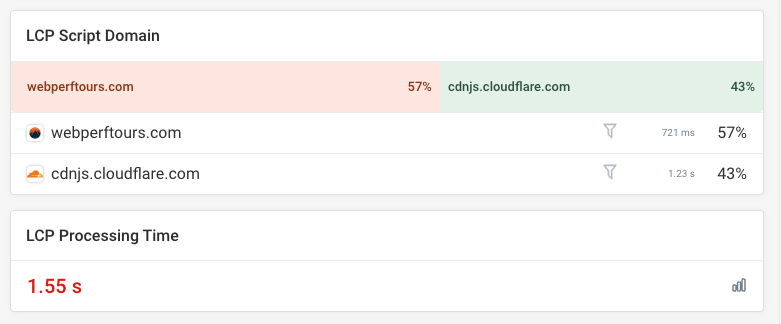
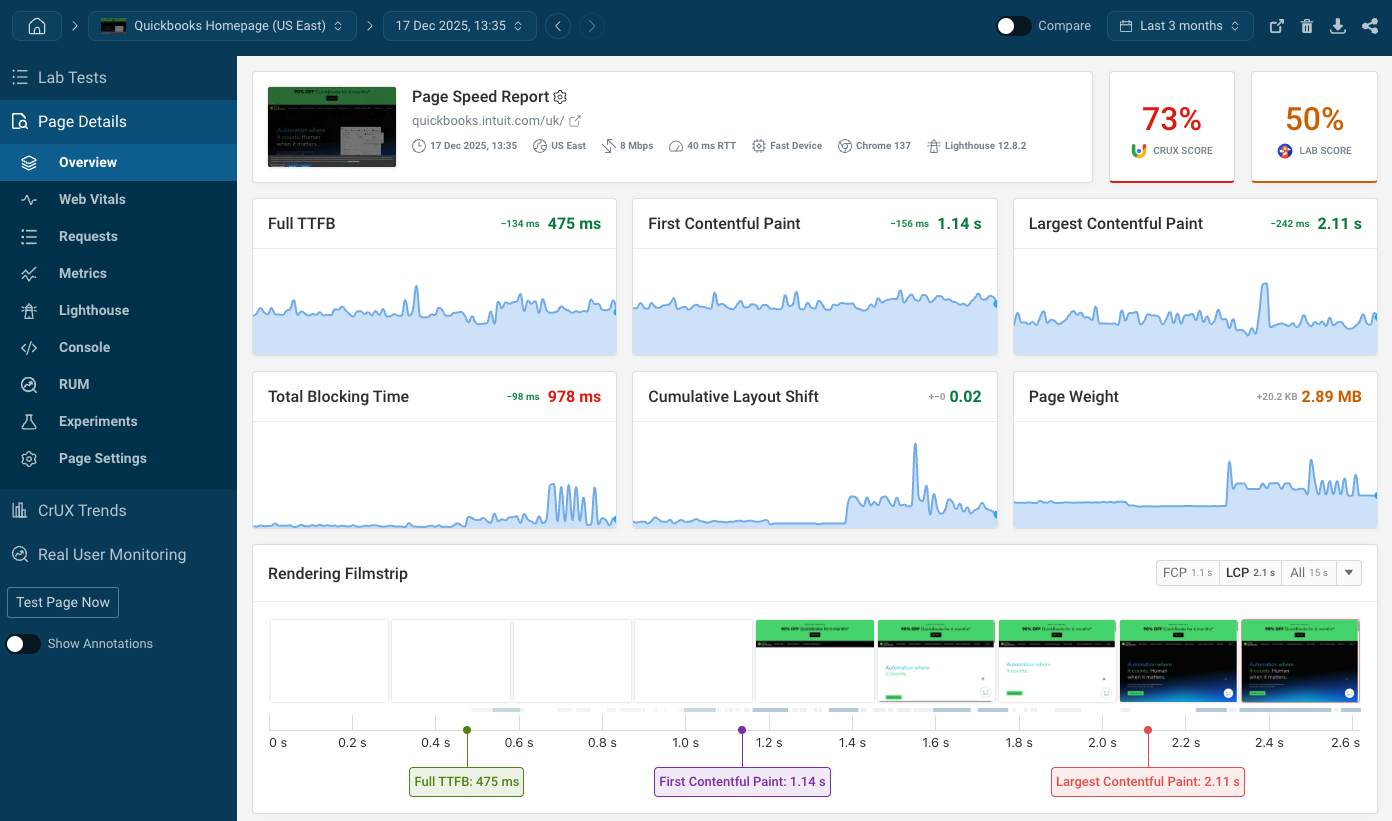
Debug CPU tasks that delay the Largest Contentful Paint
Resources that are loading slowly over a network are one big factor slowing down websites. But in the age of JavaScript and complex pages, CPU processing is also pushing up LCP scores.
DebugBear now lets you see how much and what scripts are involved.
More insights into single-page app performance
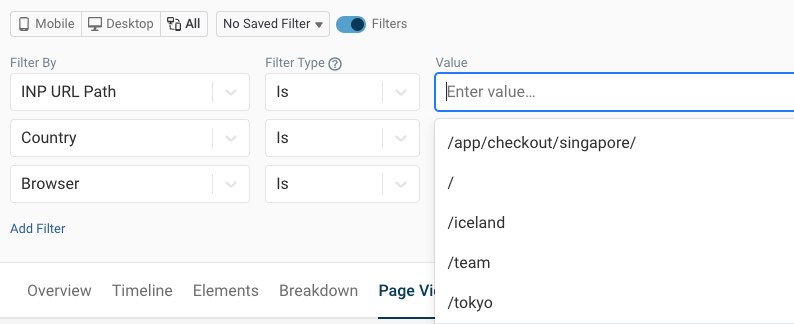
Single-page apps pose a special challenge when monitoring performance. The URL where a layout shift or slow interaction happens doesn't always match the URL of the initial page view.
We now provide an option to filter and break down data based on the URL where the CLS or INP score was recorded.
Google has launched a second origin trial for measuring soft navigations. If this ships in the stable version of Chrome we'll start reporting more granular performance scores for single page apps!
Synthetic monitoring updates
Synthetic monitoring provides in-depth test reports to help you speed up your website. We've been working on providing new performance insights, making it easier to keep track of your performance targets, and improved our user flow monitoring feature.
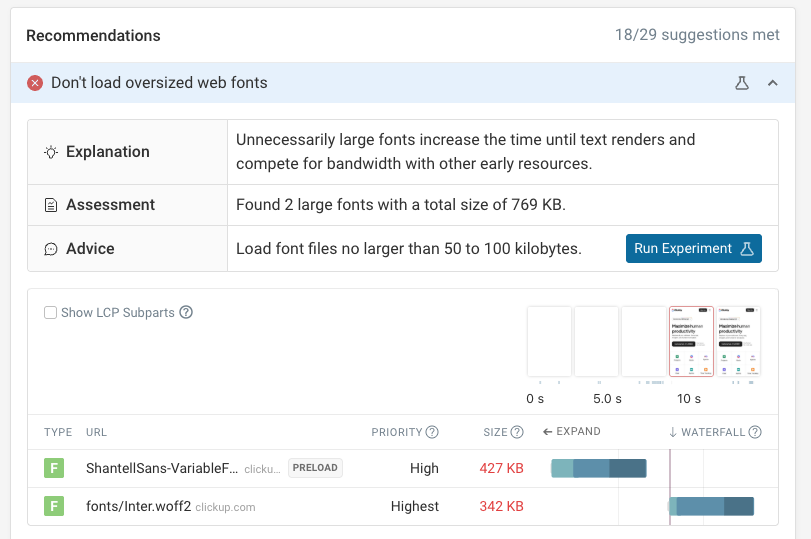
New recommendations
We've added new performance recommendations, for example the one below detecting when large web fonts are loaded on a page. Click the Run Experiment button to check how not loading those fonts would impact your metrics.
We also reviewed the importance of each optimization to make high-impact changes easier to spot.
Better HTML and CSS Size Analysis
Large HTML and CSS code can slow down your website. Our HTML and CSS size analysis features now make it easier to detect embedded images, fonts, or data.
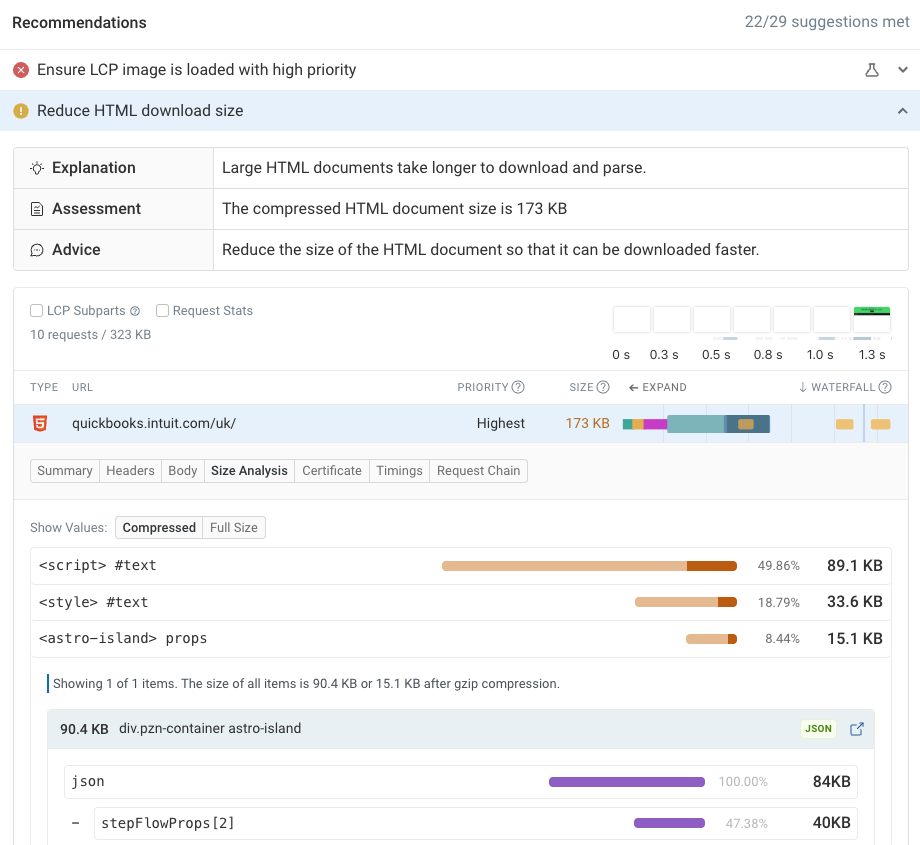
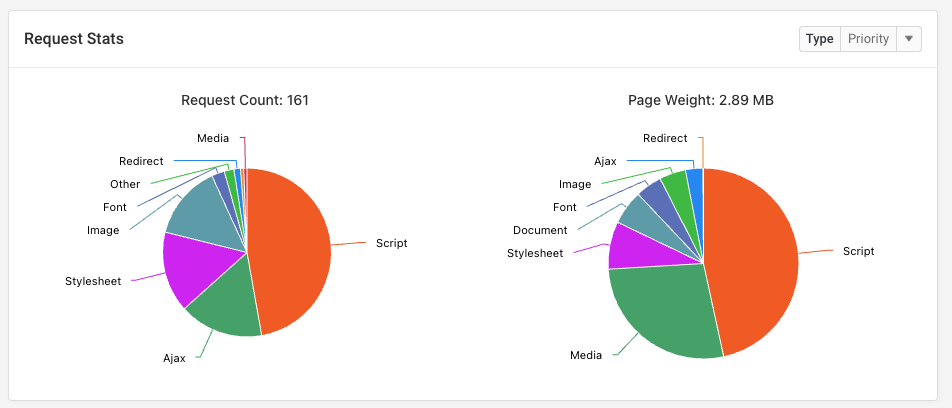
Request stats
The request stats section now shows a breakdown of the number of requests and their total resource size by request type, request priority, status code and more.
You can also filter the waterfall view to view stats for a subset of the resources loaded on your page!
Better design
Just like our RUM product, our synthetic tests design has benefited from design improvements to make it easier to focus on the most important metrics.
The page speed experiments results (and test comparison in general) now also show performance changes more clearly.

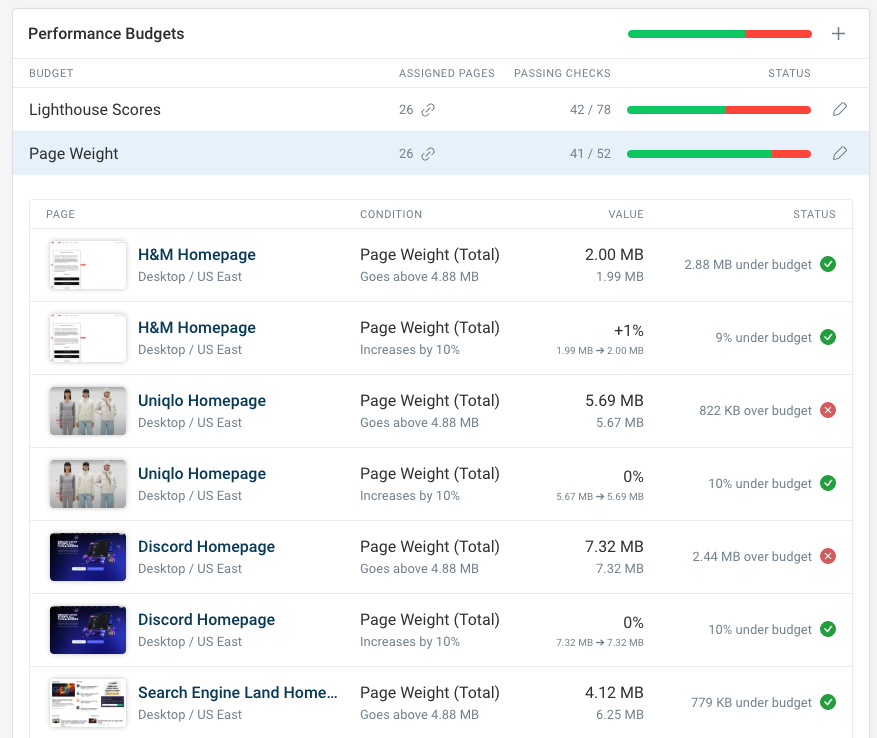
New budgets dashboard
Sometimes it's easy to lose track of performance issues after an alert is sent out. Maybe you've been working on priorities other than site speed.
That's where the budget dashboard helps: it shows you how you're performing for all the page speed targets you've set up previously. You can easily update performance budgets from here.
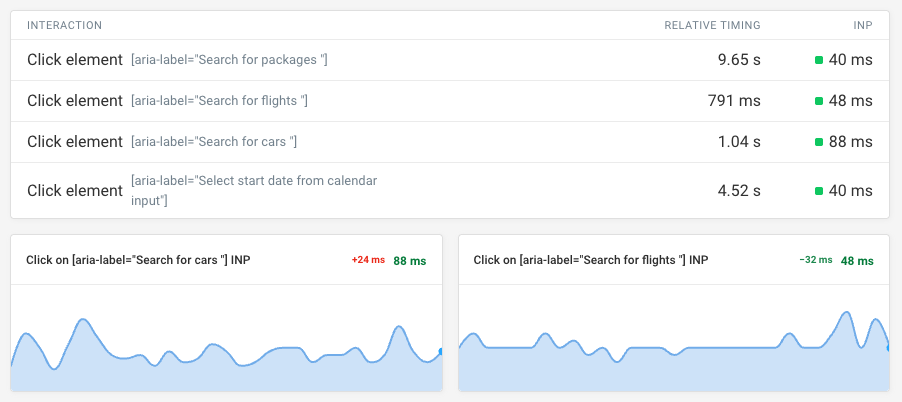
Track INP in synthetic tests
We now record Interaction to Next Paint scores when measuring user flow performance.
Better team collaboration
Delivering a great user experience means collaborating with others in your organization and beyond. We care about making that as easy as possible, whether you're working with clients, management, or your compliance team.
Looker Studio integration and PDF Export
Want to create dashboards for your organization based on different data sources? Our Looker Studio integration now lets you access DebugBear data directly in your reporting tool.
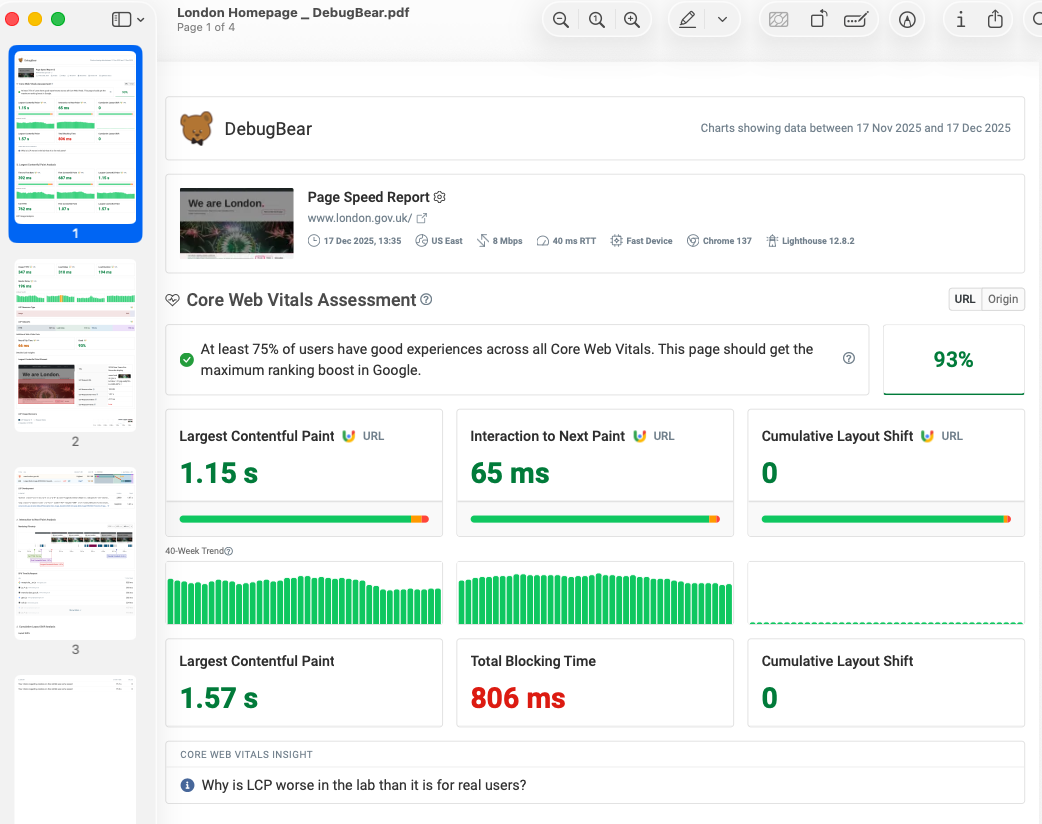
You can also now export DebugBear project data as a PDF to share with clients or other members of your team.
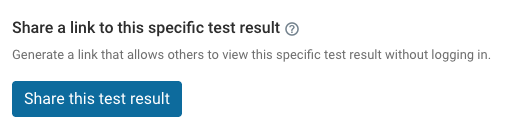
Share specific test results with a unique URL
We've had shareable links for DebugBear projects for a long time. But we learned that many of our users just want to share one test result at a time.
A few months ago we rolled out support for sharing either one specific test results or a comparison view between two synthetic tests.
Compliance and security
DebugBear is a great tool for monitoring and improving web performance. But it's not always easy to get new software approved by legal, procurement, and security teams.
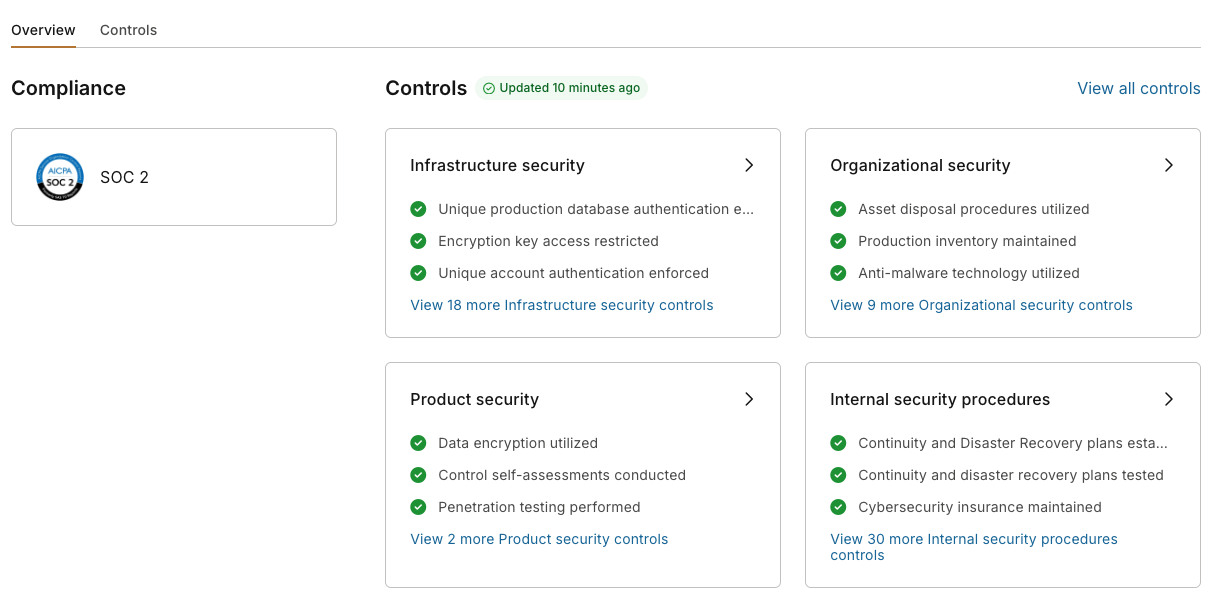
That's why this year we worked on getting SOC 2 certified. We worked with a consultant CISO to improve our security and compliance policies. An independent security company conducted a penetration test. We further locked down our production environment to ensure your data stays secure.
Check out our new trust center!
Get more out of Google CrUX data
Google's Chrome UX Report lets you see key performance metrics for your own website and those of your competitors.
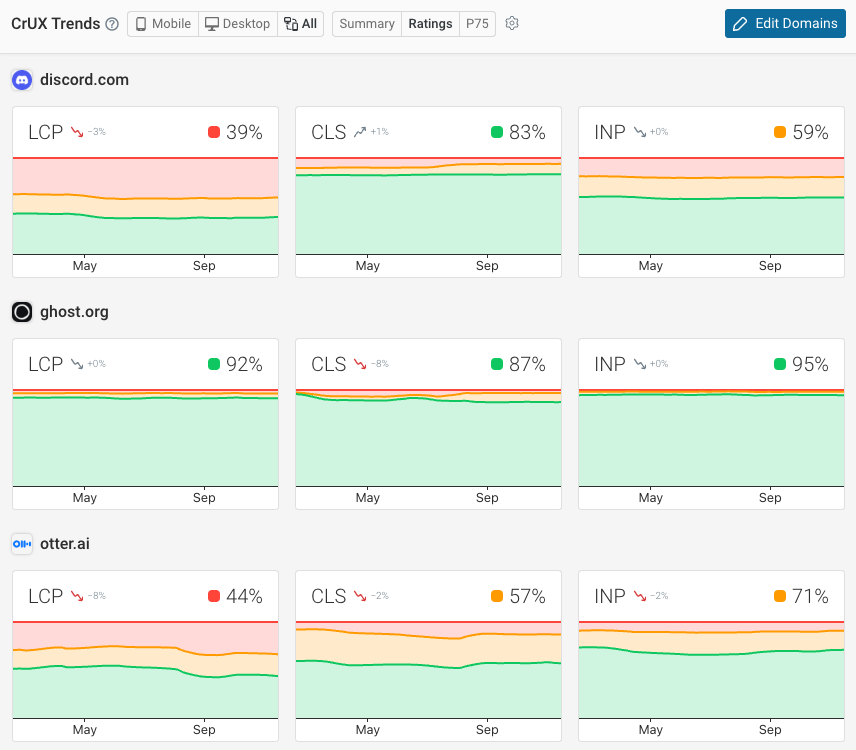
We added the CrUX Trends dashboard in late 2024. Since then we've made a number of improvements:
- View data across all devices, rather than just mobile and desktop
- Colors that are less likely to burn your eyes
- An x-axis!
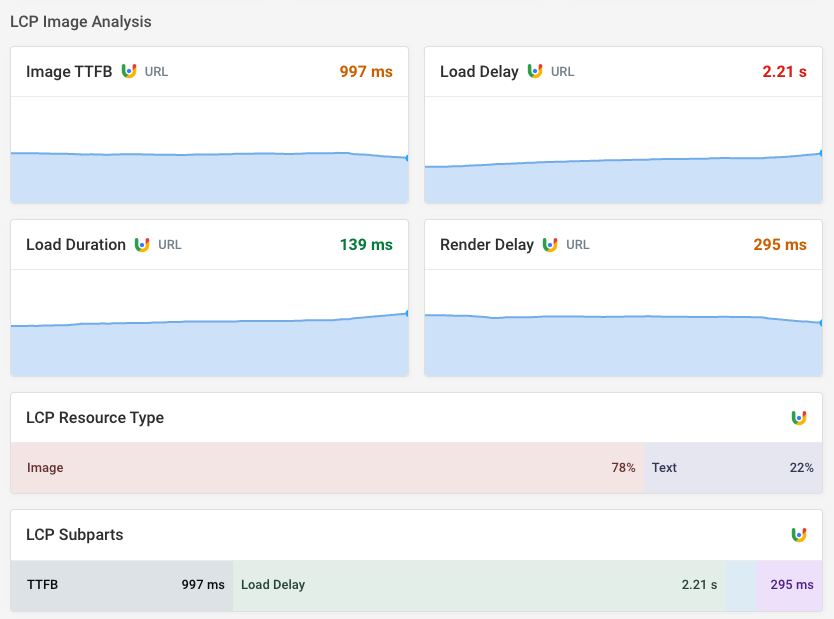
Google also started publishing real user LCP subparts data, telling you what's actually slowing down the page load.
You can find this data and more in the Web Vitals tab of your synthetic test results.
Roadmap for 2026
What's coming in 2026? We don't know yet!
Often what we build depends on user feedback. Sometimes the reason we don't add a new feature is because we're just not sure what it should look like. What's the actual problem we're trying to solve and for who? Having at least one or two users tell us exactly why they want a new piece of functionality and offer to give feedback on early prototypes makes it a lot more likely for us to start building a new feature.
We've done a lot of work on reworking how RUM budgets and alerts work this December. In 2026 we want to bring some of that functionality to synthetic budgets as well.
Soft navigation support in RUM data is also something we expect to improve on in 2026. But that depends on how Chrome decides to move forward with its implementation.
More flexible dashboards are also something we're planning to work on. We try to give you the dashboards you need to fix performance issues, rather than making you build your own. But being able to build custom reports that just show the metrics that matter to your website is also a really powerful feature!
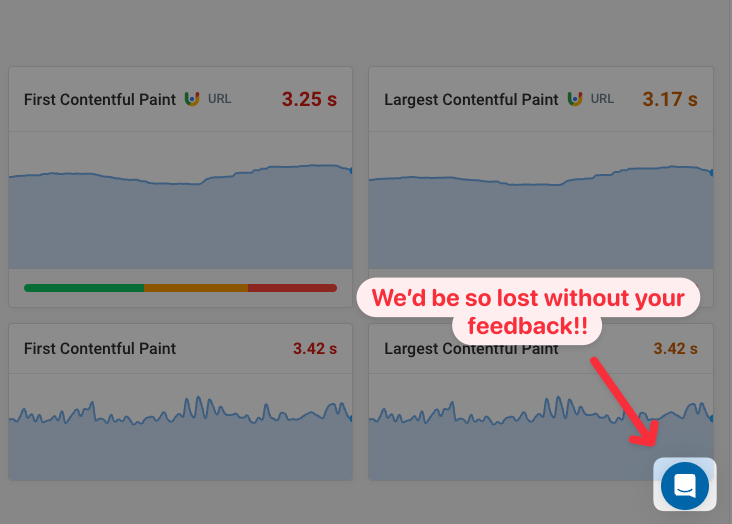
Share your feedback!
If there's a feature you've been hoping for, or if there's a bug you've been ignoring for a while: click on the Intercom chat bubble in the bottom right of your dashboard and let us know!
We appreciate everyone who's shared their feedback this year, suggested features, and helped us understand their perspective on how we can help them succeed in web performance.
If you'd to discuss a suggestion or if you're not sure if DebugBear can meet your requirements, you can also book a call with me here.


Monitor Page Speed & Core Web Vitals
DebugBear monitoring includes:
- In-depth Page Speed Reports
- Automated Recommendations
- Real User Analytics Data