Measure And Optimize The Lighthouse Performance Score
Google's Lighthouse tool tests the performance of a website and gives it a score rating from 0 to 100. This Performance score is calculated by combining several different performance metrics.
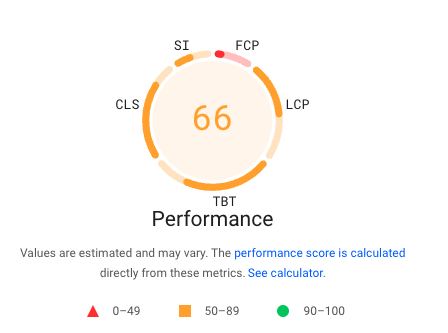
The Performance rating that's shown on PageSpeed Insights is also calculated using Lighthouse.
This article looks at how the Lighthouse Performance score is determined, how to interpret it, and how it varies between runs and tools.
What is the Lighthouse Performance score?
Performance is one of the audit categories supported by Lighthouse, along with SEO, Best Practices, and Accessibility. Each category is assigned a score from 0 to 100.
The Lighthouse Performance score is a lab-only metric specific to Lighthouse, and is not measured for real users.
Lighthouse Performance testing tools
A lot of different performance testing tools include Lighthouse score data, for example:
- PageSpeed Insights by Google
- The Website Speed Test by DebugBear
- SEO tools like Ahrefs
You can also run scheduled Lighthouse tests on your website to see how your scores change over time and get alerted when there's a problem.
How is the Lighthouse Performance score calculated?
Lighthouse performance scoring works by combining 5 different web performance metrics.
The overall composition has changed over time, but the table below shows the breakdown as of Lighthouse 12. Total Blocking Time and Largest Contentful Paint account for almost half of the Performance score.
| Metric | Acronym | % of Performance score |
|---|---|---|
| First Contentful Paint | FCP | 10% |
| Speed Index | SI | 10% |
| Largest Contentful Paint | LCP | 25% |
| Total Blocking Time | TBT | 30% |
| Cumulative Layout Shift | CLS | 25% |
Note that only these 5 metrics count for the Performance score – the Opportunities and Diagnostics audits do not directly impact it.
Run A Free Page Speed Test
Test Your Website:
- Automated Recommendations
- Detailed Request Waterfall
- Web Vitals Assessment
How to see a breakdown of your Lighthouse score
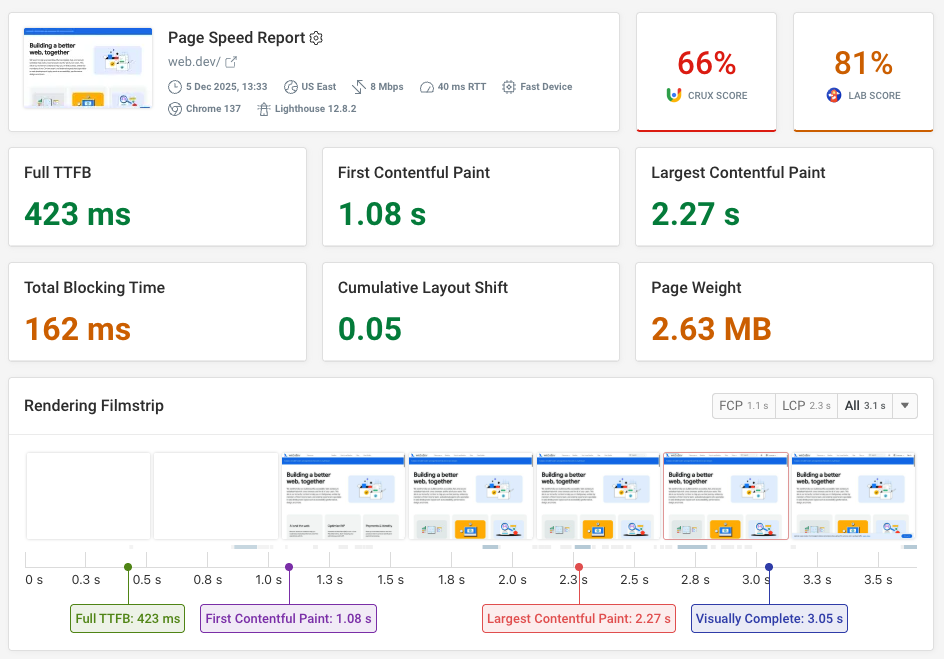
You can run a DebugBear Speed test to view a breakdown of your Performance score or click the "See Calculator" link on PageSpeed Insights.
Score breakdown in DebugBear
DebugBear test results show a detailed breakdown of how much each metric contributes to the overall score and what scores you need to focus on to improve.
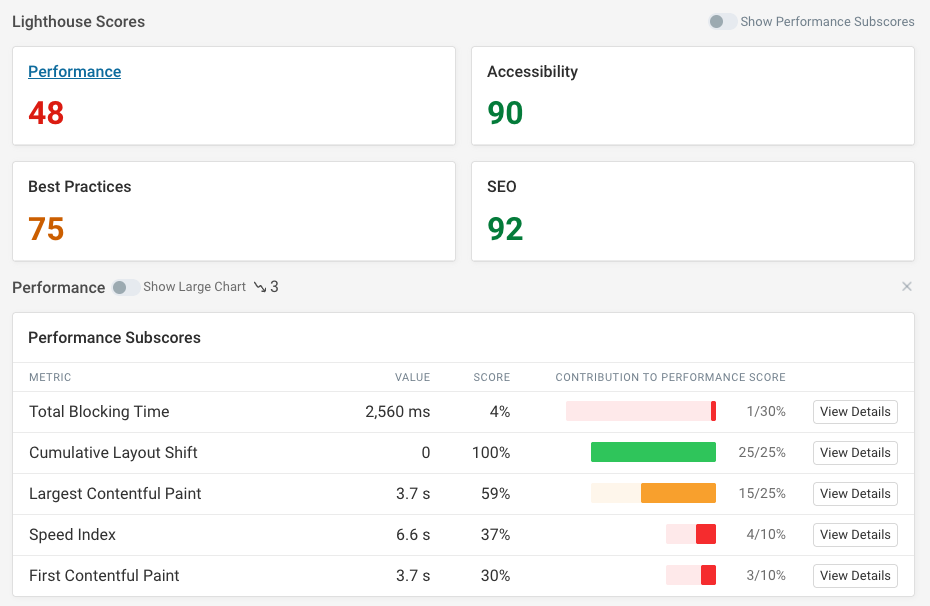
Click on "View Details" to see what is holding back your score for each metric and get recommendations on how to improve it.
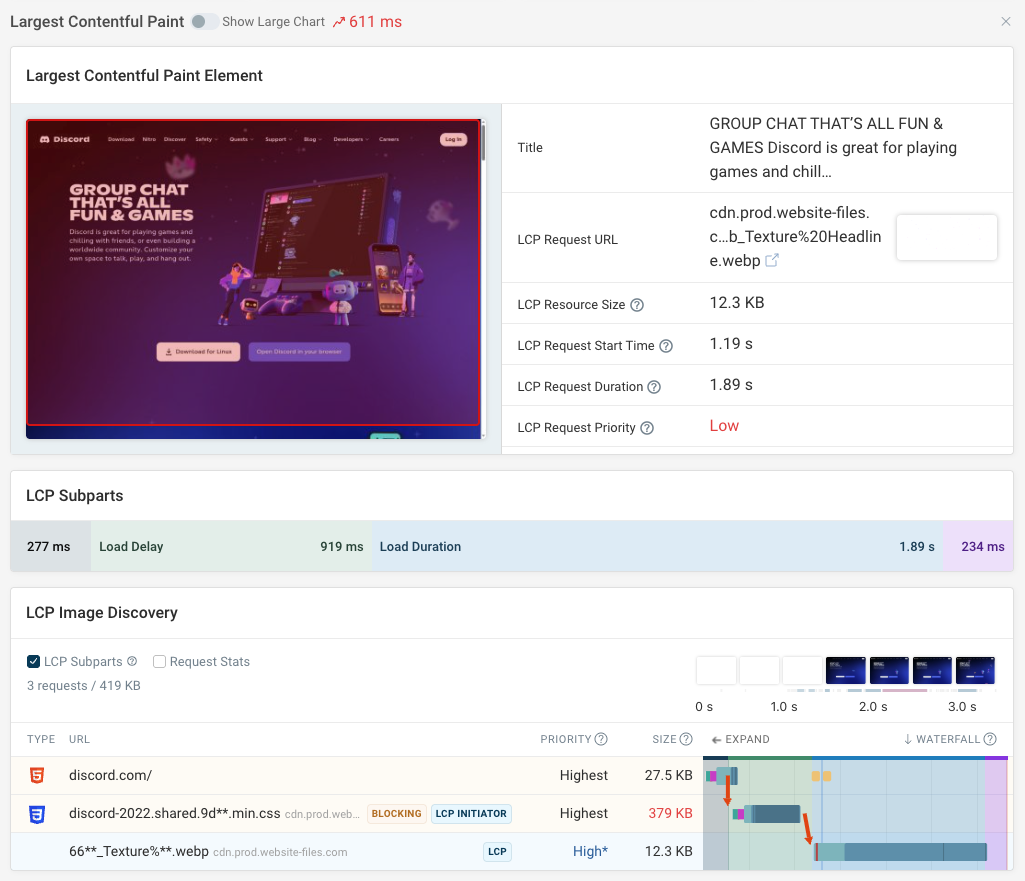
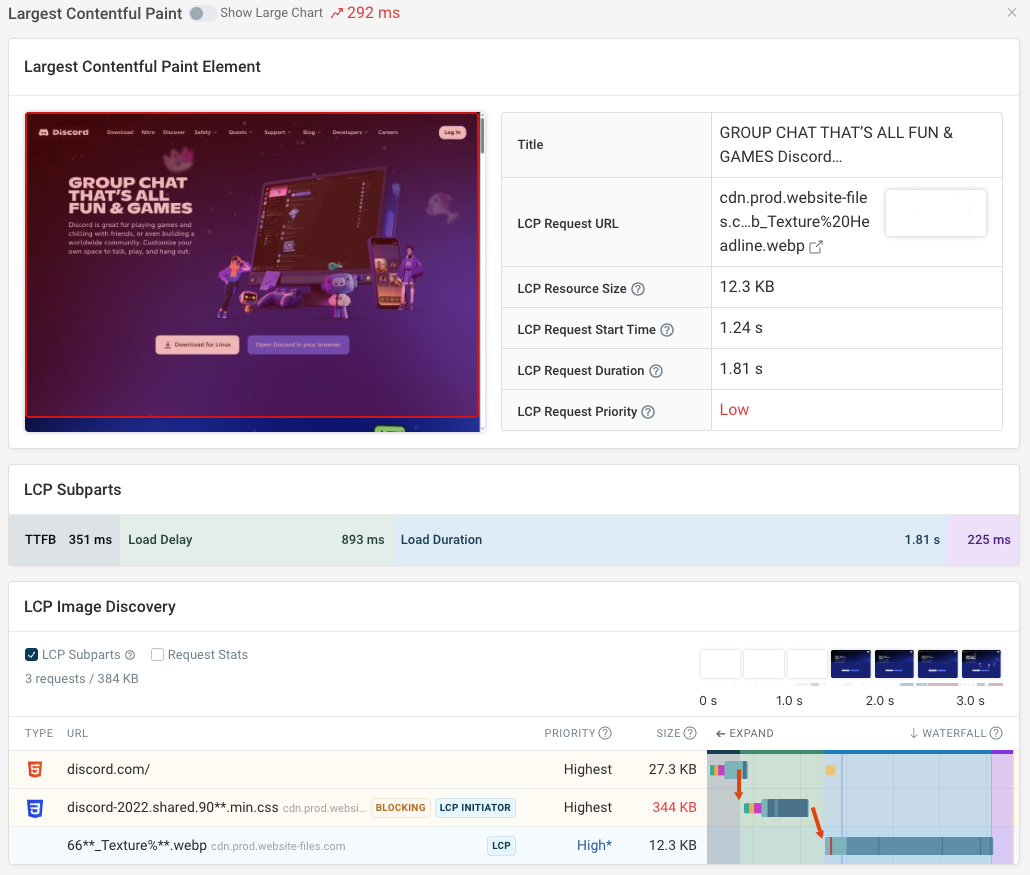
For example, for the Largest Contentful Paint metric you can see what the LCP element is, how big the contribution of each LCP component is, and what resources were involved in loading LCP images.
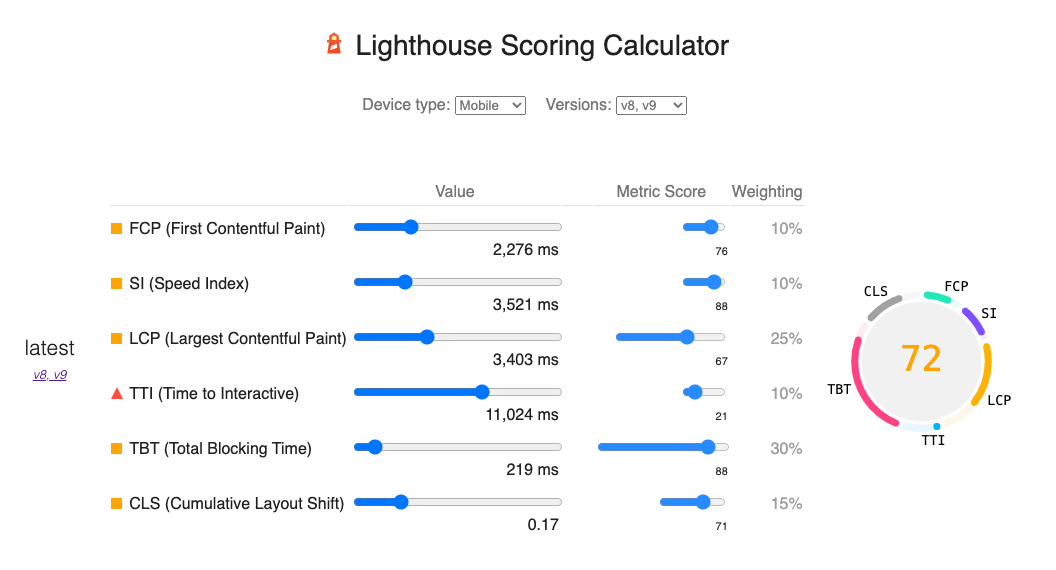
Lighthouse scoring calculator
Google also provides a calculator for the overall Lighthouse score. You can change the value of each performance metric to see how it affects the metric subscore and overall score.
Does the Lighthouse score affect SEO?
The Lighthouse Performance score does not directly impact SEO. Google looks at real user data to assess user experience, so you might get a Lighthouse score of 20 but still see no negative ranking impact.
However, a slow website in the lab may also be slow for real users. The real-user Core Web Vitals metrics that Google collects are used as a ranking signal.
You can run a free Core Web Vitals test or use Google Search Console to see if performance is impacting your rankings.
Limitations of the Lighthouse score
A Lighthouse test of the page load is run in the lab, and won't provide an Interaction to Next Paint (INP) metric as there is no user interaction to record.
The Total Blocking Time metric aims to provide a partial lab alternative to INP. However, it only looks at the input delay component of INP, which is caused by background tasks unrelated to the user interaction. If the user were to interact with the page at some point, how much input delay would they face? In practice, a lot of time is spent processing the interactions and updating the UI.
First Contentful Paint and Speed Index are also not included in the Core Web Vitals. These metrics are strongly correlated with the Largest Contentful Paint. While they do provide valuable information about how fast your page renders, they were not included as Core Web Vitals in their own right.
Finally, Time to Interactive is also not a Core Web Vitals metric. Time to Interactive provides useful information on how long it takes for your page to load fully, but it only looks at CPU and network activity rather than focusing on the user.
Is Google Lighthouse accurate?
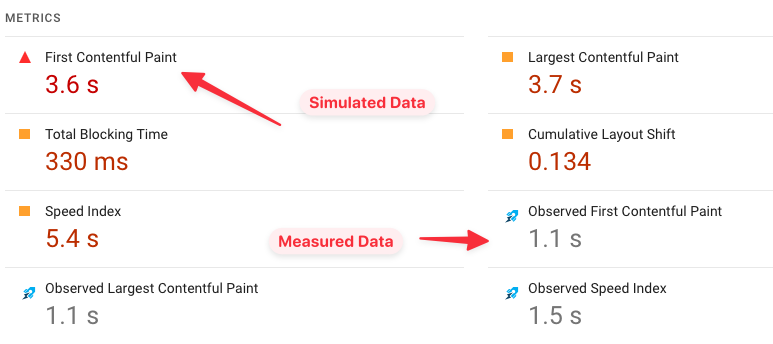
The Lighthouse score is frequently unreliable. Most tools, including PageSpeed Insights, rely on simulated performance data rather than values that are measured directly.
To get more accurate Lighthouse data, use a tool like the DebugBear website speed test.
Performance score on mobile vs desktop devices
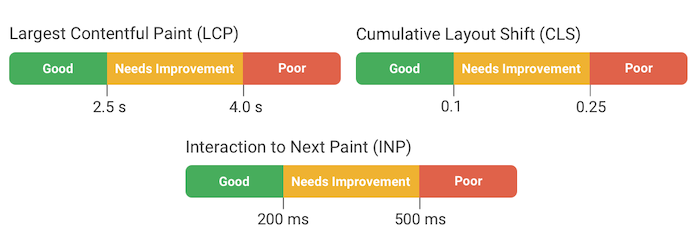
Unlike the Core Web Vitals, the Lighthouse Performance score uses different score thresholds on desktop and on mobile.
For example, to get an LCP subscore of 90+ in Lighthouse you need a Largest Contentful Paint below 2.5 seconds on mobile and below 1.2 seconds on desktop.
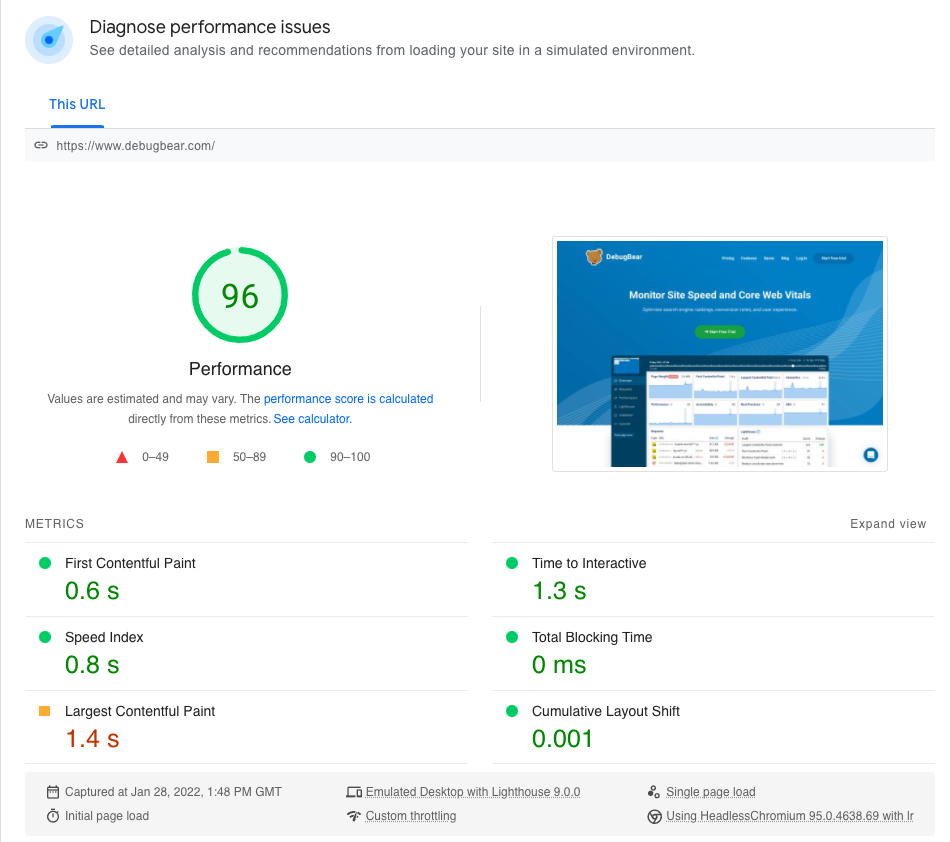
Measuring the Lighthouse Performance score with PageSpeed Insights
The lab data in Google's PageSpeed Insights tool is collected from Lighthouse, so you can find the Performance score at the top of the Diagnose performance issues section.
How to improve the Lighthouse Performance score
Look at the breakdown of your score to see what metrics you need to improve. Then analyze your website to see how those metrics can be optimized.
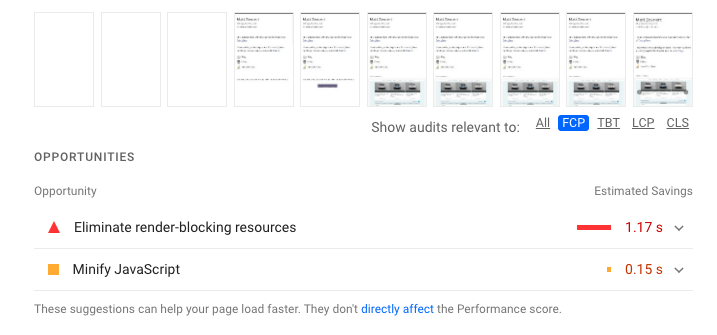
The Lighthouse report includes audits that show you how to improve your site speed. You can use the Show audits relevant to filter to view suggestions on how to optimize the metric you're interested in.
On DebugBear you can click View Details to get a detailed analysis for the given metric.
For example, when debugging Largest Contentful Paint you can see:
- What the LCP element is, and how long the LCP image took to load
- Whether delays come from server response time, render delay, or other factors
- A request waterfall highlighting how the LCP image was discovered
Lighthouse web performance recommendations
The Lighthouse performance audits can give you a lot of insights into what's holding back your Performance score.
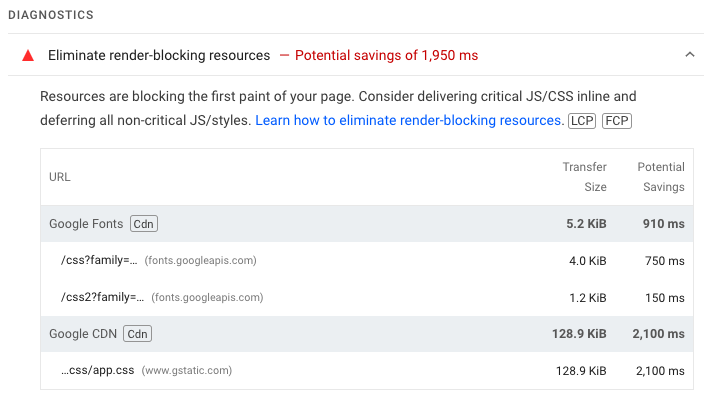
For example, you could get a recommendation to eliminate render-blocking resources. Render-blocking network requests slow down rendering on the page, hurting your page load milestones like the Largest Contentful Paint. Using the async and defer keywords on scripts helps you avoid these delays.
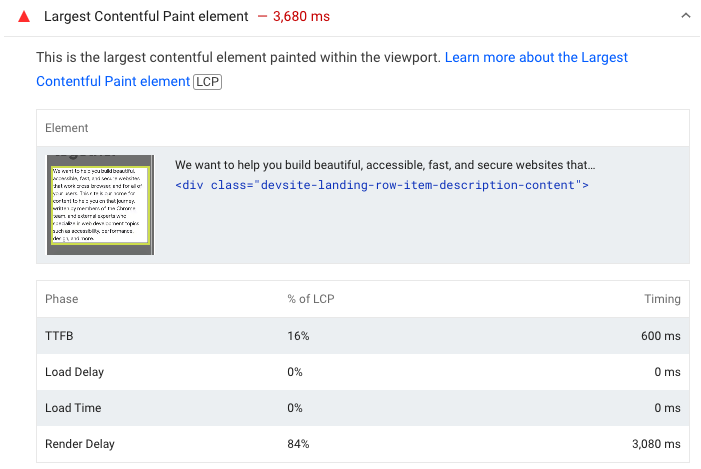
Looking at the Largest Contentful Paint element diagnostic can also tell you a lot about what you need to focus on to improve your Lighthouse score.
This audit will show you the LCP metric components. This breakdown tells you whether page load delays come from poor server response time, load delay, image load time, or rendering delays.
Why is the Lighthouse Performance score inconsistent between runs?
The Lighthouse score often varies between tests, and this increases with the complexity of your website. Here are a few common reasons for this variability:
- Different server response times (e.g. if your server is busy)
- Different routes that data takes on the network
- A/B tests or other page customizations
- The computer running the tests might have used CPU power for other processes
- Lighthouse might finish the test at different times, depending on whether it has seen a sufficiently long idle period
Why is the Lighthouse Performance score inconsistent between tools?
You will often see that different tools report different Lighthouse Performance scores. This might be for a few reasons:
- Different test locations (e.g. UK or US)
- More or less powerful CPUs
- Different data quality levels
- Different Lighthouse settings
- Different versions of Lighthouse/Chrome
By default, Lighthouse is run using a low-accuracy mode that simulates a slow network rather than testing on a slow connection. For example, this is what PageSpeed Insights uses, and it's also the default setting in Chrome DevTools.
How to monitor the Lighthouse Performance score
Automated tools like DebugBear can help you monitor Lighthouse scores over time. They'll continuously test your website and generate reports you can use to optimize performance.
In this dashboard you can see the Performance score and other Lighthouse scores for different websites over time.
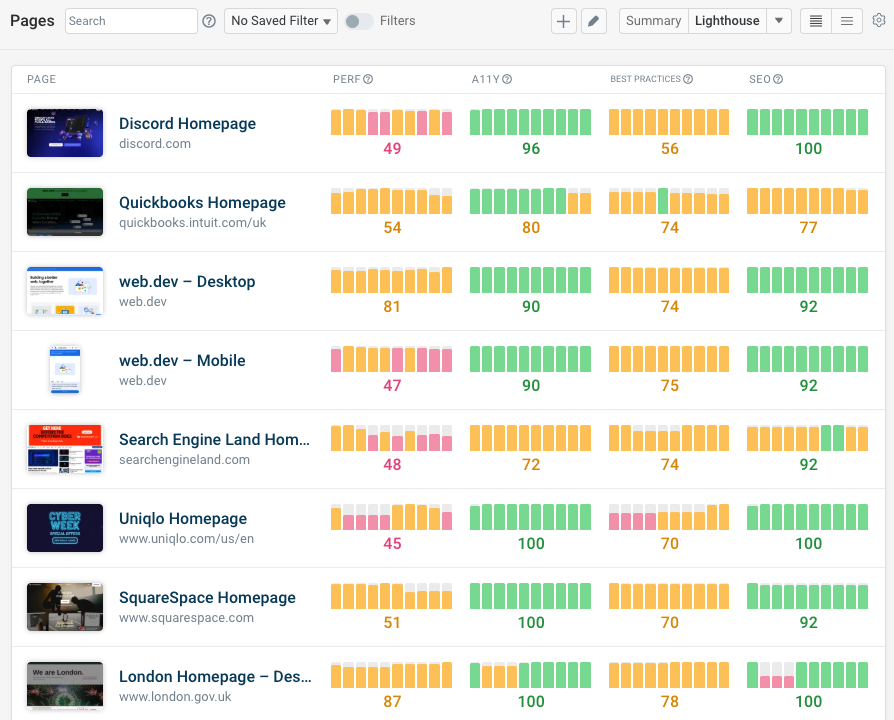
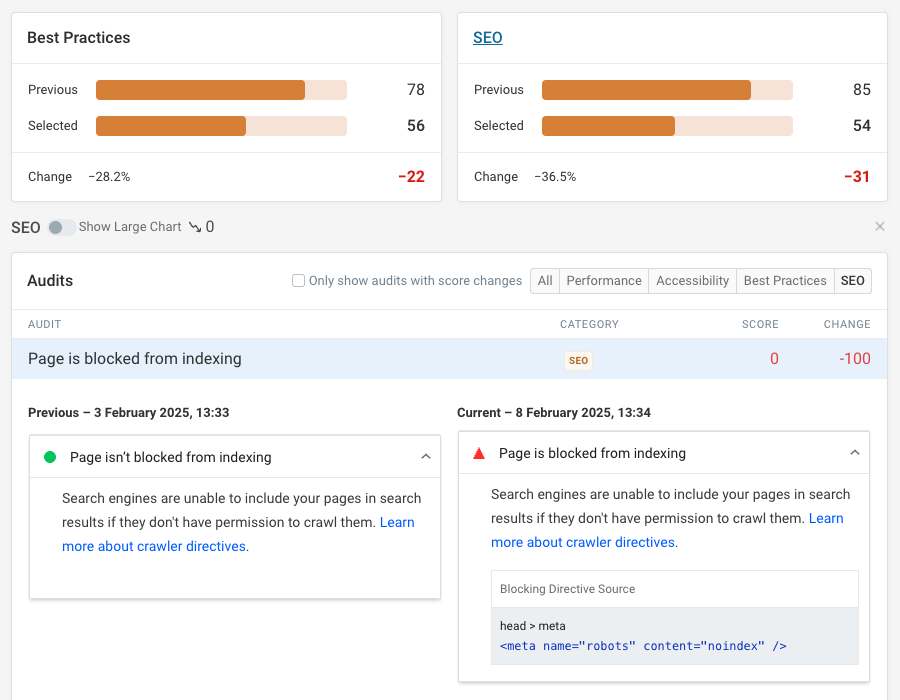
You can then go into each page to see the full Lighthouse web performance report as well as investigate any Lighthouse score changes.
For example, here we can see that a robots meta tag was added to the page that disabled indexing.
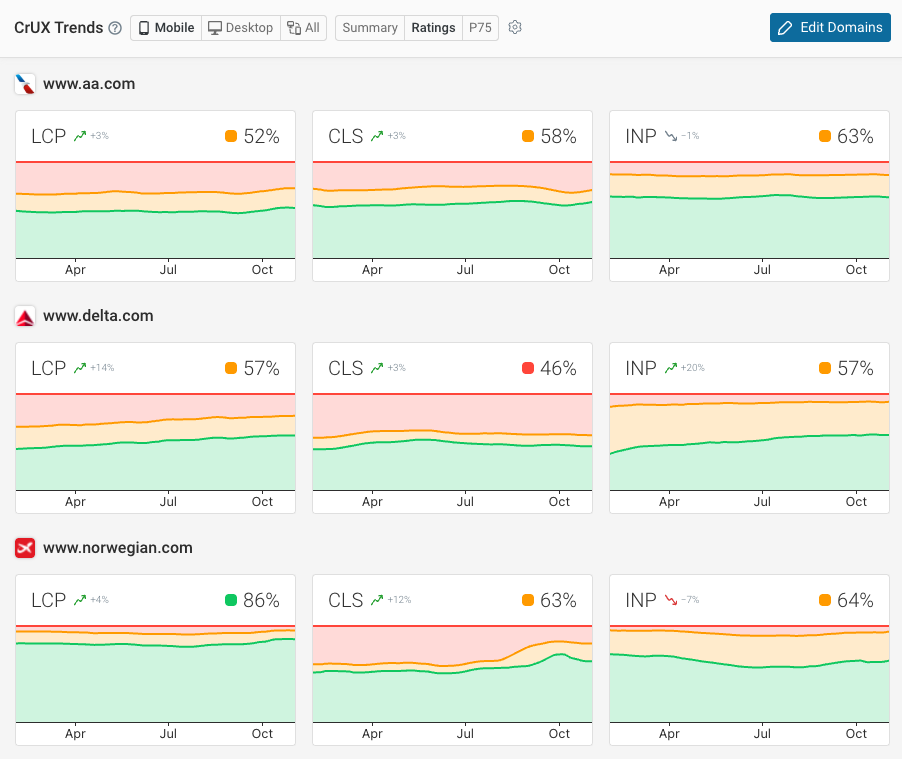
DebugBear doesn't just run scheduled Lighthouse tests. It also keeps track of the Chrome User Experience Report data that impacts rankings, as well as offering real user monitoring.
Sign up for a free trial to start monitoring Lighthouse scores and web performance for your website.


Monitor Page Speed & Core Web Vitals
DebugBear monitoring includes:
- In-depth Page Speed Reports
- Automated Recommendations
- Real User Analytics Data