Web performance has become a more important topic for Technical SEOs since Google has started using the Core Web Vitals metrics as part of its search result rankings.
This article looks at some of the tools you can use to measure performance and explains the advantages each tool brings.
Page Speed Insights
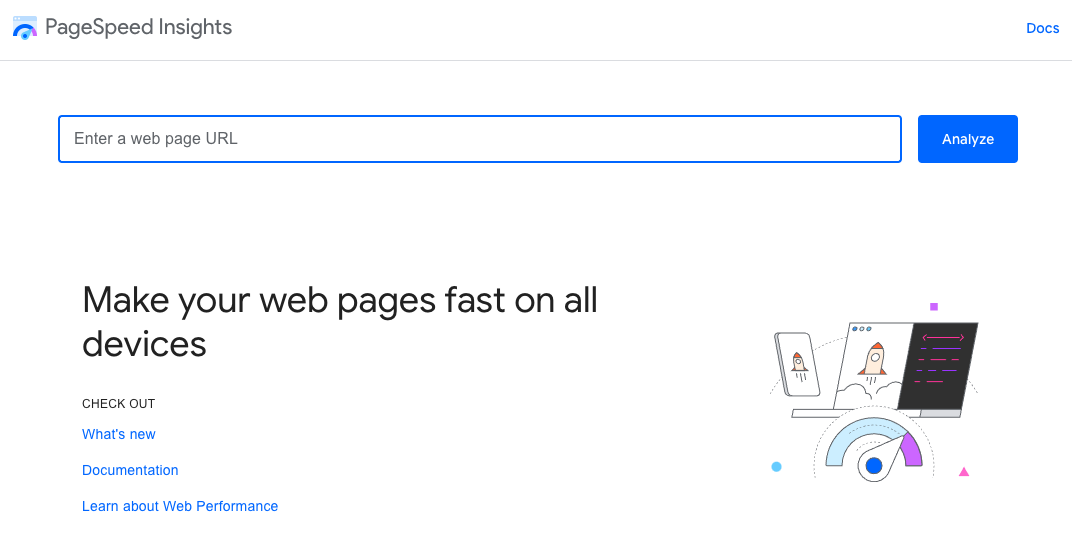
PageSpeed Insights (PSI) is probably the most well-known web performance tool. It's made by Google to help optimize your site and make it rank well.
To use it, simply paste the URL of one of your pages and Google will generate a report.
It provides both field data collected from real Chrome users and lab data collected by Google's Lighthouse tool. The Lighthouse report includes the Performance report and the SEO report. Try our website SEO checker for a quick SEO audit of your site.
Field data
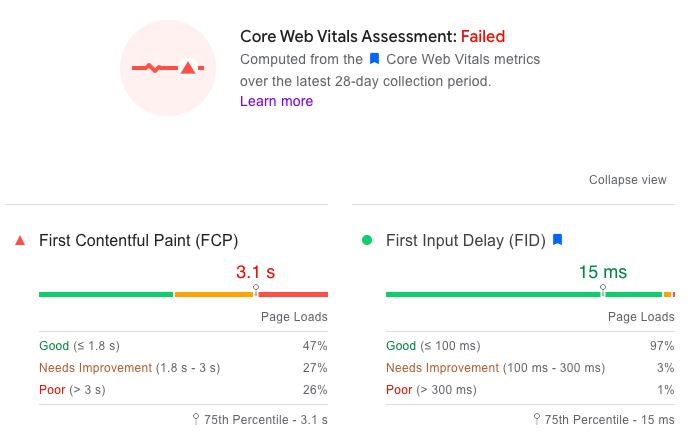
These real-user metrics (collected "in the field") are what Google uses as a ranking signal. Depending on how much traffic the tested page gets, Google provides either URL-level or origin-level data:
- URL-level data has been collected from visitors of this particular page
- Origin-level data has been collected across the entire website (well, subdomain technically)
Real-user data combines many individual experiences, so PSI shows two types of statistical information:
- 75th percentile – this means that 25% of users had a worse experience than this metric, while the site was faster than this value for 75% of users
- Rating buckets - Google has thresholds to rate a metric as "Good" or "Poor". Grouping user experiences into these buckets lets you see what percentage of users had a "Good" experience.
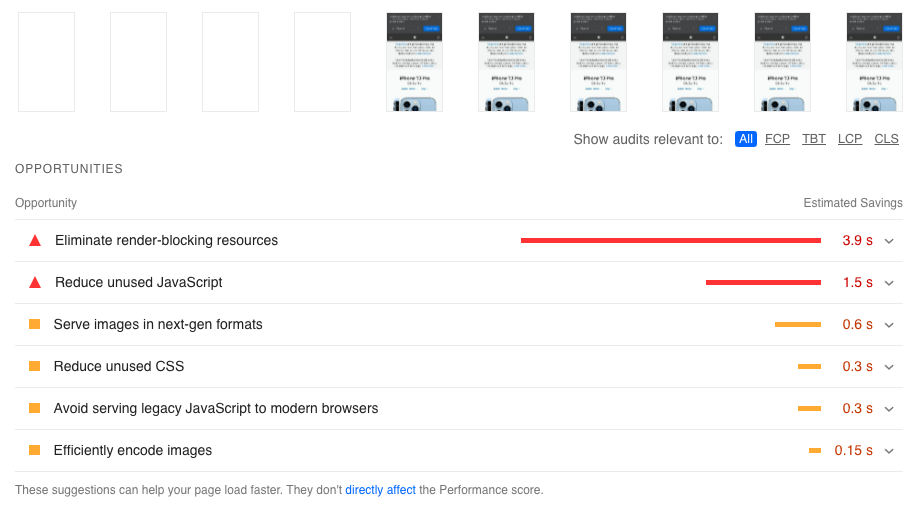
Lab data
Field data tells you how your users experience your website, but doesn't provide much data to help you debug problems. That's where lab data comes in, which is collected in a controlled server environment. Read more about lab vs field data here.
Google's lab data tool is called Lighthouse, and this is what PSI uses as well. The Lighthouse report provides suggestions on how to optimize your website. However, as we'll see below, the Lighthouse data provided by PSI can be inaccurate.
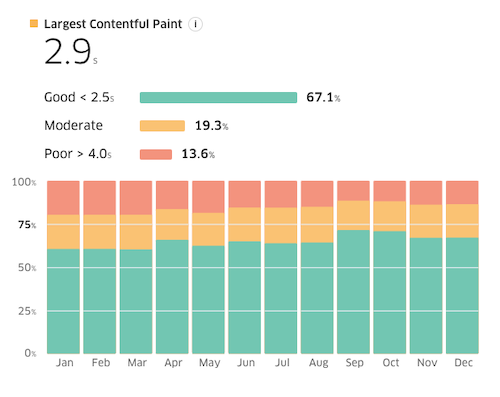
Treo Site Speed
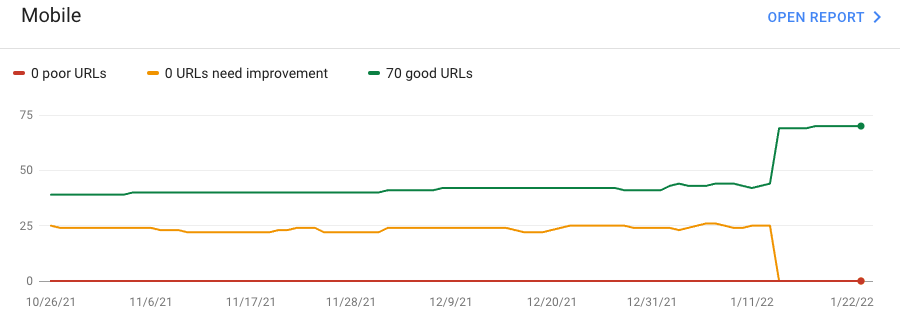
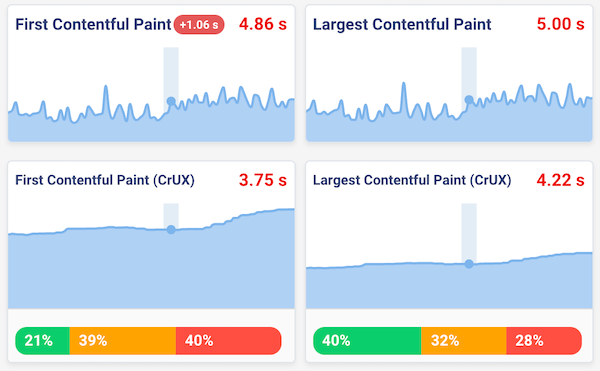
PSI shows how fast a website was over the last 28 days. Treo Site Speed sources field data from Google and lets you see how your site performance has changed over the last 12 months.
Unlike PageSpeed Insights, Treo Site Speed always shows origin-level data.
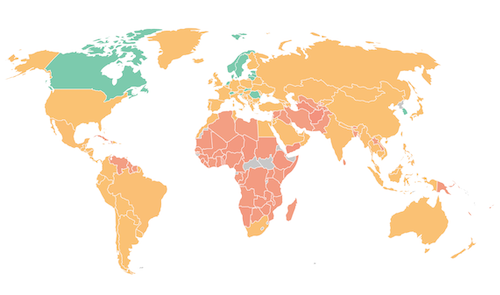
Treo also provides an amazing map that lets you see how users in different locations experience your website, as long as Google has enough data.
Google Search Console
The Core Web Vitals section of Google Search Console shows which of your pages are not receiving a ranking boost due to performance.
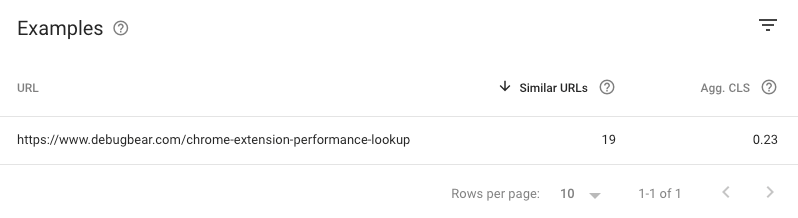
So far we looked at URL-level or origin-level data. Search Console introduces a new level of granularity: page groups. If Google doesn't have enough data for one of your pages, it will instead use data for similar pages on your website.
When you see examples of specific slow pages, make sure to check the number of Similar URLs and click on the page group to see what other pages are included in this group.
DebugBear
DebugBear monitors Lighthouse scores and Core Web Vitals over time. Both lab and field data are tracked at the URL-level, as long as Google provides this data.
The Lighthouse data provided by DebugBear is also more accurate than what you see in tools like PageSpeed Insights. This is because, by default, Lighthouse uses something called simulated throttling which can introduce inaccuracies.
Having continuous Lighthouse monitoring in place also means you can quickly detect performance regressions and analyze what caused them.
DebugBear also offers a real-user monitoring solution to collect performance data from your actual users.
WebPageTest
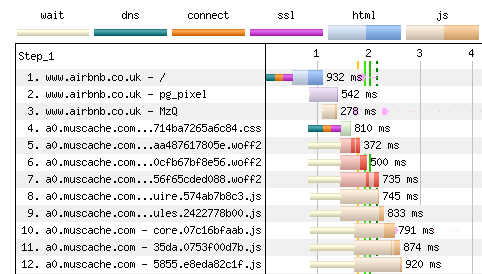
WebPageTest runs high-quality one-off performance tests in a lab environment.
Its request waterfall allows you to perform an in-depth technical analysis of your site speed, looking at details like server connections and resource prioritization.
The connection view in particular helps understand how the browser manages server connections and how you can optimize them.
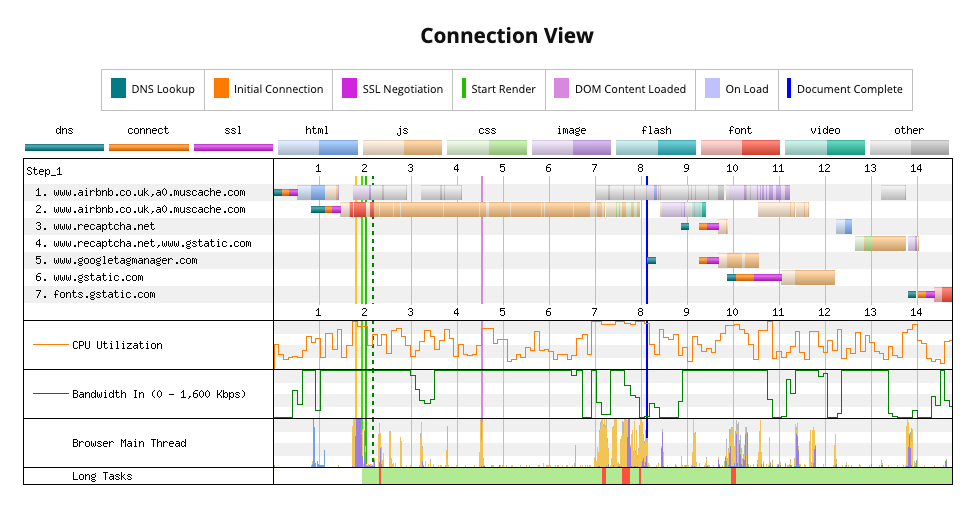
WebPageTest also offers technical features few other tools offer, like the ability to specify custom Chrome flags or capture a network packet trace with tcpdump.
Start with a free speed test
Get a quick assessment of your website speed with our free page speed test. See how fast your website is for real users and what you can do to optimize it.