
Google Search Console is a free tool that offers a valuable look behind the scenes at how Google sees and indexes your website, showing you how your website performs in search results and what you can do to improve it.
Because it's built by Google itself, you can get very accurate statistics (rather than the estimated traffic figures you'll find in other SEO tools), check if there are any errors in Google's index, and even request updates to how your content appears.
Whether you're a website owner, SEO professional, or digital marketer, understanding all of Google Search Console's features will help you fix any issues that could be hurting your search rankings and maximize your online visibility. Let's jump in.
How to set up Google Search Console
To get started with Google Search Console, you'll first need to verify that you control the website in question. Unlike other SEO tools, Search Console only gives you information on sites you actually run. So there's no snooping on your rivals' results, unfortunately!
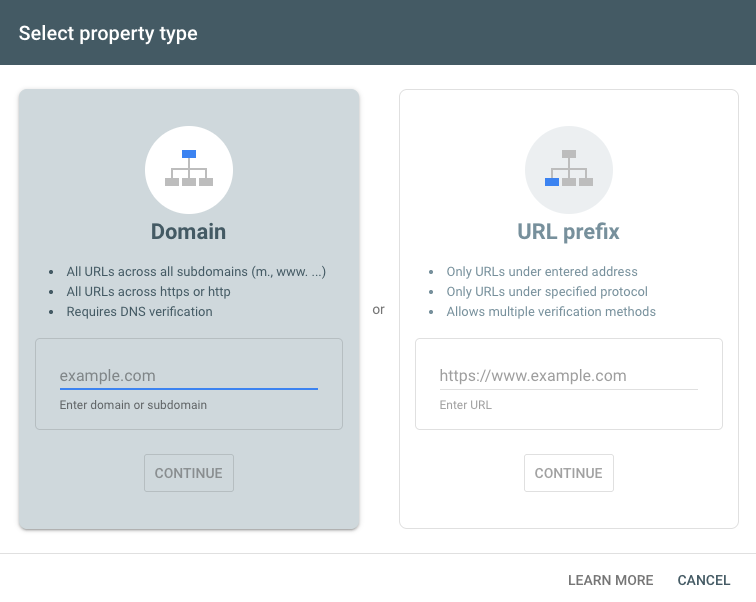
The best way to verify ownership is by adding a custom DNS record with your domain registrar. This verifies your whole domain, which means you'll have access to Google data for all your subdomains, and both http:// and https:// traffic.
If adding a DNS record isn't possible, you can verify that you own a 'URL-prefix property' using other methods, such as uploading an HTML file, adding an HTML tag to your homepage, or connecting Search Console to an existing Google Analytics account. But these methods are a little less thorough: for example, if you verify the URL-prefix property https://example.com, you'll miss data on URLs that start with http://, www., subdomain..
How to use Google Search Console tools: a tutorial
Once you've verified your ownership, you'll land on the Overview page of Google Search Console. It provides a high-level overview of organic search traffic from Google, as well as insights into how your website appears in search results.
Along the left-hand side, you'll see a range of available reports, each with a different use case.
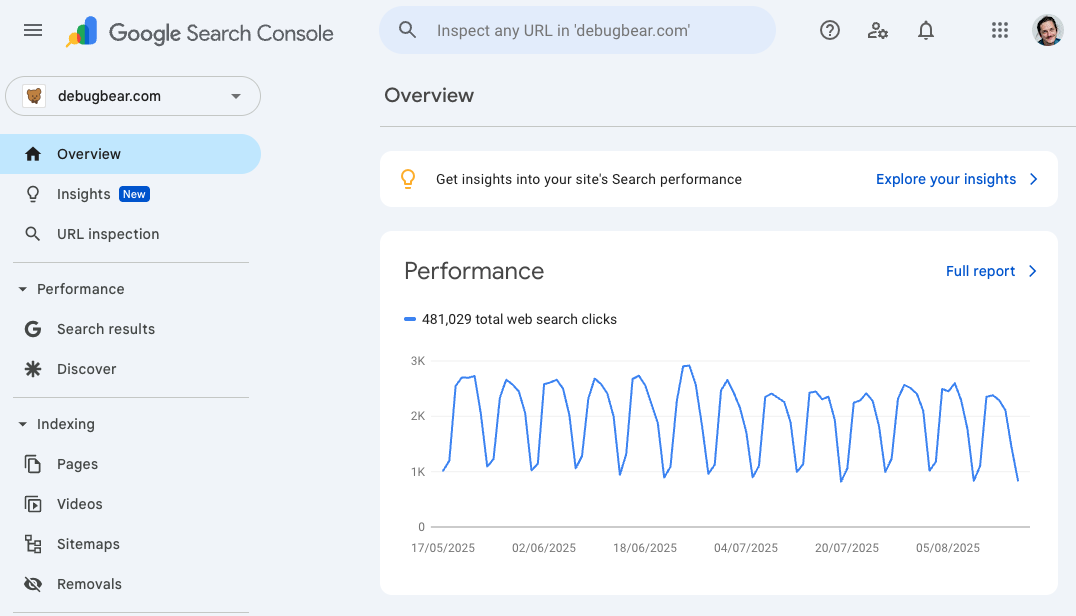
Some of the most common uses of Google Search Console include:
- Measuring your overall search traffic with the Search results dashboard
- Requesting that Google indexes a new page on your site using URL inspection
- Identifying pages with declining traffic (that might need updating) in Insights > Trending down
- Monitoring your overall page speed performance in Core Web Vitals
Let's take a look and see how you can use each of these tabs to optimize SEO for your website.
Insights: see which pages are gaining or losing traffic
This simple dashboard gives you a summary of which pages are getting the most traffic (under Top), and the most notable rises and falls in search visibility.
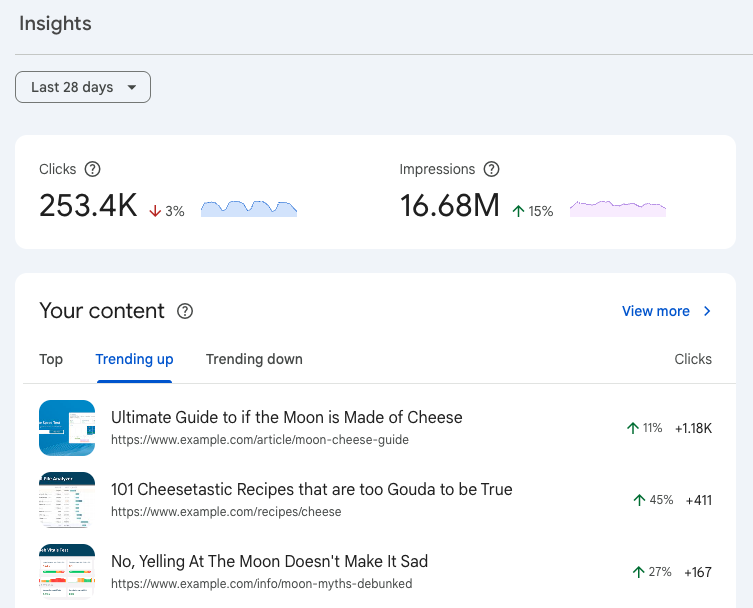
While it's always great to celebrate your successes, the 'Trending down' tab is the most useful from an SEO standpoint, giving you a ready-made list of pages that might benefit from an update.
You can also choose to compare traffic over the past week, month, or quarter. Try all three to see what secrets they reveal.
URL inspection: check a particular page is listed on Google
This tab simply answers one question – is a particular page listed by Google or not? You can enter any URL from your site to check it's appearing in search properly.
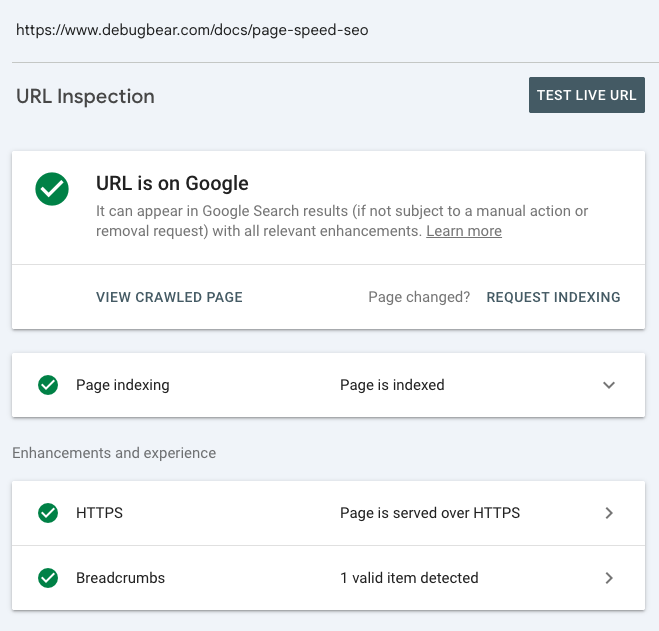
Most commonly, you'll want to visit this page when you've just published some new content, but it hasn't been crawled by Google yet. Rather than wait for Google to discover the page organically, you can simply enter the URL of your latest creation, then choose Request Indexing.
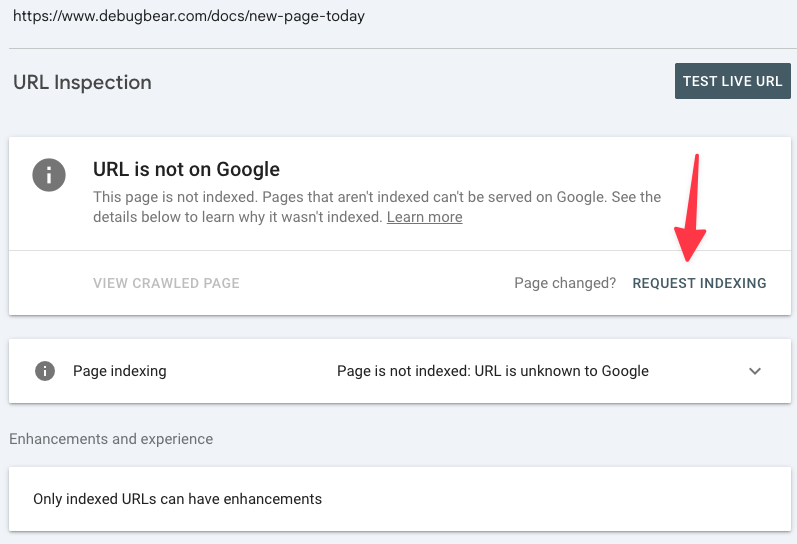
This should cause your page to appear in Google's index much faster.
Performance: get an overview of your Google traffic
The Performance section tells you about how often your website shows up in search results, what keywords you're ranking for, and whether you're showing up in Google Discover recommendations.
Search results: see how you're doing in Google search
This tab reveals your all-important traffic from Google. Let's dive in! Up top, you'll see a simple view of your search traffic, day by day:
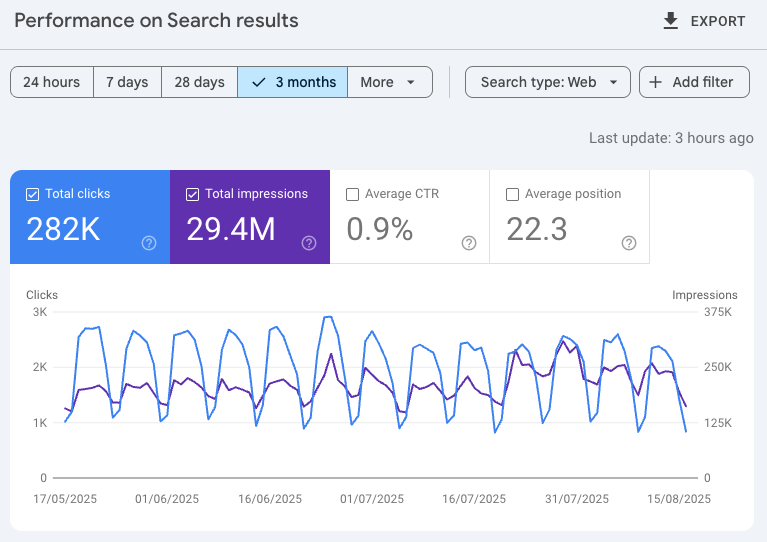
No matter the timescale you select, this data is always depicted at a daily resolution, so if your site is more business-oriented and gets more traffic on weekdays, you'll end up with a jagged graph like this.
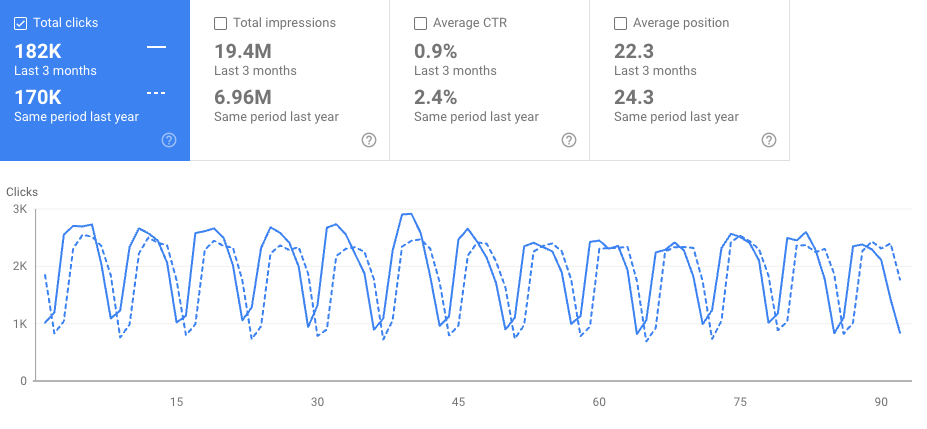
You can use the timeframe selector at the top to extend the range of the graph, or compare two timeframes head-to-head, such as this month vs. last month, or this quarter vs. the same quarter last year.
Filtering Google search traffic data
The filters at the top let you examine a subgroup of visits from Google. For example:
- Pages: only people landing on URLs with
/product/in – or excluding visits to/articles/pages - Queries: exclude searches with your brand name in – or focus on searches for a particular keyword
- Countries: show only visitors from the USA – or exclude visits from India
- Device: ignore visitors on mobile devices – or only include users on tablets
Note that you can't stack multiple filters of the same type, for example...
- you CAN filter for 'German visitors to
/video/*URLs' (because it combines a country and page URL filter) but - you CAN'T filter for 'visitors to
/playlist/OR/user/URL paths' (because they are both page URL filters.)
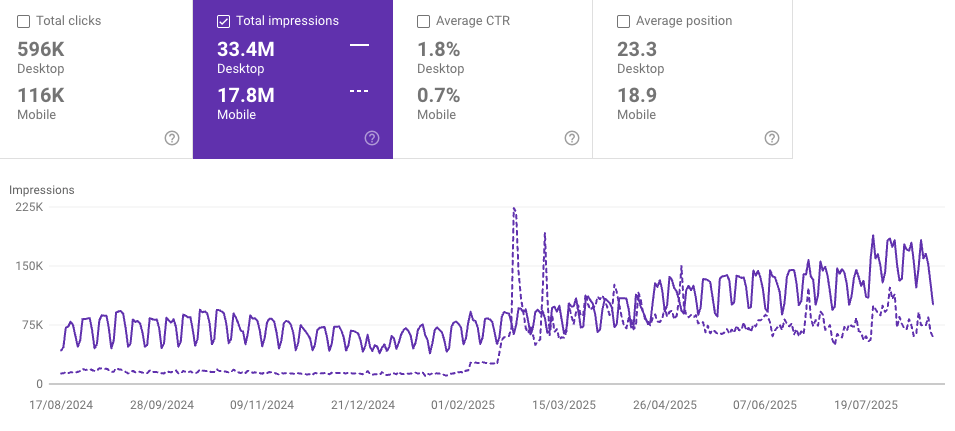
You can also compare results for two different filters, for example, desktop vs. mobile traffic:
Beneath the graph itself, you can find a leaderboard of relevant queries and pages.
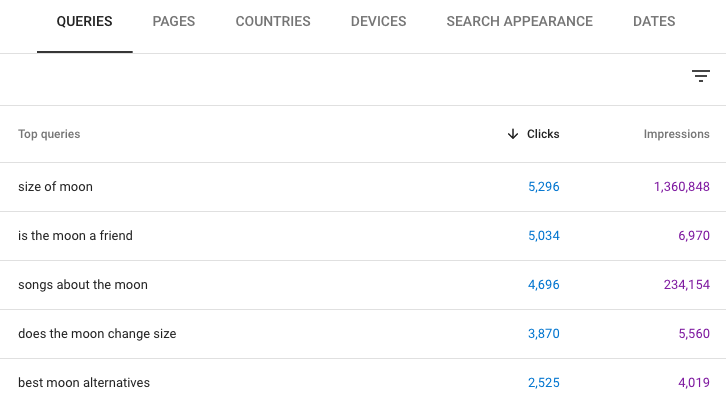
If you click on a particular item in this leaderboard, the results will instantly be filtered to display only traffic for the relevant item, and the graph will update accordingly. This helps you discover the exact queries that are generating traffic for a particular page, or create a graph of visits for one particular query over time.
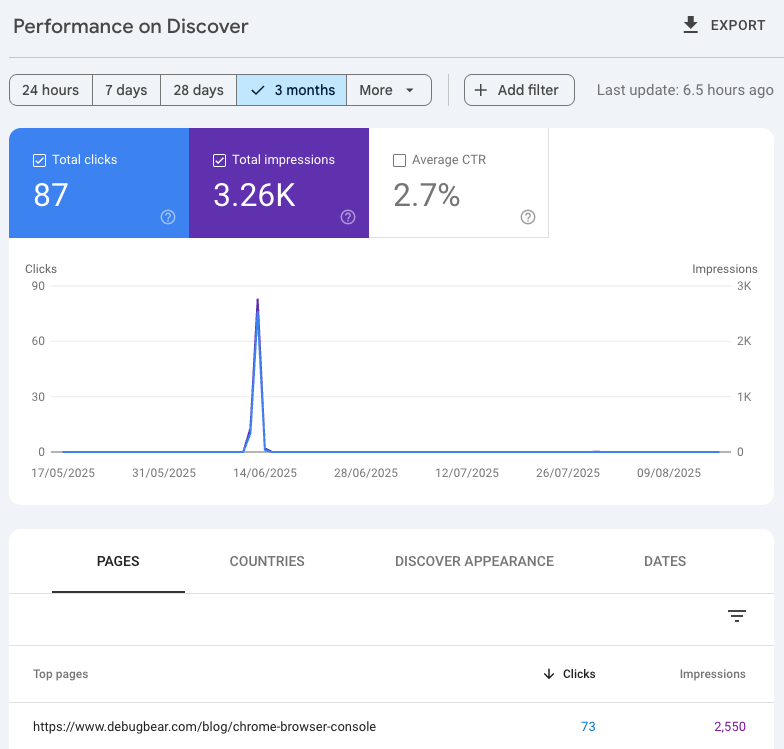
Discover: check out if you've appeared in Google Discover
In the Google mobile app, or on Android devices, Google displays a feed of content related to a user's interests beneath the search bar, a product feature known as Google Discover. It usually promotes 'editorial'-style content such as news articles, blog posts, recipes, videos and so on.
If any of your content has been recently featured in Discover, you'll see it listed here.
Indexing: ensure your content is being listed by Google
Pages: check your website's pages are being indexed
This graph gives a breakdown of the URLs that are either indexed - or ignored - by Google. At first glance, you might be alarmed at how many of your pages are not being indexed by Google:
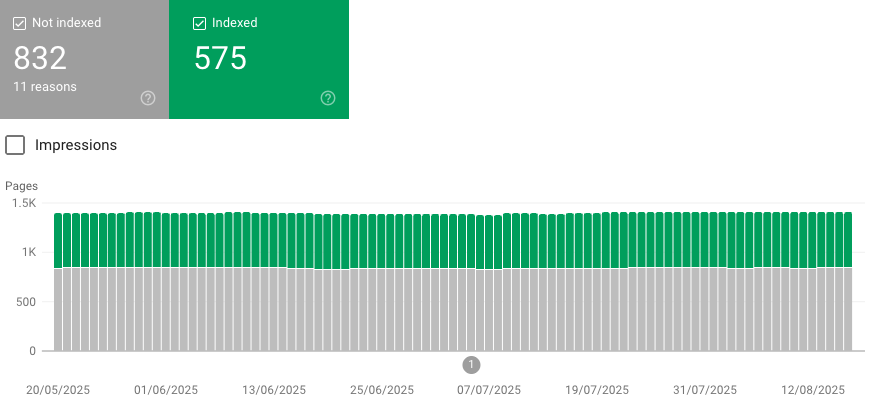
...but scroll down and you'll get a useful breakdown of the reasons pages aren't being included in Google's index. You'll often discover they're actually not problematic.
There are many innocuous and deliberate reasons a URL won't be indexed – and nor would you want them to be. For example:
- A broken URL that Google has discovered from another website, but has been mistyped, resulting in a 404 response
- An old page URL that you've updated, and now (properly) redirects to a live URL, so Google only indexes the new URL
- A URL that's just a duplicate of another page (for example, two URLs with different UTM parameters attached)
However, you might also find pages here that you DO want listed on your website, or other errors you want to resolve.
For instance, you might want to redirect your soft 404 and Not Found (404) URLs to relevant working pages. (The old URLs will still appear as 'Not Indexed', of course, but under the 'Page with redirect' category instead.)
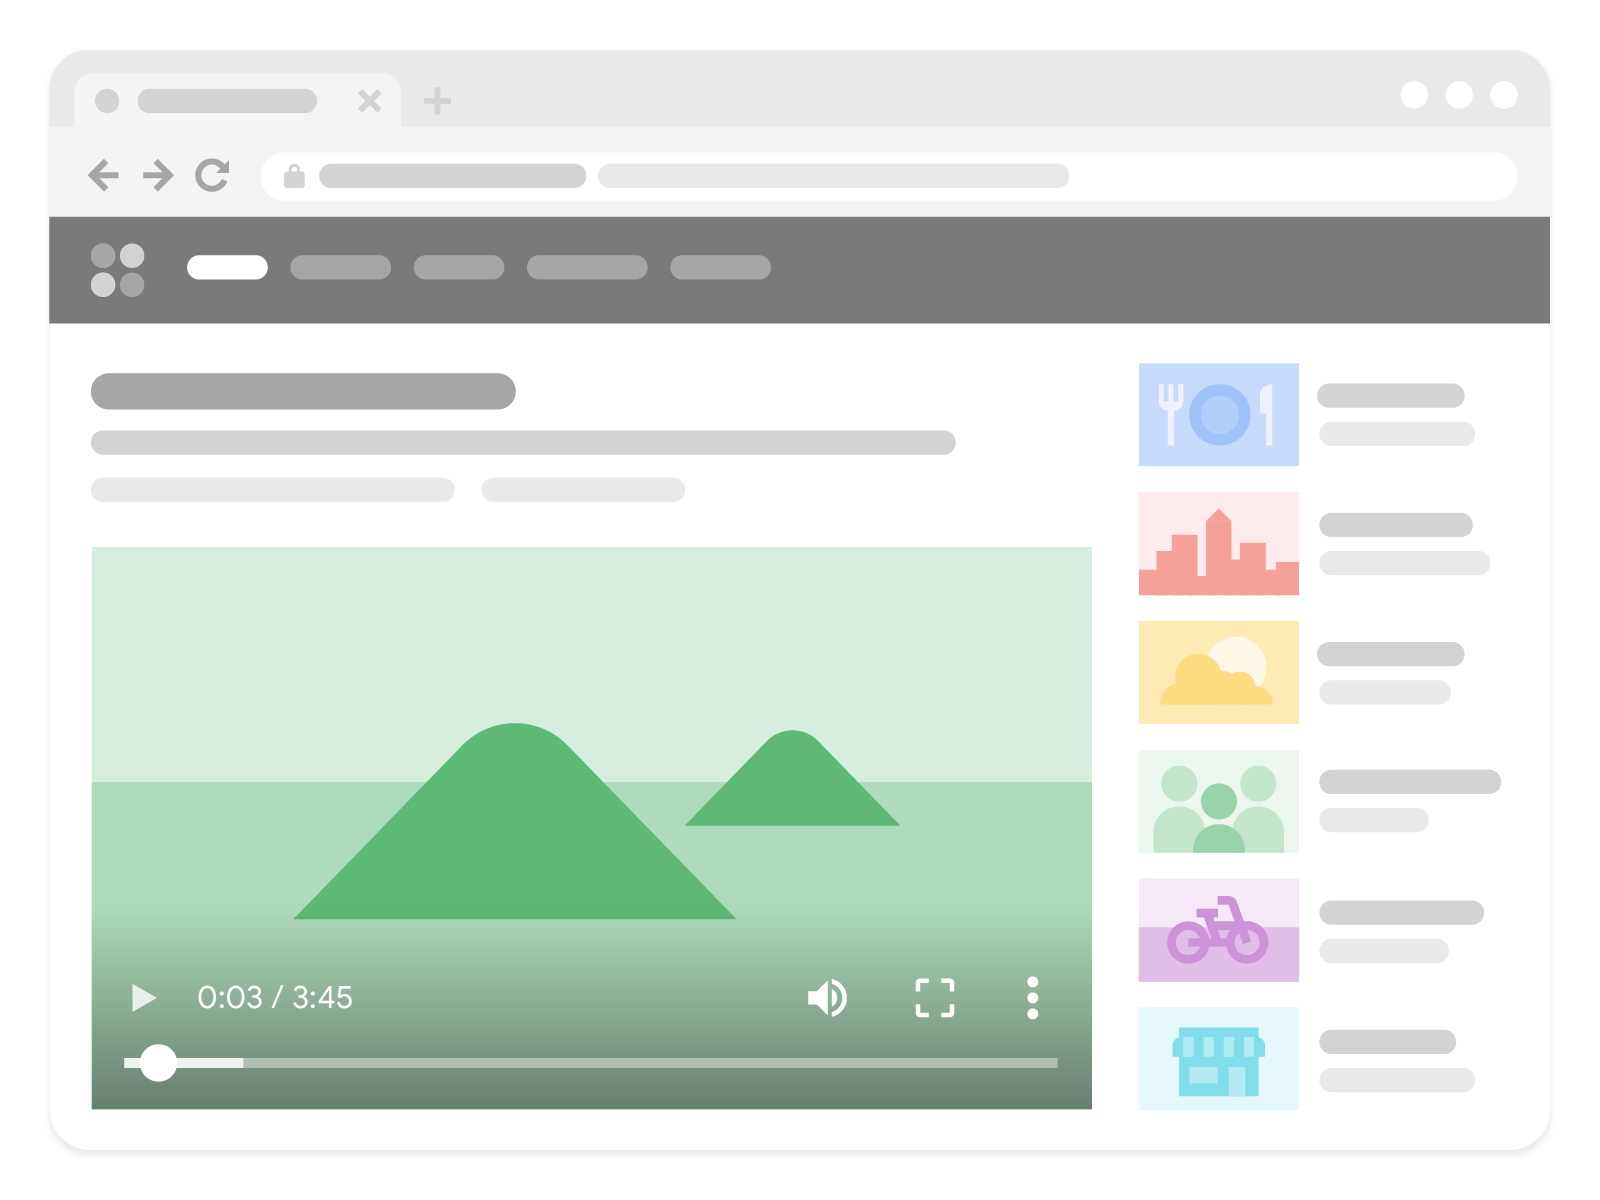
Videos: check if your video-based pages are being properly displayed
Note: this section is only relevant if your website has 'dedicated watch pages' - pages that are dedicated to individual videos, like a YouTube page, where the main purpose is for the user to watch the video. This sketch from Google shows the kind of content we mean:
For video-focused pages like these, Google tries to incorporate them in search results sections dedicated to video content, like this:
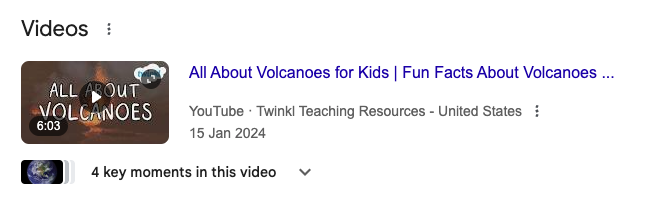
Note how this section provides extra information like a thumbnail with a play button, runtime, and 'key moments.'
So, in this part of Search Console, you can check to see if your video pages are being treated properly. In this graph we can see that half of the pages aren't being indexed as videos correctly:
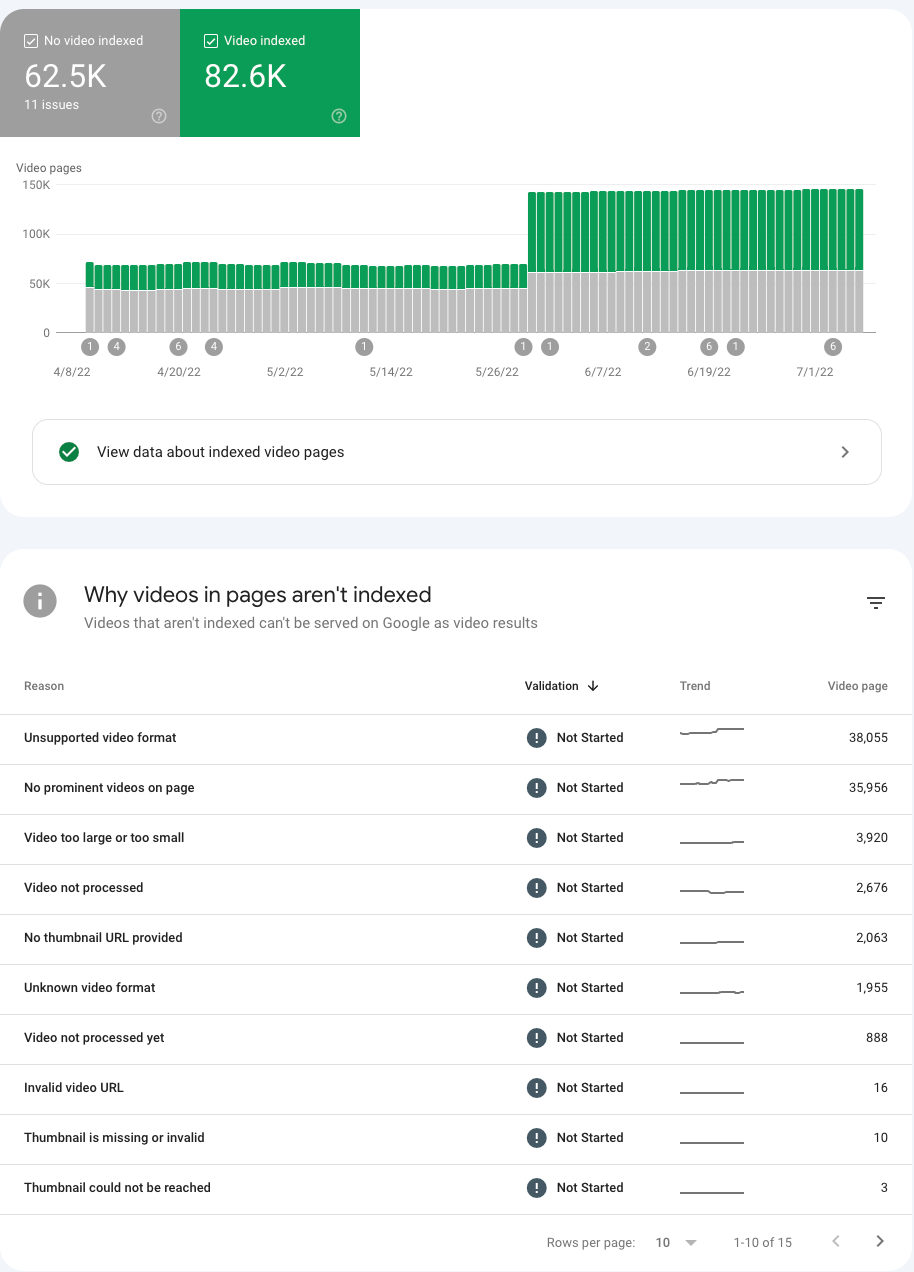
Below the graph, you'll be able to see all the different reasons why the videos aren't being indexed, so you can fix the issues.
Notice that if you do have pages with videos on them (for example, you frequently embed YouTube videos in article-style content), but they aren't dedicated watch pages, then you'll see them listed here as 'Video isn't on a watch page.'
But don't worry, this doesn't mean the articles aren't appearing in Google – only that the page isn't being classified as 'video content' in Google Search.
Sitemaps: check your sitemap has been processed correctly
If you've got a larger website, then offering a sitemap is a great way of explaining to crawlers like Google where all your content lives. If you have a smaller website, your CMS probably generates a sitemap automatically.
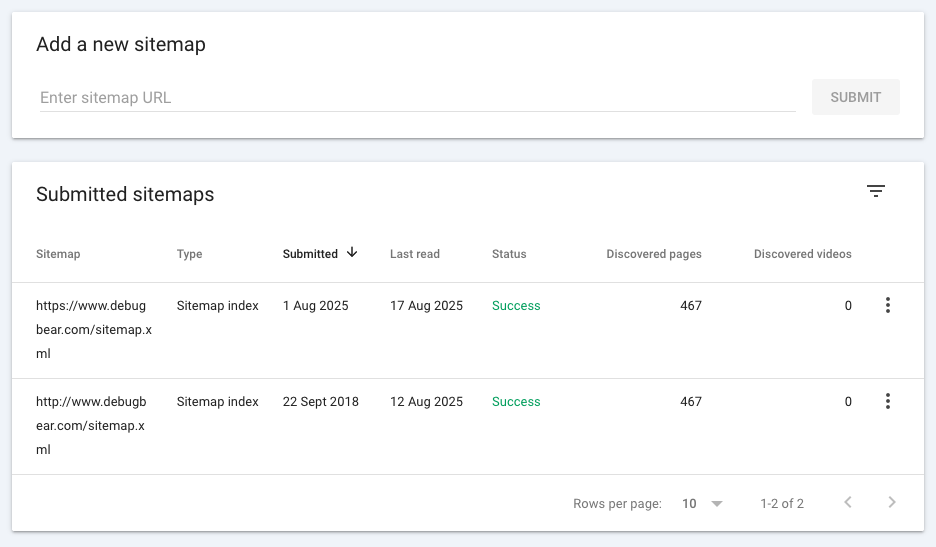
This page in Search Console lets you confirm your sitemap has been discovered and processed successfully. If you've manually generated a new sitemap, you can submit it here to upload.
Removals: rapidly remove unwanted content from Google
Perhaps you've accidentally published some content to your website containing inaccurate information, revealing an upcoming product too soon, or pushing 'test' content into production. Now it's showing up in search results, even after you've deleted it from your site!
Of course, if you've deleted it from your site, Google will discover that the content has been removed eventually – but you probably want it gone from search results today. You're in luck: the Removals tool can accomplish exactly that.
This tab lets you temporarily remove the URL - or the description snippet – from Google's search results.
Bear in mind the 'temporary removal' lasts for six months, so if this is content you DO want to launch in the near future, you'll want to do so at a different URL.
Experience: monitor your website's technical performance
This section contains an analysis of whether your website provides a good user experience by being fast and secure.
Core Web Vitals: are your pages loading for users fast enough?
Core Web Vitals reflect how quickly your pages load for your users, and poor scores here can have a negative impact on your SEO.
This set of graphs gives you a simple overview of your site's performance on mobile and desktop – your ultimate aim, of course, is to have 100% of pages categorized as 'Good.'
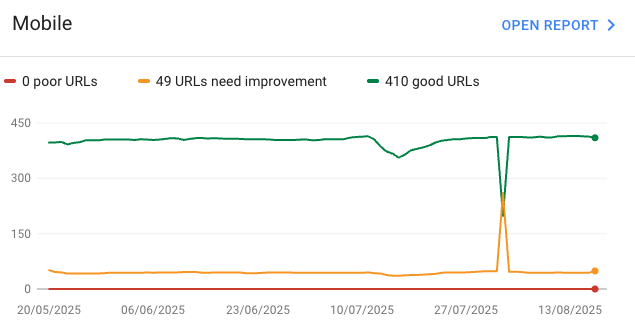
Click on 'Open Report' to see a similar view (click all the checkboxes at the top to reveal all three categories).
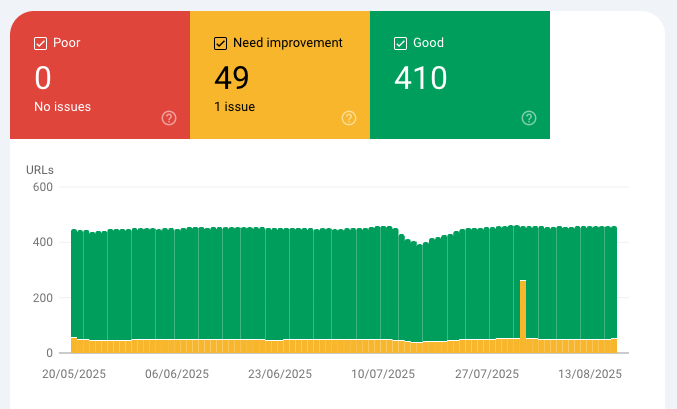
Then scroll down to get a glimpse of what types of pages are getting bad scores, and more importantly, why.
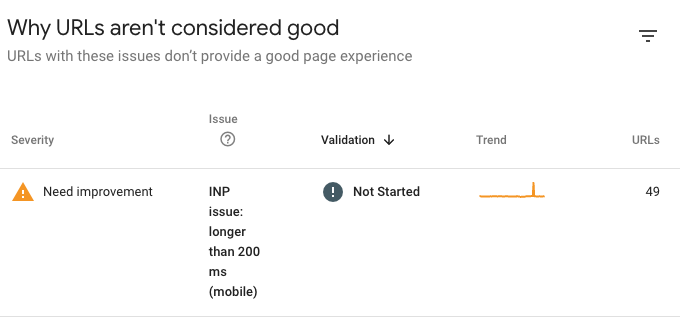
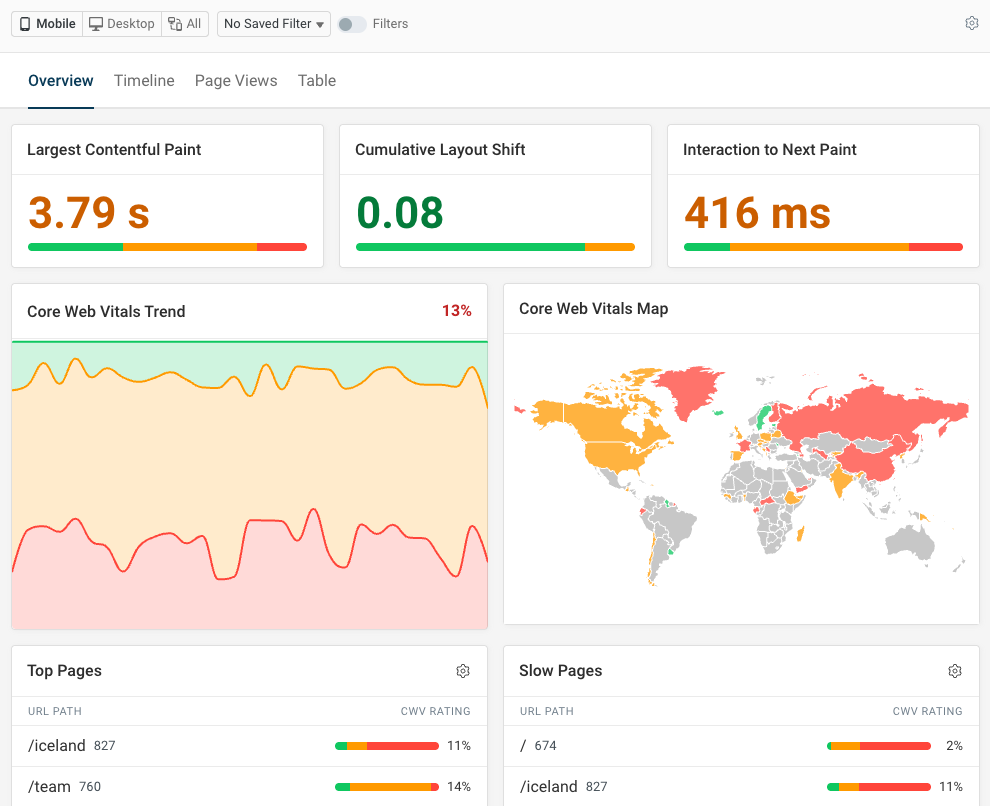
Thus informed, you can then use a tool like DebugBear to focus on the precise technical issues leading to these slowdowns.
One thing to note is that these scores are based on Google's CrUX report, which is an average of real-world users' experience over the past 28 days. This means that a change you make to your website today might not be fully reflected here for a whole month.
For quicker feedback to help you iterate, a real time user monitoring tool like DebugBear will give you live data on page speed, so you can rapidly confirm your improvements are having their intended effect.
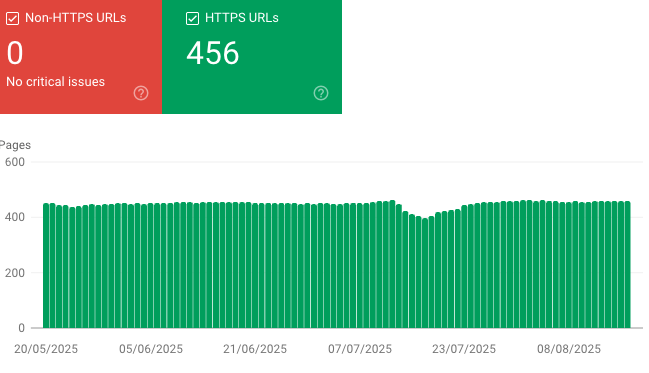
HTTPS: are your pages available securely?
This one's pretty simple – you want to be making sure your pages are all available securely via HTTPS. This graph confirms they are.
Enhancements
This section will list any relevant 'rich data' that you supply to Google – and whether it's correct. Google encourages structured data for particular content types, so it can display it using an enhanced format in search listings.
For example, here are some recipes as they appear at the top of Google search results:
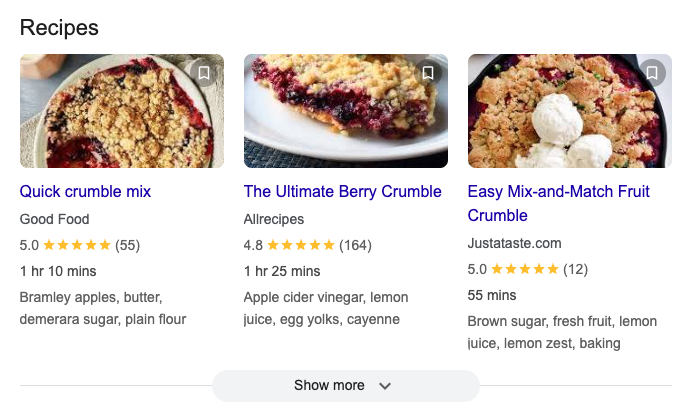
They appear in this prominent location, with star ratings, ingredients and thumbnails, because the publisher provides this information in a structured format.
Job postings, FAQs, shoppable products and event listings are just a few of over 25 content types available for enhancements. For each structured data type Google has discovered on your site, you'll get a tab that reveals if there are any issues.
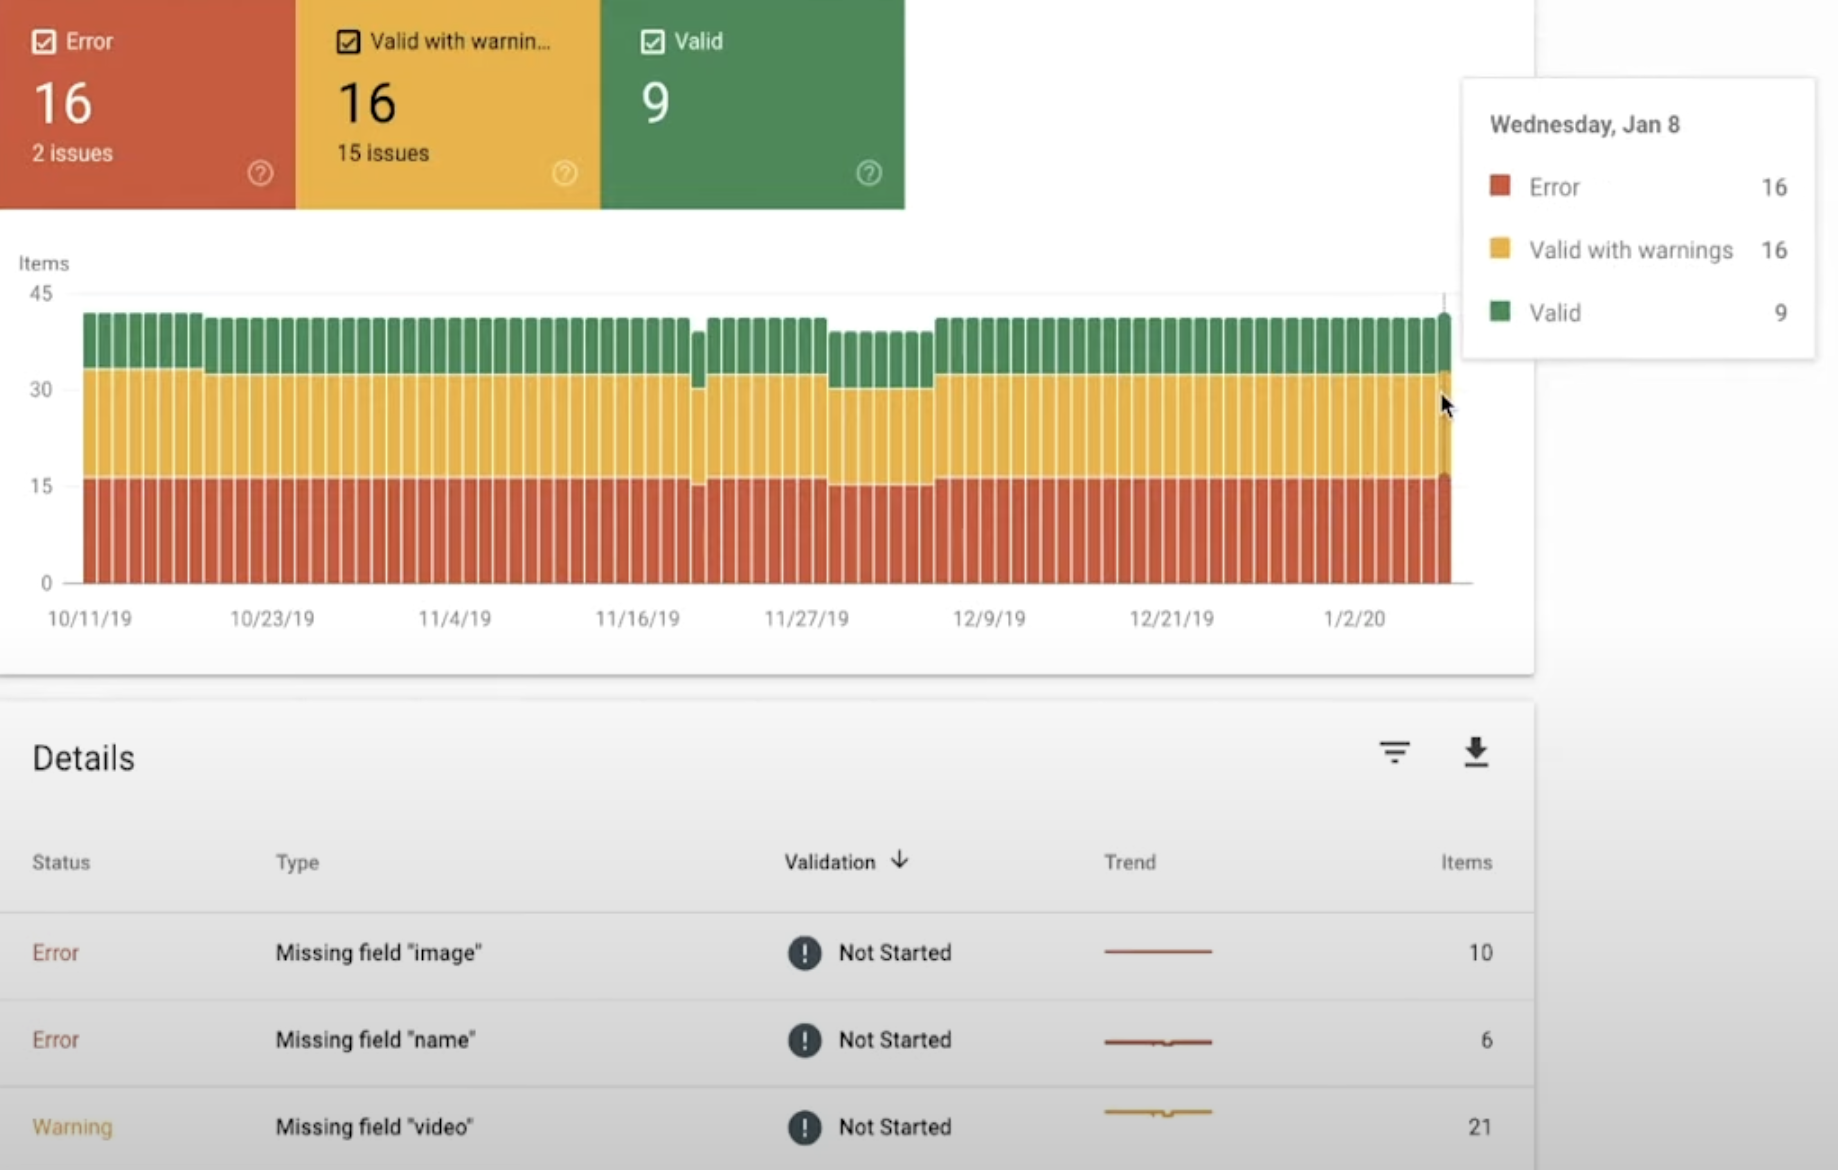
In the screenshot above, we can see that many recipes appearing on this website have warnings or errors attached.
Beneath the graph, you'll see the culprits broken out by issue – in this example, there are 10 recipes with missing images and 6 with missing names, so as a publisher, we can update these pages with all the necessary information.
Security & Manual actions
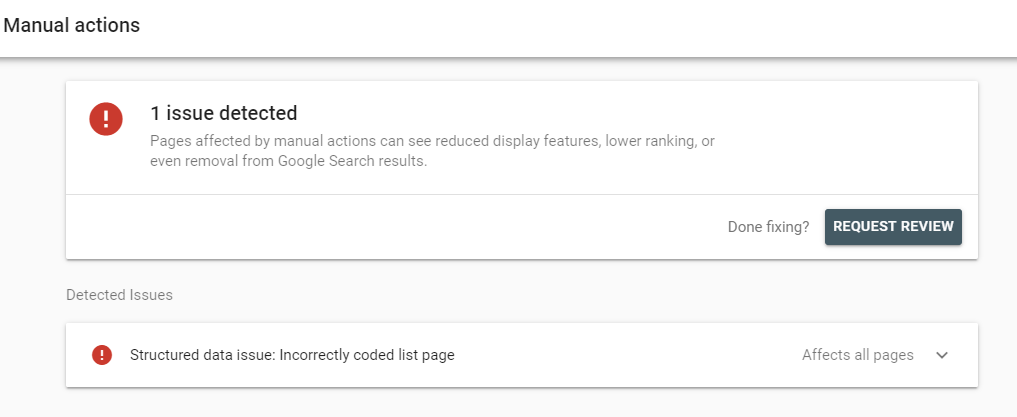
Google enforces certain content standards, and if your website is found to be contravening them, certain pages (or even your entire site!) might be unlisted. This could be caused by spammy comments appearing under articles, for example, or hacked pages displaying unwanted content.
If Google has taken any manual actions to unlist your content, or has detected any security breaches, you'll be notified about them here. Hopefully, you'll find you have a clean bill of health! If not, you'll need to take action to address the issues raised, then request a review to reinstate your content in Google's listings.
Links
This tab gives you a snapshot of both internal and external links to your website.
- External links > Top linked pages shows which of your pages have earned the most links from other websites – really useful for SEO!
- Top linking sites shows the external websites that have linked to your website the most often
- Internal links > Top linked pages shows which of your pages get the most links from other pages on your website.
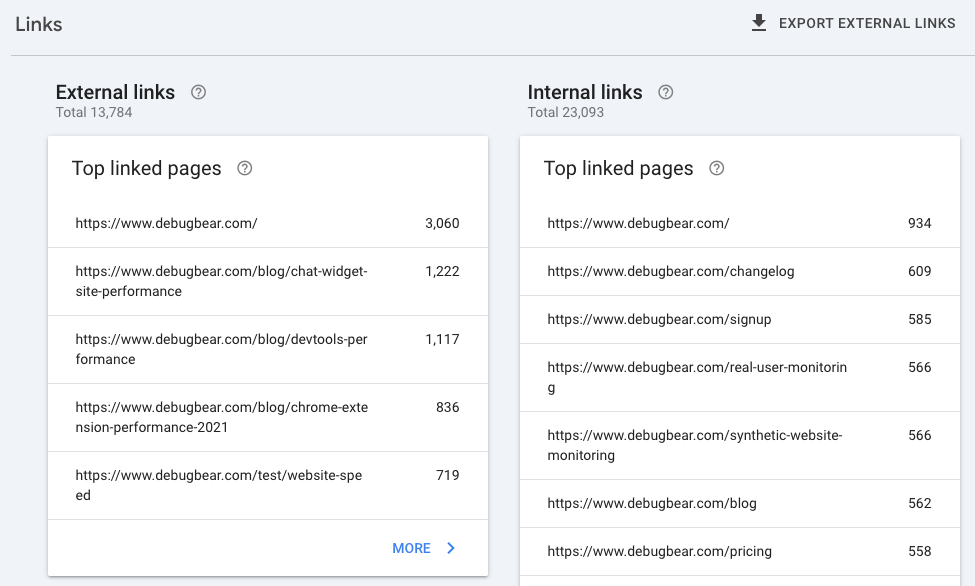
Via the web interface itself, there's no way to discover the exact external URL that's providing the backlink - so you can see you're getting a link from somewhere on bbc.co.uk, but not the precise article. But there's a workaround: choose 'Export external links' in the top-right, and you'll be able to download a spreadsheet of specific URLs that feature links to your site.
Unlike more advanced SEO tools, there's no way to sort your top linking sites by how important they are, only by the total number of links. That makes it harder to spot high-value inbound links that can have a beneficial impact on your overall site authority.
Still, it's a nice free tool to have, and if you don't get a lot of backlinks, perhaps it's all you need!
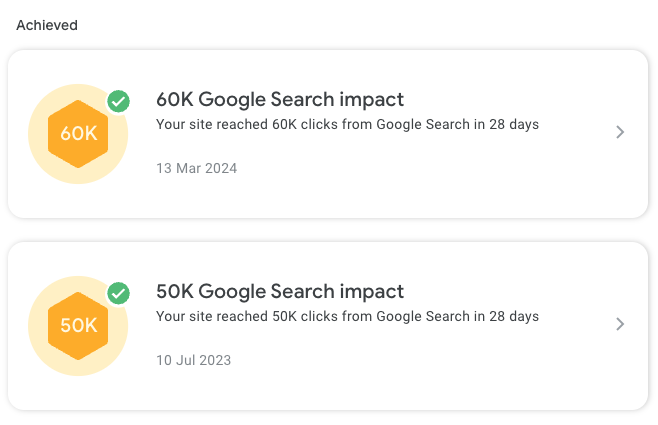
Achievements
Once you've set up Google Search Console, you'll start receiving occasional emails from Google congratulating you as you hit new search traffic milestones. On this tab, you can find an archive of all the achievements you've earned so far. Well done you!
Wrapping up
Whatever suite of SEO tools you use, Google Search Console is likely to have a place in your toolbox, offering unique features (like requesting page indexing from Google) that you won't find anywhere else.
If you've uncovered Core Web Vitals issues, or want to boost your presence in search by improving your page speed, then give DebugBear a try. It will give you additional insight into anything slowing your website down, tips on fixing it, and real-time data on your users' experience – well before the data starts showing up in Google.


Monitor Page Speed & Core Web Vitals
DebugBear monitoring includes:
- In-depth Page Speed Reports
- Automated Recommendations
- Real User Analytics Data